. 2022 Nov 14;61(46):e202211066.
doi: 10.1002/anie.202211066. Epub 2022 Oct 25.

From Local Covalent Bonding to Extended Electric Field Interactions in Proton Hydration

Affiliations

From Local Covalent Bonding to Extended Electric Field Interactions in Proton Hydration

Maria Ekimova et al. Angew Chem Int Ed Engl. .

Abstract

Seemingly simple yet surprisingly difficult to probe, excess protons in water constitute complex quantum objects with strong interactions with the extended and dynamically changing hydrogen-bonding network of the liquid. Proton hydration plays pivotal roles in energy transport in hydrogen fuel cells and signal transduction in transmembrane proteins. While geometries and stoichiometry have been widely addressed in both experiment and theory, the electronic structure of these specific hydrated proton complexes has remained elusive. Here we show, layer by layer, how utilizing novel flatjet technology for accurate x-ray spectroscopic measurements and combining infrared spectral analysis and calculations, we find orbital-specific markers that distinguish two main electronic-structure effects: Local orbital interactions determine covalent bonding between the proton and neigbouring water molecules, while orbital-energy shifts measure the strength of the extended electric field of the proton.

Keywords: Eigen Cation; Electronic Structure; Hydrated Proton; Soft X-Ray Absorption Spectroscopy; Zundel Cation.


Conflict of interest statement

The authors declare no conflict of interest.

Figures

Figure 1
Figure 1
O K‐edge absorption spectra of a) H2O in the gas phase, b) H2O monomer in acetonitrile solution, and c) the hydrated proton complex H7O3 + prepared in acetonitrile prepared as 50 % H7O3 + and 50 % H7O3 +⋅H2O, i.e. the H7O3 + moiety, equivalent to a [w1⋅H3O+⋅w2] complex, contributes about 86 % to the experimental O K‐edge spectrum, and w3 only with 14 %. The gas phase result of H2O was taken from ref. [13b]. Snapshots of the 4a1 LUMO, contributing to the pre‐edge peak, for the water monomer (d) and H3O+ (e), both as isolated species and as solute embedded in acetonitrile solution. The similar shapes of the LUMOs of H7O3 +, reached upon oxygen 1s core excitation from the respective H2O and H3O+ units, are also clearly apparent (f).
Figure 2
Figure 2
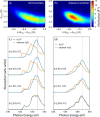
a) Measured O K‐edge spectra scaled by oxygen number as measured for [HI] : [H2O]=1.0 : 3.5 and 1.0 : 8.0 (0.5 M HI : 1.75 M H2O and 0.5 M HI : 4.0 M H2O, respectively) in acetonitrile solution. b) Comparison of the spectral signatures of 0.75 M (orange) water in acetonitrile with those derived for the inner complex H7O3 + (purple) and hydration shell water (dark cyan) around the inner complex H7O3 + in acetonitrile. Panels (a), (b) show the excitation frequency range discussed in this study, and panels (c), (d) a blow‐up of the pre‐edge transition spectral region, to indicate the significant frequency shift of the pre‐edge of hydration shell water around the inner hydrated proton complex compared to that of water in acetonitrile.
Figure 3
Figure 3
Structural correlations in the H5O2 + (H3O+ and w1) species and associatived sensitivity in the O K‐edge XA spectra. Panels (a) and (b) display the correlation between the ROa‐Ob distance and the proton‐asymmetry parameter “δ=RHOa‐RHOw” in the Zundel species for the simulations of H5O2 + in acetonitrile solution and H+(aq), respectively. Panels (c) and (d) contain the sampled O K‐edge XA spectra for the central H5O2 + (H3O+ and w1) species from simulations of H5O2 + in acetonitrile solution and H+(aq), respectively, decomposed into classes of varying O−H+⋅⋅O δ asymmetry from the symmetric species near δ≈0 Å to highly asymmetric species with δ≈0.5 Å.
Figure 4
Figure 4
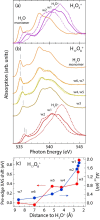
Theoretical O K‐edge spectra sampled over AIMD simulations, calculated using the half‐core hole approximation, decomposed by the respective contributions of the inner H3O+ (dashed lines), first closest neighbour H2O (solid lines), second neighbour H2O (dash‐dotted lines) and water molecules at further distances (solid lines) for (a) H2O monomer (orange) and H7O3 + (purple), and (b) H17O8 + (red, yellow and orange), all dissolved in acetonitrile. The magnitudes are scaled to each other. Panel (c) shows how for the individual water molecules of H17O8 + in acetonitrile the change in dipole interaction energy ΔU cd and the pre‐edge frequency shift compares to the water monomer as a function of the distance from H3O+.

References

    1. Marx D., Tuckerman M. E., Hutter J., Parrinello M., Nature 1999, 397, 601–604.
    1. Eigen M., Angew. Chem. Int. Ed. Engl. 1964, 3, 1–19;
    2. Angew. Chem. 1963, 75, 489–508.
    1. None
    1. Hickner M. A., Ghassemi H., Kim Y. S., Einsla B. R., McGrath J. E., Chem. Rev. 2004, 104, 4587–4611; - PubMed
    1. Kreuer K.-D., Paddison S. J., Spohr E., Schuster M., Chem. Rev. 2004, 104, 4637–4678. - PubMed

Publication types

LinkOut - more resources