. 2022 Dec;258(4):408-425.
doi: 10.1002/path.6011. Epub 2022 Oct 21.

Periostin- and podoplanin-positive cancer-associated fibroblast subtypes cooperate to shape the inflamed tumor microenvironment in aggressive pancreatic adenocarcinoma

Affiliations

Periostin- and podoplanin-positive cancer-associated fibroblast subtypes cooperate to shape the inflamed tumor microenvironment in aggressive pancreatic adenocarcinoma

Cindy Neuzillet et al. J Pathol. 2022 Dec.

Abstract

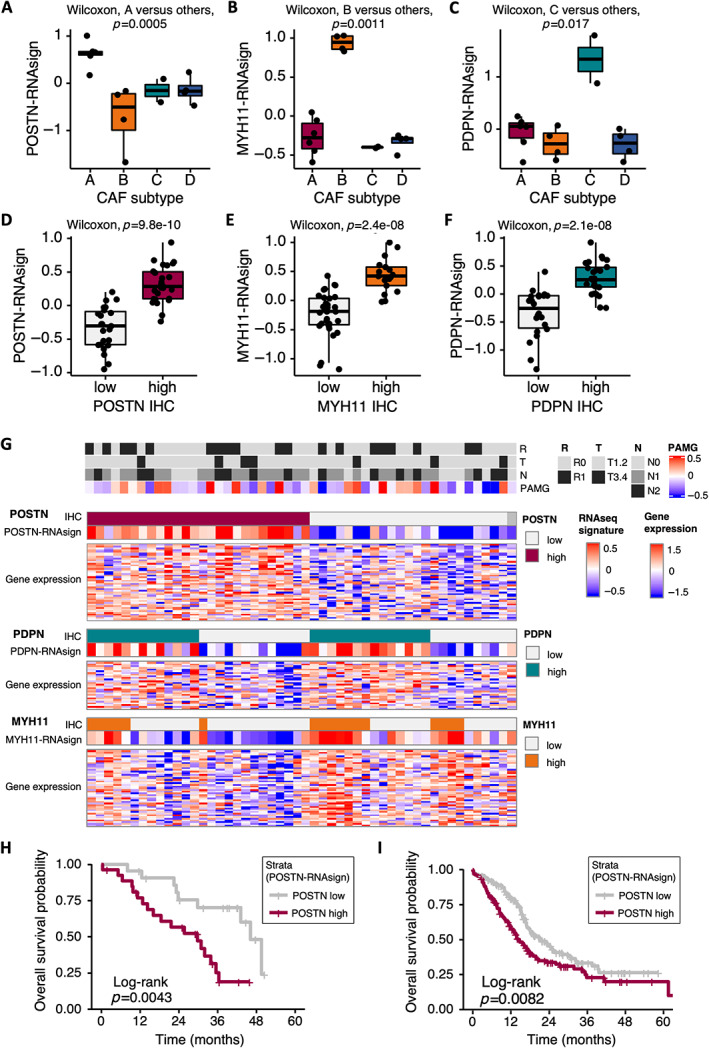
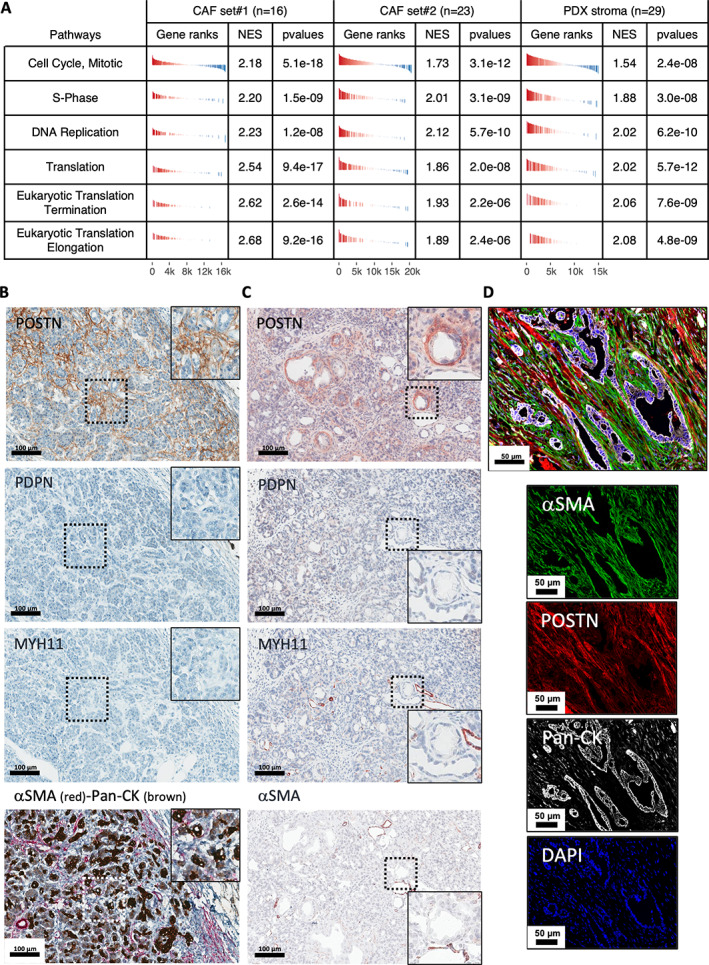
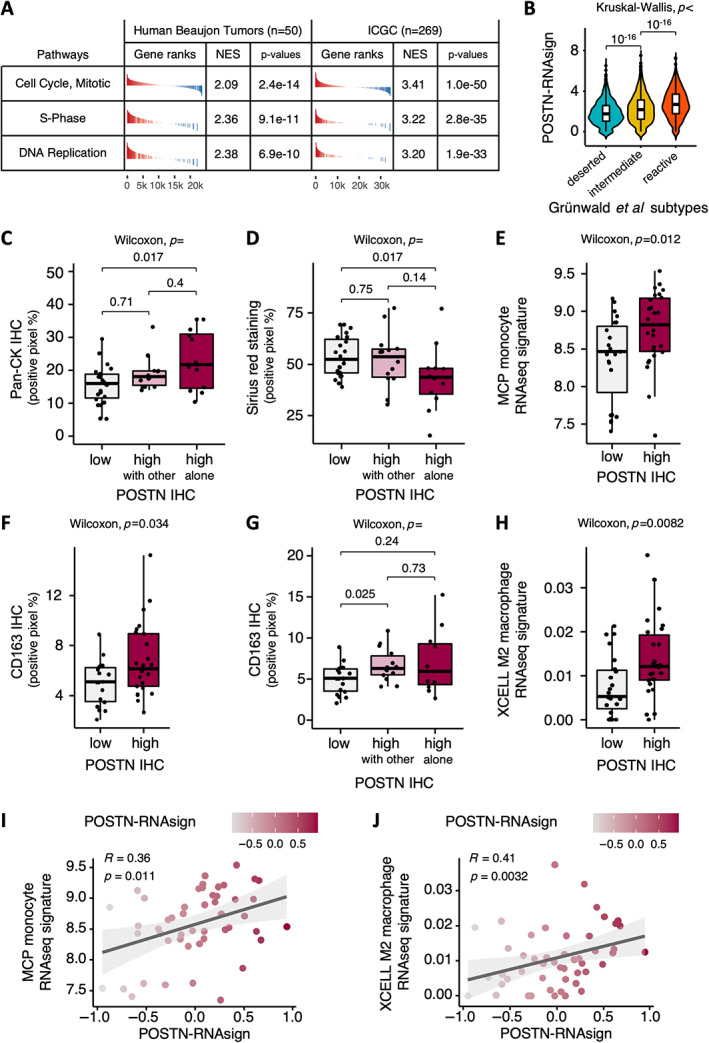
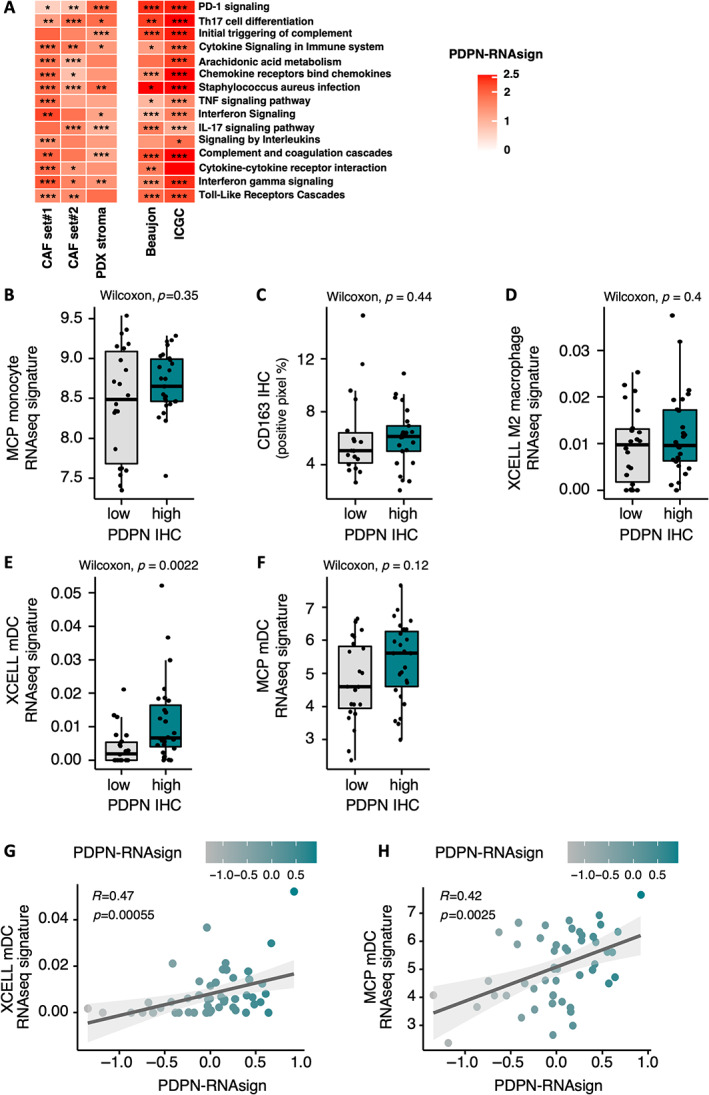
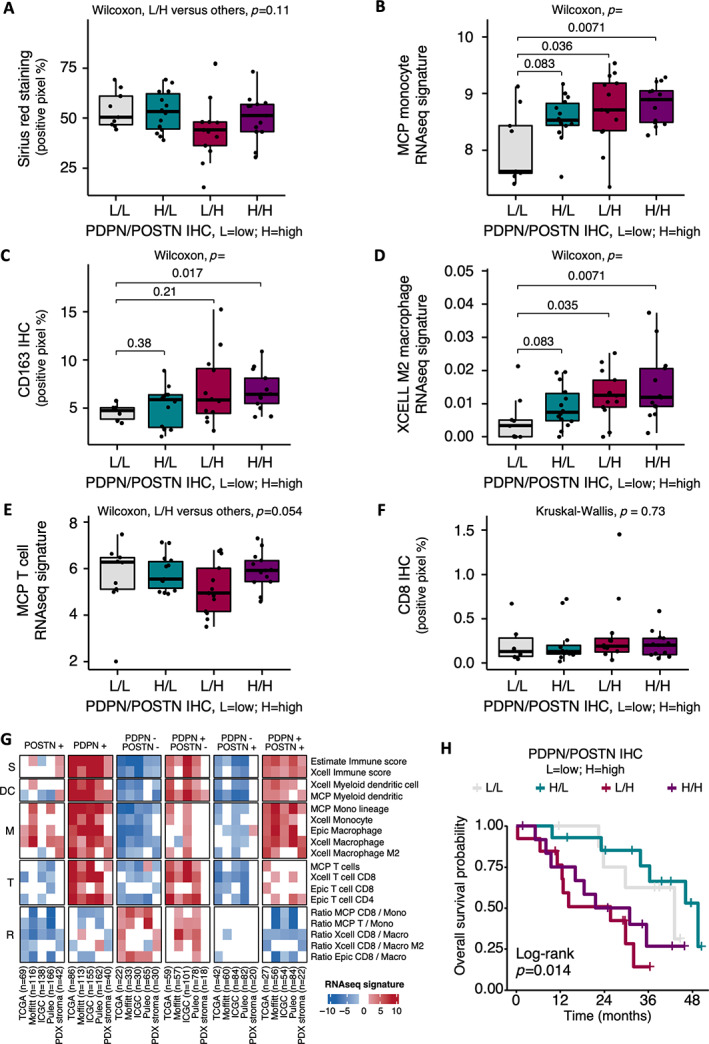
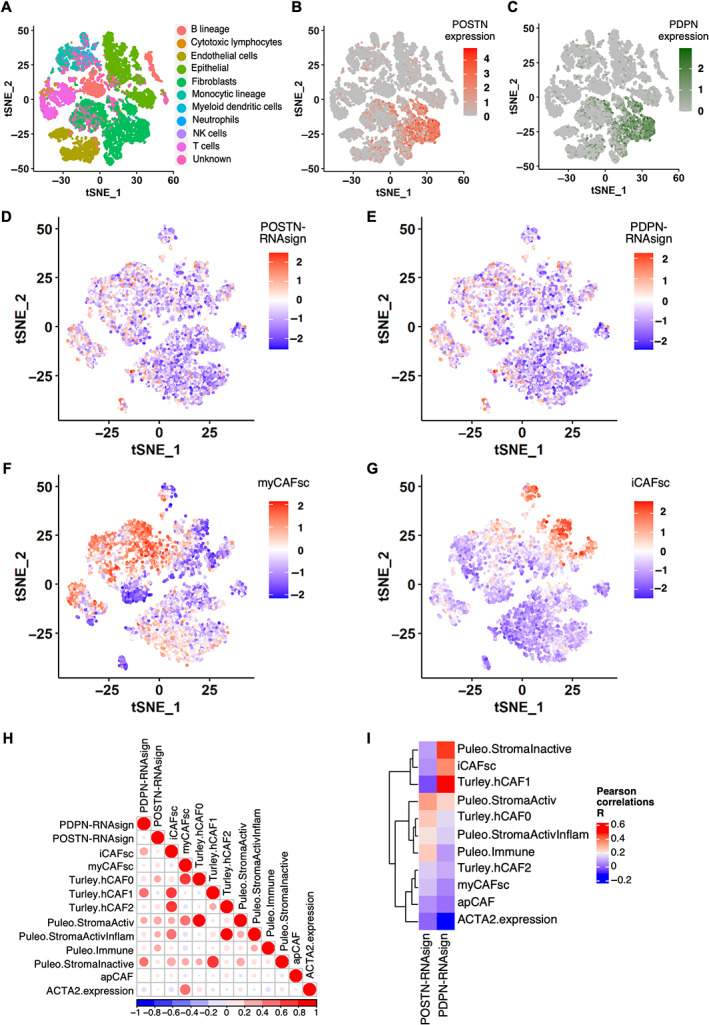
Cancer-associated fibroblasts (CAFs) are orchestrators of the pancreatic ductal adenocarcinoma (PDAC) microenvironment. Previously we described four CAF subtypes with specific molecular and functional features. Here, we have refined our CAF subtype signatures using RNAseq and immunostaining with the goal of defining bioinformatically the phenotypic stromal and tumor epithelial states associated with CAF diversity. We used primary CAF cultures grown from patient PDAC tumors, human data sets (in-house and public, including single-cell analyses), genetically engineered mouse PDAC tissues, and patient-derived xenografts (PDX) grown in mice. We found that CAF subtype RNAseq signatures correlated with immunostaining. Tumors rich in periostin-positive CAFs were significantly associated with shorter overall survival of patients. Periostin-positive CAFs were characterized by high proliferation and protein synthesis rates and low α-smooth muscle actin expression and were found in peri-/pre-tumoral areas. They were associated with highly cellular tumors and with macrophage infiltrates. Podoplanin-positive CAFs were associated with immune-related signatures and recruitment of dendritic cells. Importantly, we showed that the combination of periostin-positive CAFs and podoplanin-positive CAFs was associated with specific tumor microenvironment features in terms of stromal abundance and immune cell infiltrates. Podoplanin-positive CAFs identified an inflammatory CAF (iCAF)-like subset, whereas periostin-positive CAFs were not correlated with the published myofibroblastic CAF (myCAF)/iCAF classification. Taken together, these results suggest that a periostin-positive CAF is an early, activated CAF, associated with aggressive tumors, whereas a podoplanin-positive CAF is associated with an immune-related phenotype. These two subpopulations cooperate to define specific tumor microenvironment and patient prognosis and are of putative interest for future therapeutic stratification of patients. © 2022 The Authors. The Journal of Pathology published by John Wiley & Sons Ltd on behalf of The Pathological Society of Great Britain and Ireland.

Keywords: RNAseq; dendritic cell; heterogeneity; immune cells; immunohistochemistry; macrophage; prognosis; stroma; transcriptomic classification.


Figures

Figure 1
Figure 1
Pancreatic ductal adenocarcinoma (PDAC) cancer‐associated fibroblast (CAF) RNAseq signatures. (A) Periostin (POSTN) multigene RNAseq signature (POSTN‐RNAsign) expression level according to CAF subtypes (A–D, pCAFassigner) in primary CAF cultures (Set 1 [10], n = 16). Subtype A is displayed in red, B in orange, C in green, and D in blue. (B) Myosin‐11 (MYH11) multigene RNAseq signature (MYH11‐RNAsign) expression level according to CAF subtypes (A–D, pCAFassigner) in primary CAF cultures (Set 1, n = 16). (C) Podoplanin (PDPN) multigene RNAseq signature (PDPN‐RNAsign) expression level according to CAF subtypes (A–D, pCAFassigner) in primary CAF cultures (Set 1, n = 16). (D) POSTN‐RNAsign expression level according to POSTN protein expression assessed by immunohistochemistry (IHC) (high in red versus low in gray) in resected human PDAC samples (Beaujon cohort, n = 50). (E) MYH11‐RNAsign expression level according to MYH11 protein expression assessed by IHC (high in orange versus low in gray) in resected human PDAC samples (Beaujon cohort, n = 50). (F) PDPN‐RNAsign expression level according to PDPN protein expression assessed by IHC (high in green versus low in gray) in resected human PDAC samples (Beaujon cohort, n = 50). (G) Heatmap showing POSTN, PDPN, and MYH11 protein expression by IHC (high versus low), multigene RNAseq signatures and gene expression, and association with tumor prognostic features, in individual patients from Beaujon cohort (n = 50). Each column represents one patient. POSTN‐high expression by IHC is displayed in red, PDPN‐high expression in green, and MYH11‐high expression in orange, with low expressions in light gray. For gene expression and signatures, higher expression is shown in red and lower expression in blue. Tumor features are displayed in the upper part of the figure: R: resection margin status (R0, no microscopic invasion, in gray and R1, presence of microscopic invasion, in black), T: TNM T‐stage (tumor) (T1‐2 in gray and T3‐4 in black), N: TNM N‐stage (lymph nodes) (N0 in gray, 1 in dark gray, N2 in black); PAMG, pancreatic adenocarcinoma molecular gradient [37] (more classical in blue, more basal‐like in red); NA, not assessable. (H) Kaplan–Meier curves for overall survival (OS) in Beaujon cohort (n = 49), according to POSTN‐RNAsign expression (high in red versus low in gray). (I) Kaplan–Meier curves for OS in International Cancer Genome Consortium (ICGC) data set (n = 267), according to POSTN‐RNAsign expression (high in red versus low in gray).
Figure 2
Figure 2
Characterization of periostin‐positive (POSTN‐positive) cancer‐associated fibroblasts (CAFs) in vitro and ex vivo. (A) Gene set enrichment analysis (GSEA) from RNAseq data of primary CAF cultures (Set 1, n = 16 and Set 2, n = 23) and patient‐derived xenograft (PDX) stroma (murine genes, n = 29) for tumors rich in POSTN‐positive CAFs versus others (according to POSTN‐RNAsign expression). (B) Immunohistochemical (IHC) staining for periostin (POSTN, in brown), podoplanin (PDPN, in brown), myosin‐11 (MYH11, in brown), and costaining for α‐smooth muscle actin (αSMA, in red) and pan‐cytokeratin (Pan‐CK, in brown) on serial sections in adjacent tissue of human tumor from a resected pancreatic ductal adenocarcinoma (PDAC) sample. High magnification (box) highlights a peritumoral pancreatitis area. Low magnification: scale bar: 100 μm. Positive internal control MYH11: muscle cells in artery wall; PDPN nerves. (C) IHC stainings for POSTN, PDPN, MYH11, and αSMA (in brown) on serial sections of preneoplastic area from a KPC mouse. Low magnification: scale bar: 100 μm. High magnification (box) highlights an acinar‐to‐ductal metaplasia (ADM) lesion. (D) Multiplex immunofluorescence (IF) costaining of αSMA (green), POSTN (red), Pan‐CK (white), and DAPI (blue) from resected human PDAC sample. Merged picture (upper panel) and individual stainings (lower panels). Scale bar: 50 μm.
Figure 3
Figure 3
Characterization of tumors rich in periostin‐positive (POSTN‐positive) cancer‐associated fibroblasts (CAFs). (A) Gene set enrichment analysis (GSEA) from RNAseq data of bulk human tumors from Beaujon cohort (n = 50) and International Cancer Genome Consortium (ICGC) data set (n = 269), for tumors rich in POSTN‐positive CAFs versus others (according to POSTN‐RNAsign expression). (B) Expression of POSTN‐RNAsign according to ‘reactive’, ‘intermediate’, or ‘deserted’ subtumor microenvironment areas from Grünwald et al [14] data set. (C) Quantification of immunohistochemical (IHC) staining for pan‐cytokeratin (Pan‐CK, percentage of positive pixels) according to POSTN protein expression (POSTN‐low in gray, POSTN‐high with MYH11, or PDPN coexpression in pink, and POSTN‐high without MYH11/PDPN coexpression in red) assessed by IHC in resected human pancreatic ductal adenocarcinoma (PDAC) samples (Beaujon cohort, n = 50). (D) Quantification of Picro‐Sirius Red (‘Sirius red’) stained area (percentage of positive pixels) according to POSTN protein expression (POSTN‐low in gray, POSTN‐high with MYH11, or PDPN coexpression in pink, and POSTN‐high without MYH11/PDPN coexpression in red) assessed by IHC in resected human PDAC samples (Beaujon cohort, n = 50). (E) Quantification of microenvironment cell populations (MCP) monocyte RNAseq signature expression level according to POSTN protein expression (high in red versus low in gray) assessed by IHC in resected human PDAC samples (Beaujon cohort, n = 50). (F) Quantification of IHC staining for CD163 (percentage of positive pixels) according to POSTN protein expression (high in red versus low in gray) assessed by IHC in resected human PDAC samples (Beaujon cohort, n = 50). (G) Quantification of IHC staining for CD163 (percentage of positive pixels) according to POSTN protein expression (POSTN‐low in gray, POSTN‐high with MYH11 and/or PDPN coexpression in pink, and POSTN‐high without MYH11/PDPN coexpression in red) assessed by IHC in resected human PDAC samples (Beaujon cohort, n = 50). (H) Quantification of XCELL M2 macrophage RNAseq signature expression level according to POSTN protein expression (high in red versus low in gray) assessed by IHC in resected human PDAC samples (Beaujon cohort, n = 50). (I) Correlation between POSTN multigene RNAseq signature (POSTN‐RNAsign) expression and MCP monocyte RNAseq signature expression in resected human PDAC samples (Beaujon cohort, n = 50). (J) Correlation between POSTN multigene RNAseq signature (POSTN‐RNAsign) expression and XCELL M2 macrophage RNAseq signature expression in resected human PDAC samples (Beaujon cohort, n = 50).
Figure 4
Figure 4
Characterization of tumors rich in podoplanin‐positive (PDPN‐positive) cancer‐associated fibroblasts (CAFs). (A) Gene set enrichment analysis (GSEA) from RNAseq data of primary CAF cultures (Set 1, n = 16, and Set 2, n = 23), patient‐derived xenograft (PDX) stroma (mouse genes, n = 29), and bulk human tumor samples from Beaujon cohort (n = 50), and International Cancer Genome Consortium (ICGC) data set (n = 267), for tumors rich in PDPN‐positive CAFs versus others. (B) Quantification of microenvironment cell populations (MCP) monocyte RNAseq signature expression level according to podoplanin (PDPN) protein expression (high in green versus low in gray) assessed by IHC in resected human pancreatic ductal adenocarcinoma (PDAC) samples (Beaujon cohort, n = 50). (C) Quantification of IHC staining for CD163 (percentage of positive pixels) according to PDPN protein expression (high in green versus low in gray) assessed by IHC in resected human PDAC samples (Beaujon cohort, n = 50). (D) Quantification of XCELL M2 macrophage RNAseq signature expression level according to PDPN protein expression (high in green versus low in gray) assessed by IHC in resected human PDAC samples (Beaujon cohort, n = 50). (E) Quantification of XCELL mDC (dendritic cells) RNAseq signature expression level according to PDPN protein expression (high in green versus low in gray) assessed by IHC in resected human PDAC samples (Beaujon cohort, n = 50). (F) Quantification of MCP mDC RNAseq signature expression level according to PDPN protein expression (high in green versus low in gray) assessed by IHC in resected human PDAC samples (Beaujon cohort, n = 50). (G) Correlation between PDPN multigene RNAseq signature (PDPN‐RNAsign) expression and XCELL mDC RNAseq signature expression in resected human PDAC samples (Beaujon cohort, n = 50). (H) Correlation between PDPN multigene RNAseq signature (PDPN‐RNAsign) expression and MCP mDC RNAseq signature expression in resected human PDAC samples (Beaujon cohort, n = 50).
Figure 5
Figure 5
Combination of periostin (POSTN)‐ and podoplanin (PDPN)‐positive cancer‐associated fibroblasts (CAFs). (A) Quantification of Picro‐Sirius Red (‘Sirius red’) stained area (percentage of positive pixels) according to POSTN and PDPN combined protein expressions assessed by immunohistochemistry (IHC) in resected human PDAC samples (Beaujon cohort, n = 50). Low PDPN/low POSTN tumors are displayed in gray, high PDPN/low POSTN in green, low PDPN/high POSTN in red, high PDPN/high POST in purple. (B) Quantification of microenvironment cell populations (MCP) monocyte RNAseq signature expression level according to POSTN and PDPN combined protein expressions assessed by IHC in resected human PDAC samples (Beaujon cohort, n = 50). (C) Quantification of IHC staining for CD163 (percentage of positive pixels) according to POSTN and PDPN combined protein expressions assessed by IHC in resected human PDAC samples (Beaujon cohort, n = 50). (D) Quantification of XCELL M2 macrophage RNAseq signature expression level according to POSTN and PDPN combined protein expressions assessed by IHC in resected human PDAC samples (Beaujon cohort, n = 50). (E) Quantification of MCP T cell RNAseq signature expression level according to POSTN and PDPN combined protein expressions assessed by IHC in resected human PDAC samples (Beaujon cohort, n = 50). (F) Quantification of IHC staining for CD8 (percentage of positive pixels) according to POSTN and PDPN combined protein expressions assessed by IHC in resected human PDAC samples (Beaujon cohort, n = 50). (G) Heatmap summarizing quantification of immune cell RNAseq signatures according to POSTN and PDPN multigene RNAseq signatures in five different data sets (TCGA, Moffitt, ICGC, Puleo, PDX). Higher expression is shown in red and lower expression in blue. (H) Kaplan–Meier curves for overall survival in Beaujon cohort (n = 49), according to combined POSTN and PDPN expression by IHC.
Figure 6
Figure 6
Single‐cell RNA sequencing cross‐analyses with published cancer‐associated fibroblast (CAF) classifications. (A) Plot of different cell types onto t‐distributed stochastic neighbor embedding (t‐SNE) map from single‐cell RNA sequencing. Fibroblasts are highlighted in green. (B) Plot of expression levels of periostin (POSTN) in each analyzed cell (all cell types) onto t‐SNE map. Color key from gray to red indicates relative expression levels from low to high. (C) Plot of expression levels of podoplanin (PDPN) in each analyzed cell (all cell types) onto t‐SNE map. Color key from gray to green indicates relative expression levels from low to high. (D) Plot of POSTN multigene RNAseq signature (POSTN‐RNAsign) expression level in each analyzed cell (fibroblasts only). Higher expression is shown in red and lower expression in blue. (E) Plot of PDPN multigene RNAseq signature (PDPN‐RNAsign) expression level in each analyzed cell (fibroblasts only). Higher expression is shown in red and lower expression in blue. (F) Plot of myofibroblastic CAF (myCAF) (Tuveson's group [12]) RNAseq signature expression level in each analyzed cell (fibroblasts only). Higher expression is shown in red and lower expression in blue. (G) Plot of inflammatory CAF (iCAF) (Tuveson's group [12]) RNAseq signature expression level in each analyzed cell (fibroblasts only). Higher expression is shown in red and lower expression in blue. (H) Pearson's R correlation between each published transcriptomic signatures score assessed by GSVA or ACTA2 expression in the fibroblast subgroup. Positive correlation is shown in red and negative correlation in blue. (I) Pearson's R correlation between POSTN‐RNAsign or PDPN‐RNAsign and published transcriptomic signatures and ACTA2 expression. Positive correlation is shown in red and negative correlation in blue.

References

    1. Rahib L, Wehner MR, Matrisian LM, et al. Estimated projection of US cancer incidence and death to 2040. JAMA Netw Open 2021; 4: e214708. - PMC - PubMed
    1. Arnold M, Rutherford MJ, Bardot A, et al. Progress in cancer survival, mortality, and incidence in seven high‐income countries 1995‐2014 (ICBP SURVMARK‐2): a population‐based study. Lancet Oncol 2019; 20: 1493–1505. - PMC - PubMed
    1. Neesse A, Bauer CA, Öhlund D, et al. Stromal biology and therapy in pancreatic cancer: ready for clinical translation? Gut 2019; 68: 159–171. - PubMed
    1. Ene‐Obong A, Clear AJ, Watt J, et al. Activated pancreatic stellate cells sequester CD8+ T cells to reduce their infiltration of the juxtatumoral compartment of pancreatic ductal adenocarcinoma. Gastroenterology 2013; 145: 1121–1132. - PMC - PubMed
    1. Hilmi M, Bartholin L, Neuzillet C. Immune therapies in pancreatic ductal adenocarcinoma: where are we now? World J Gastroenterol 2018; 24: 2137–2151. - PMC - PubMed

Publication types