. 2022 Sep;130(9):97003.
doi: 10.1289/EHP10923. Epub 2022 Sep 14.

Prolonged, Low-Level Exposure to the Marine Toxin, Domoic Acid, and Measures of Neurotoxicity in Nonhuman Primates

Affiliations

Prolonged, Low-Level Exposure to the Marine Toxin, Domoic Acid, and Measures of Neurotoxicity in Nonhuman Primates

Rebekah L Petroff et al. Environ Health Perspect. 2022 Sep.

Abstract

Background: The excitotoxic molecule, domoic acid (DA), is a marine algal toxin known to induce overt hippocampal neurotoxicity. Recent experimental and epidemiological studies suggest adverse neurological effects at exposure levels near the current regulatory limit (20 ppm, 0.075-0.1mg/kg). At these levels, cognitive effects occur in the absence of acute symptoms or evidence of neuronal death.

Objectives: This study aimed to identify adverse effects on the nervous system from prolonged, dietary DA exposure in adult, female Macaca fascicularis monkeys.

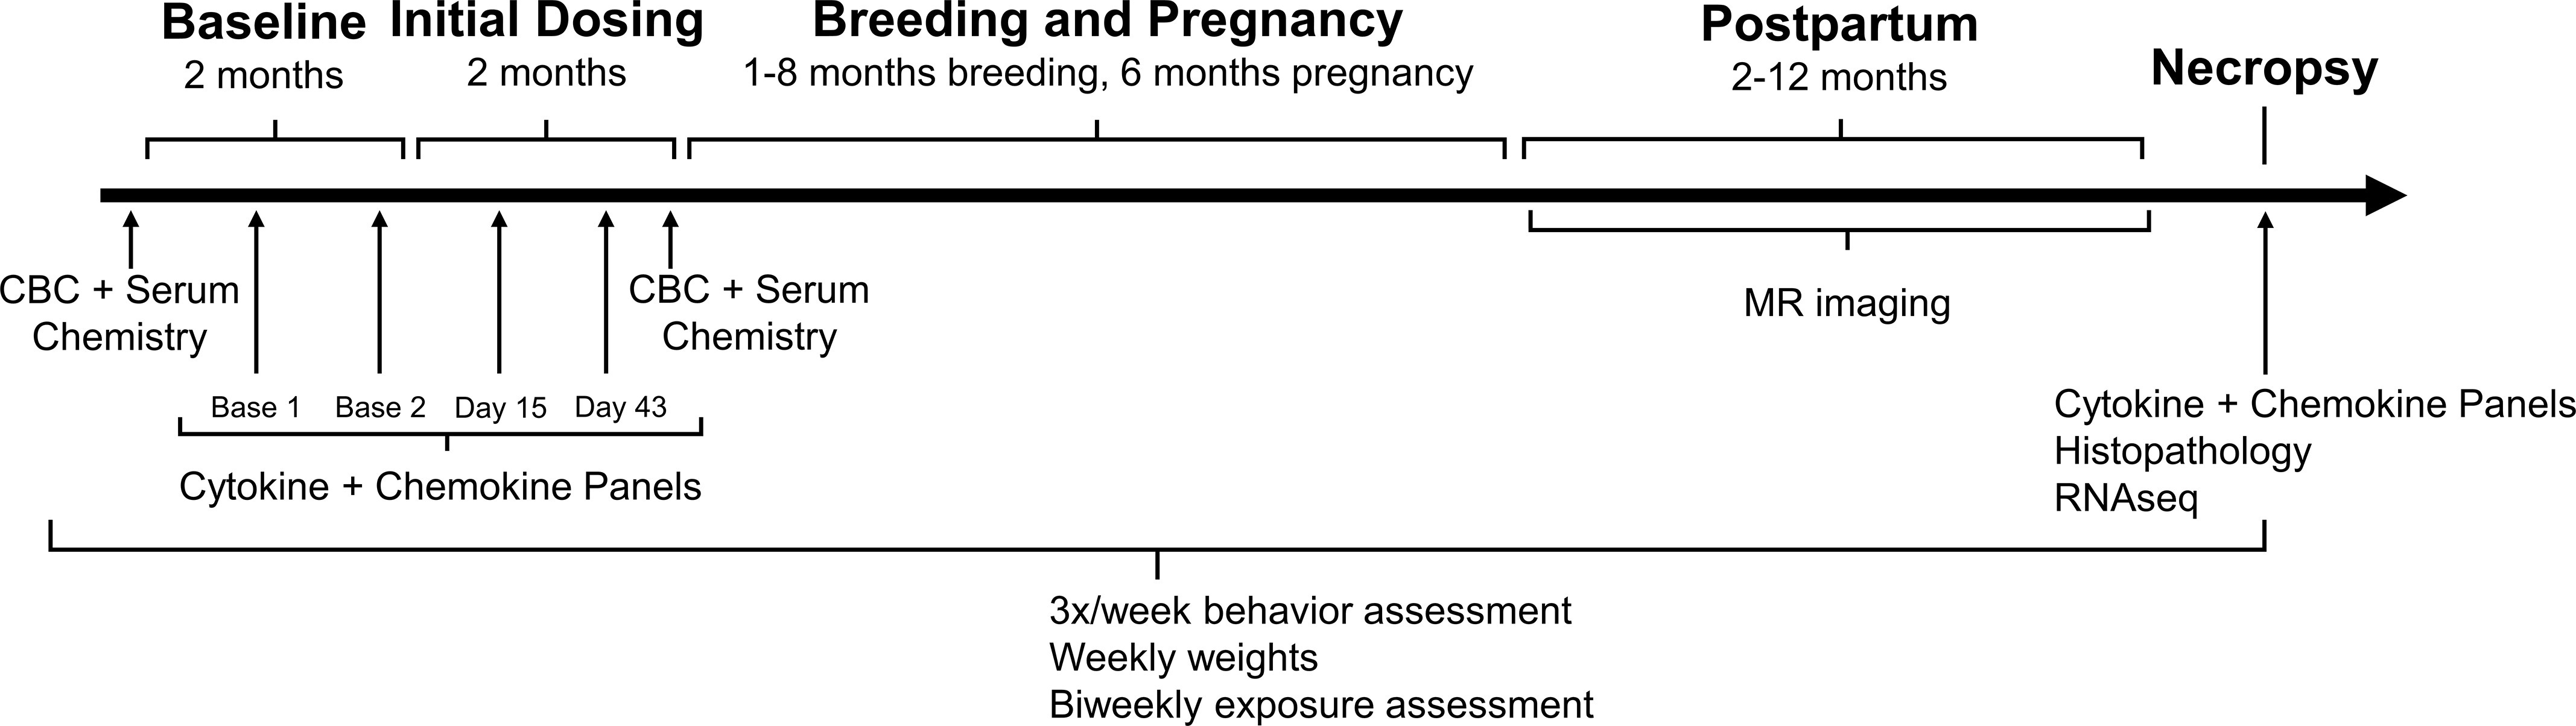
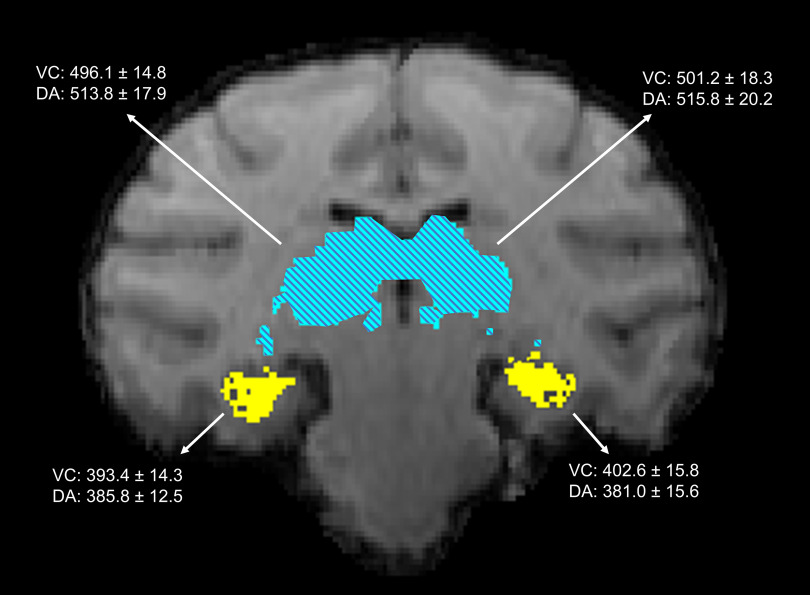
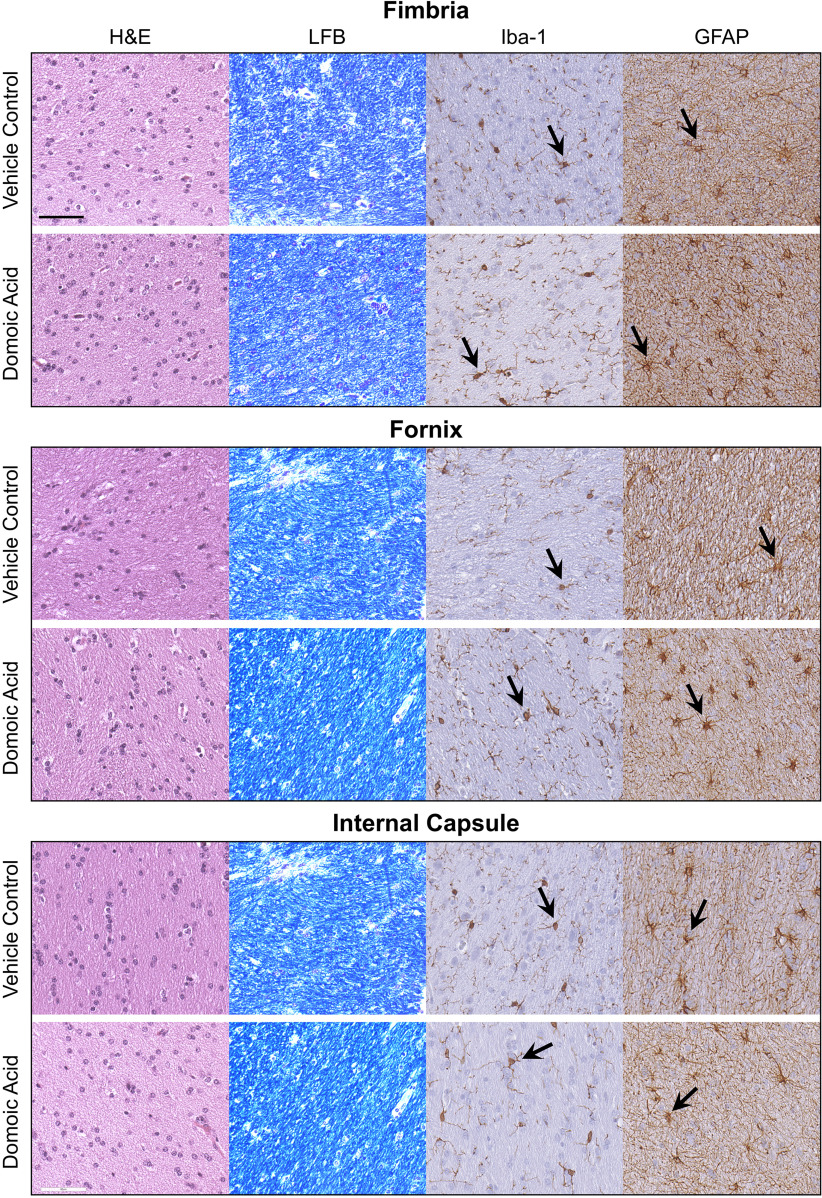
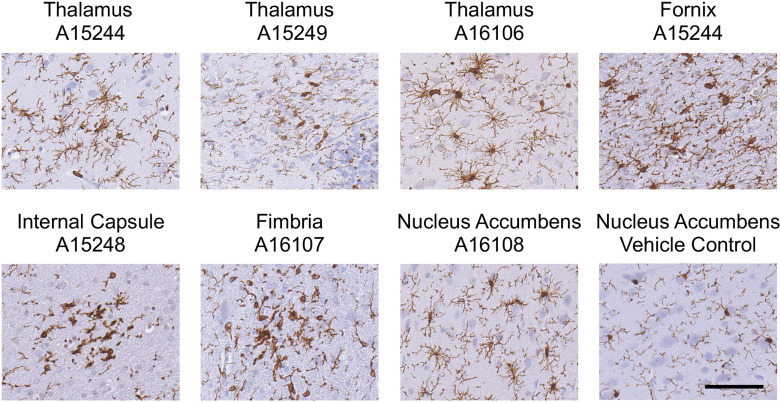
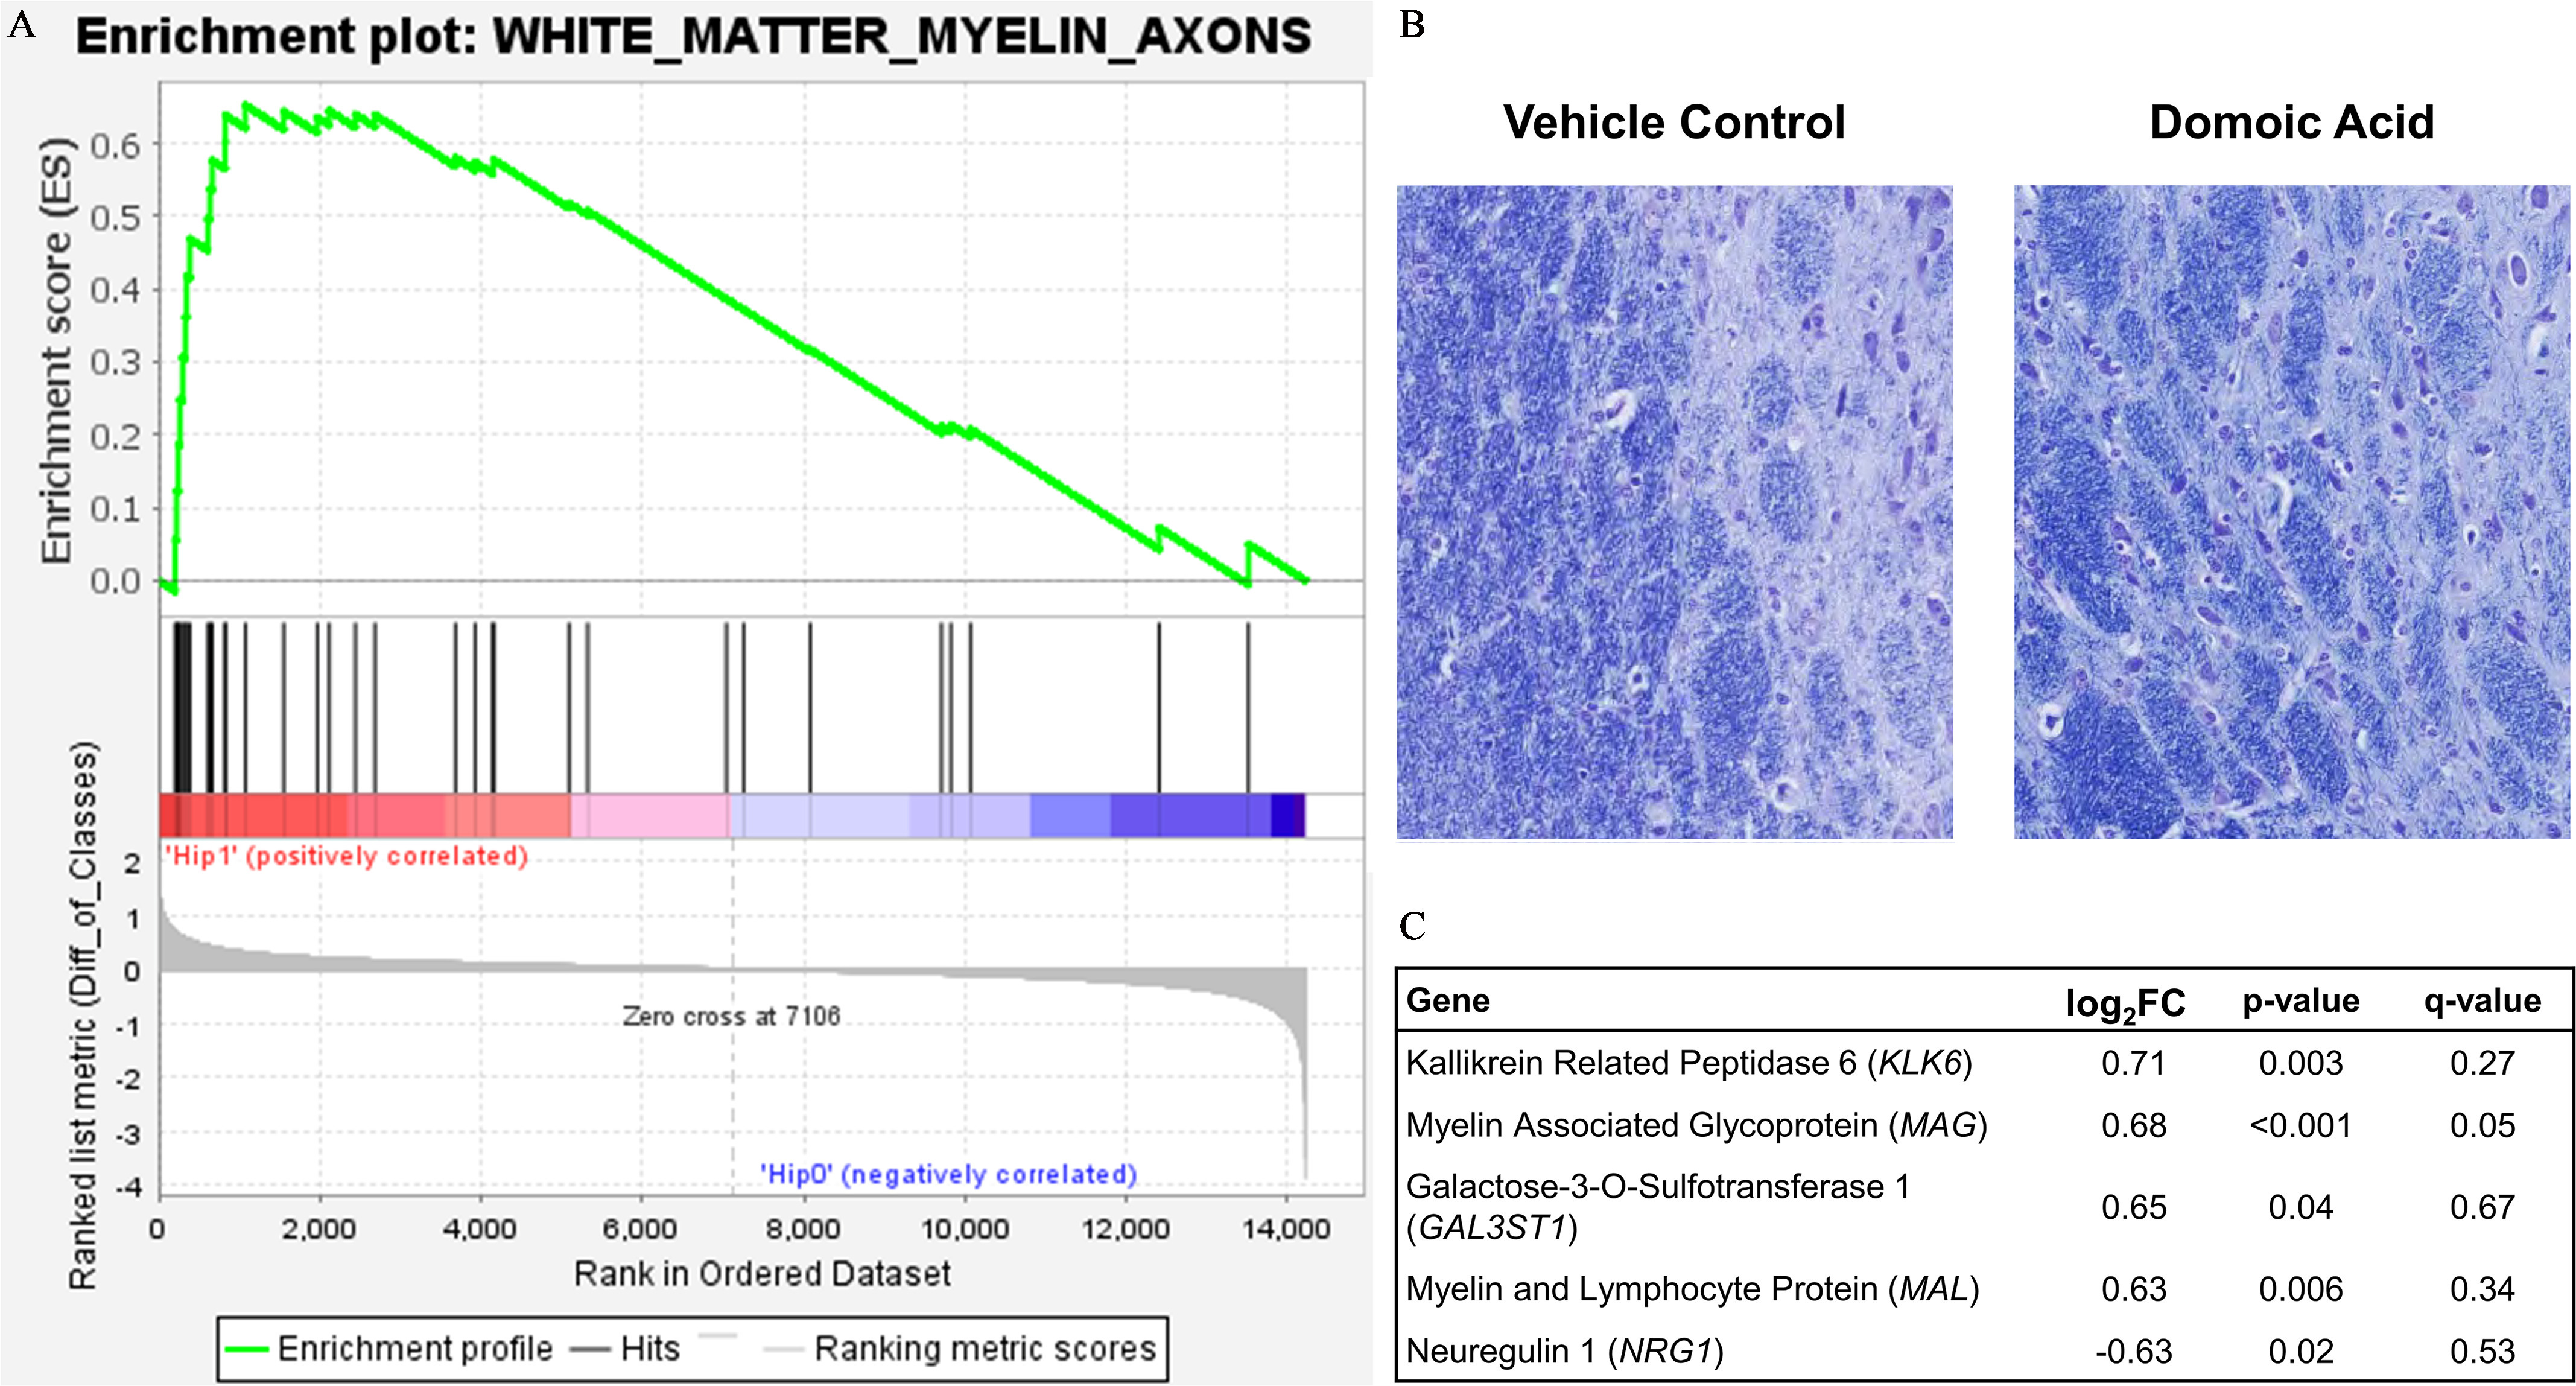
Methods: Monkeys were orally exposed to 0, 0.075, and 0.15mg/kg per day for an average of 14 months. Clinical blood counts, chemistry, and cytokine levels were analyzed in the blood. In-life magnetic resonance (MR) imaging assessed volumetric and tractography differences in and between the hippocampus and thalamus. Histology of neurons and glia in the fornix, fimbria, internal capsule, thalamus, and hippocampus was evaluated. Hippocampal RNA sequencing was used to identify differentially expressed genes. Enrichment of gene networks for neuronal health, excitotoxicity, inflammation/glia, and myelin were assessed with Gene Set Enrichment Analysis.

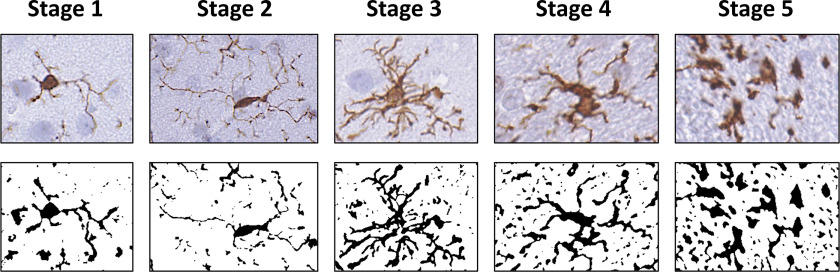
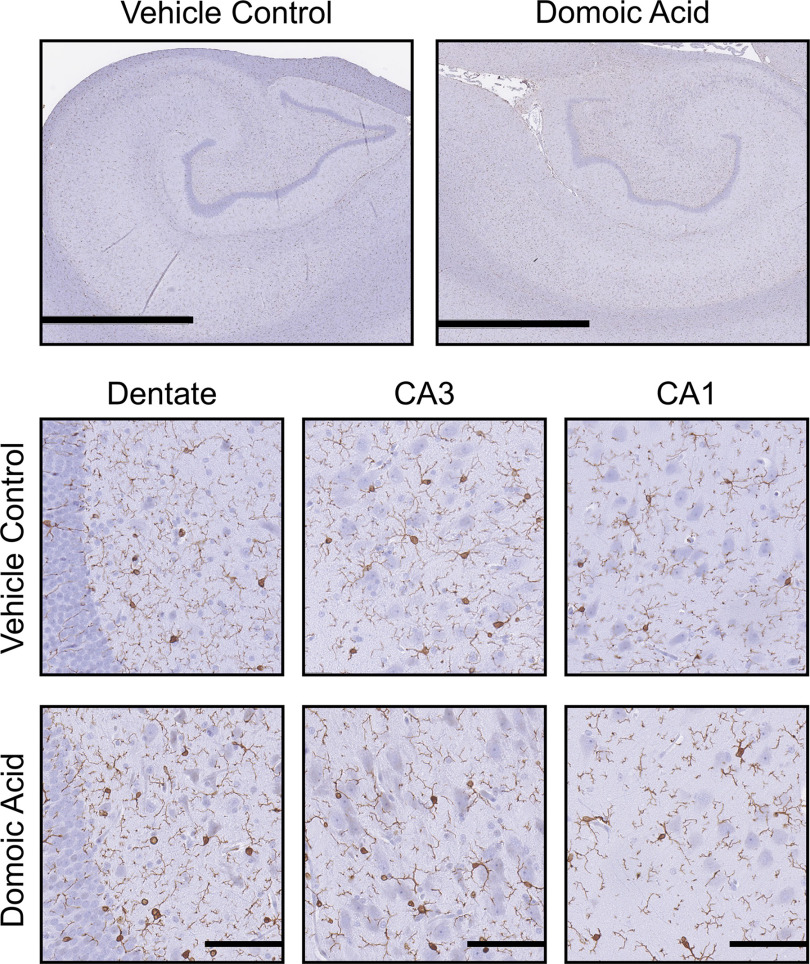
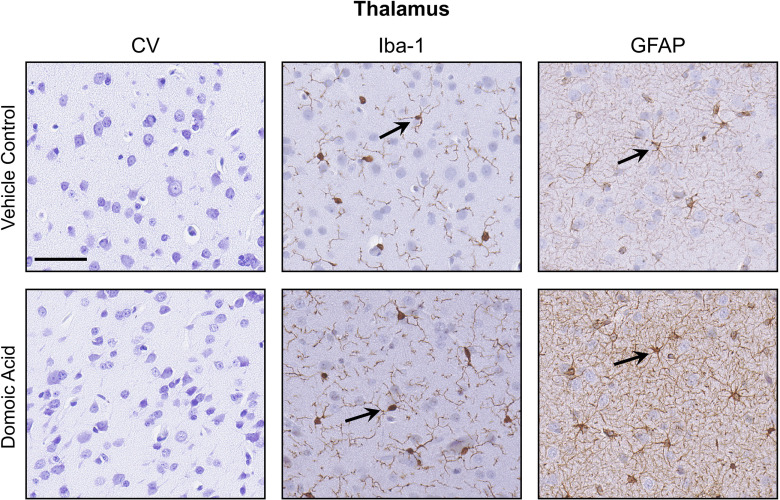
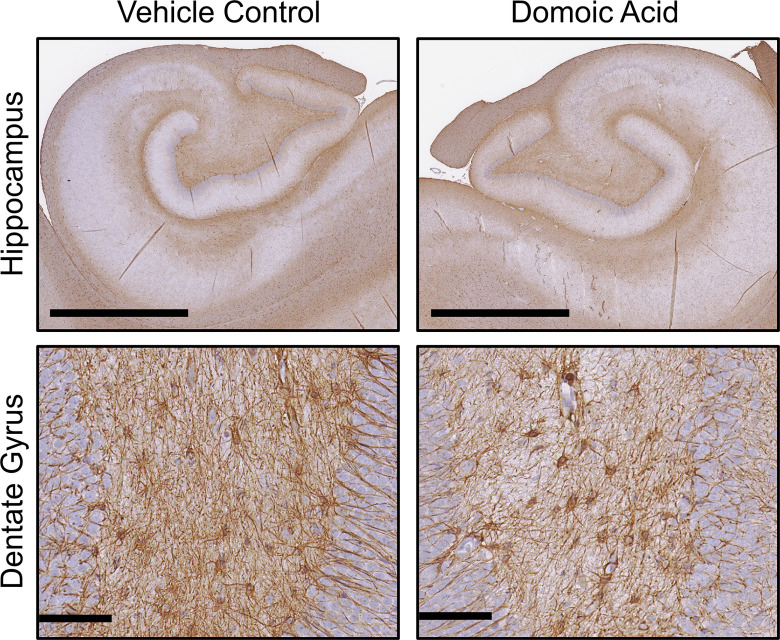
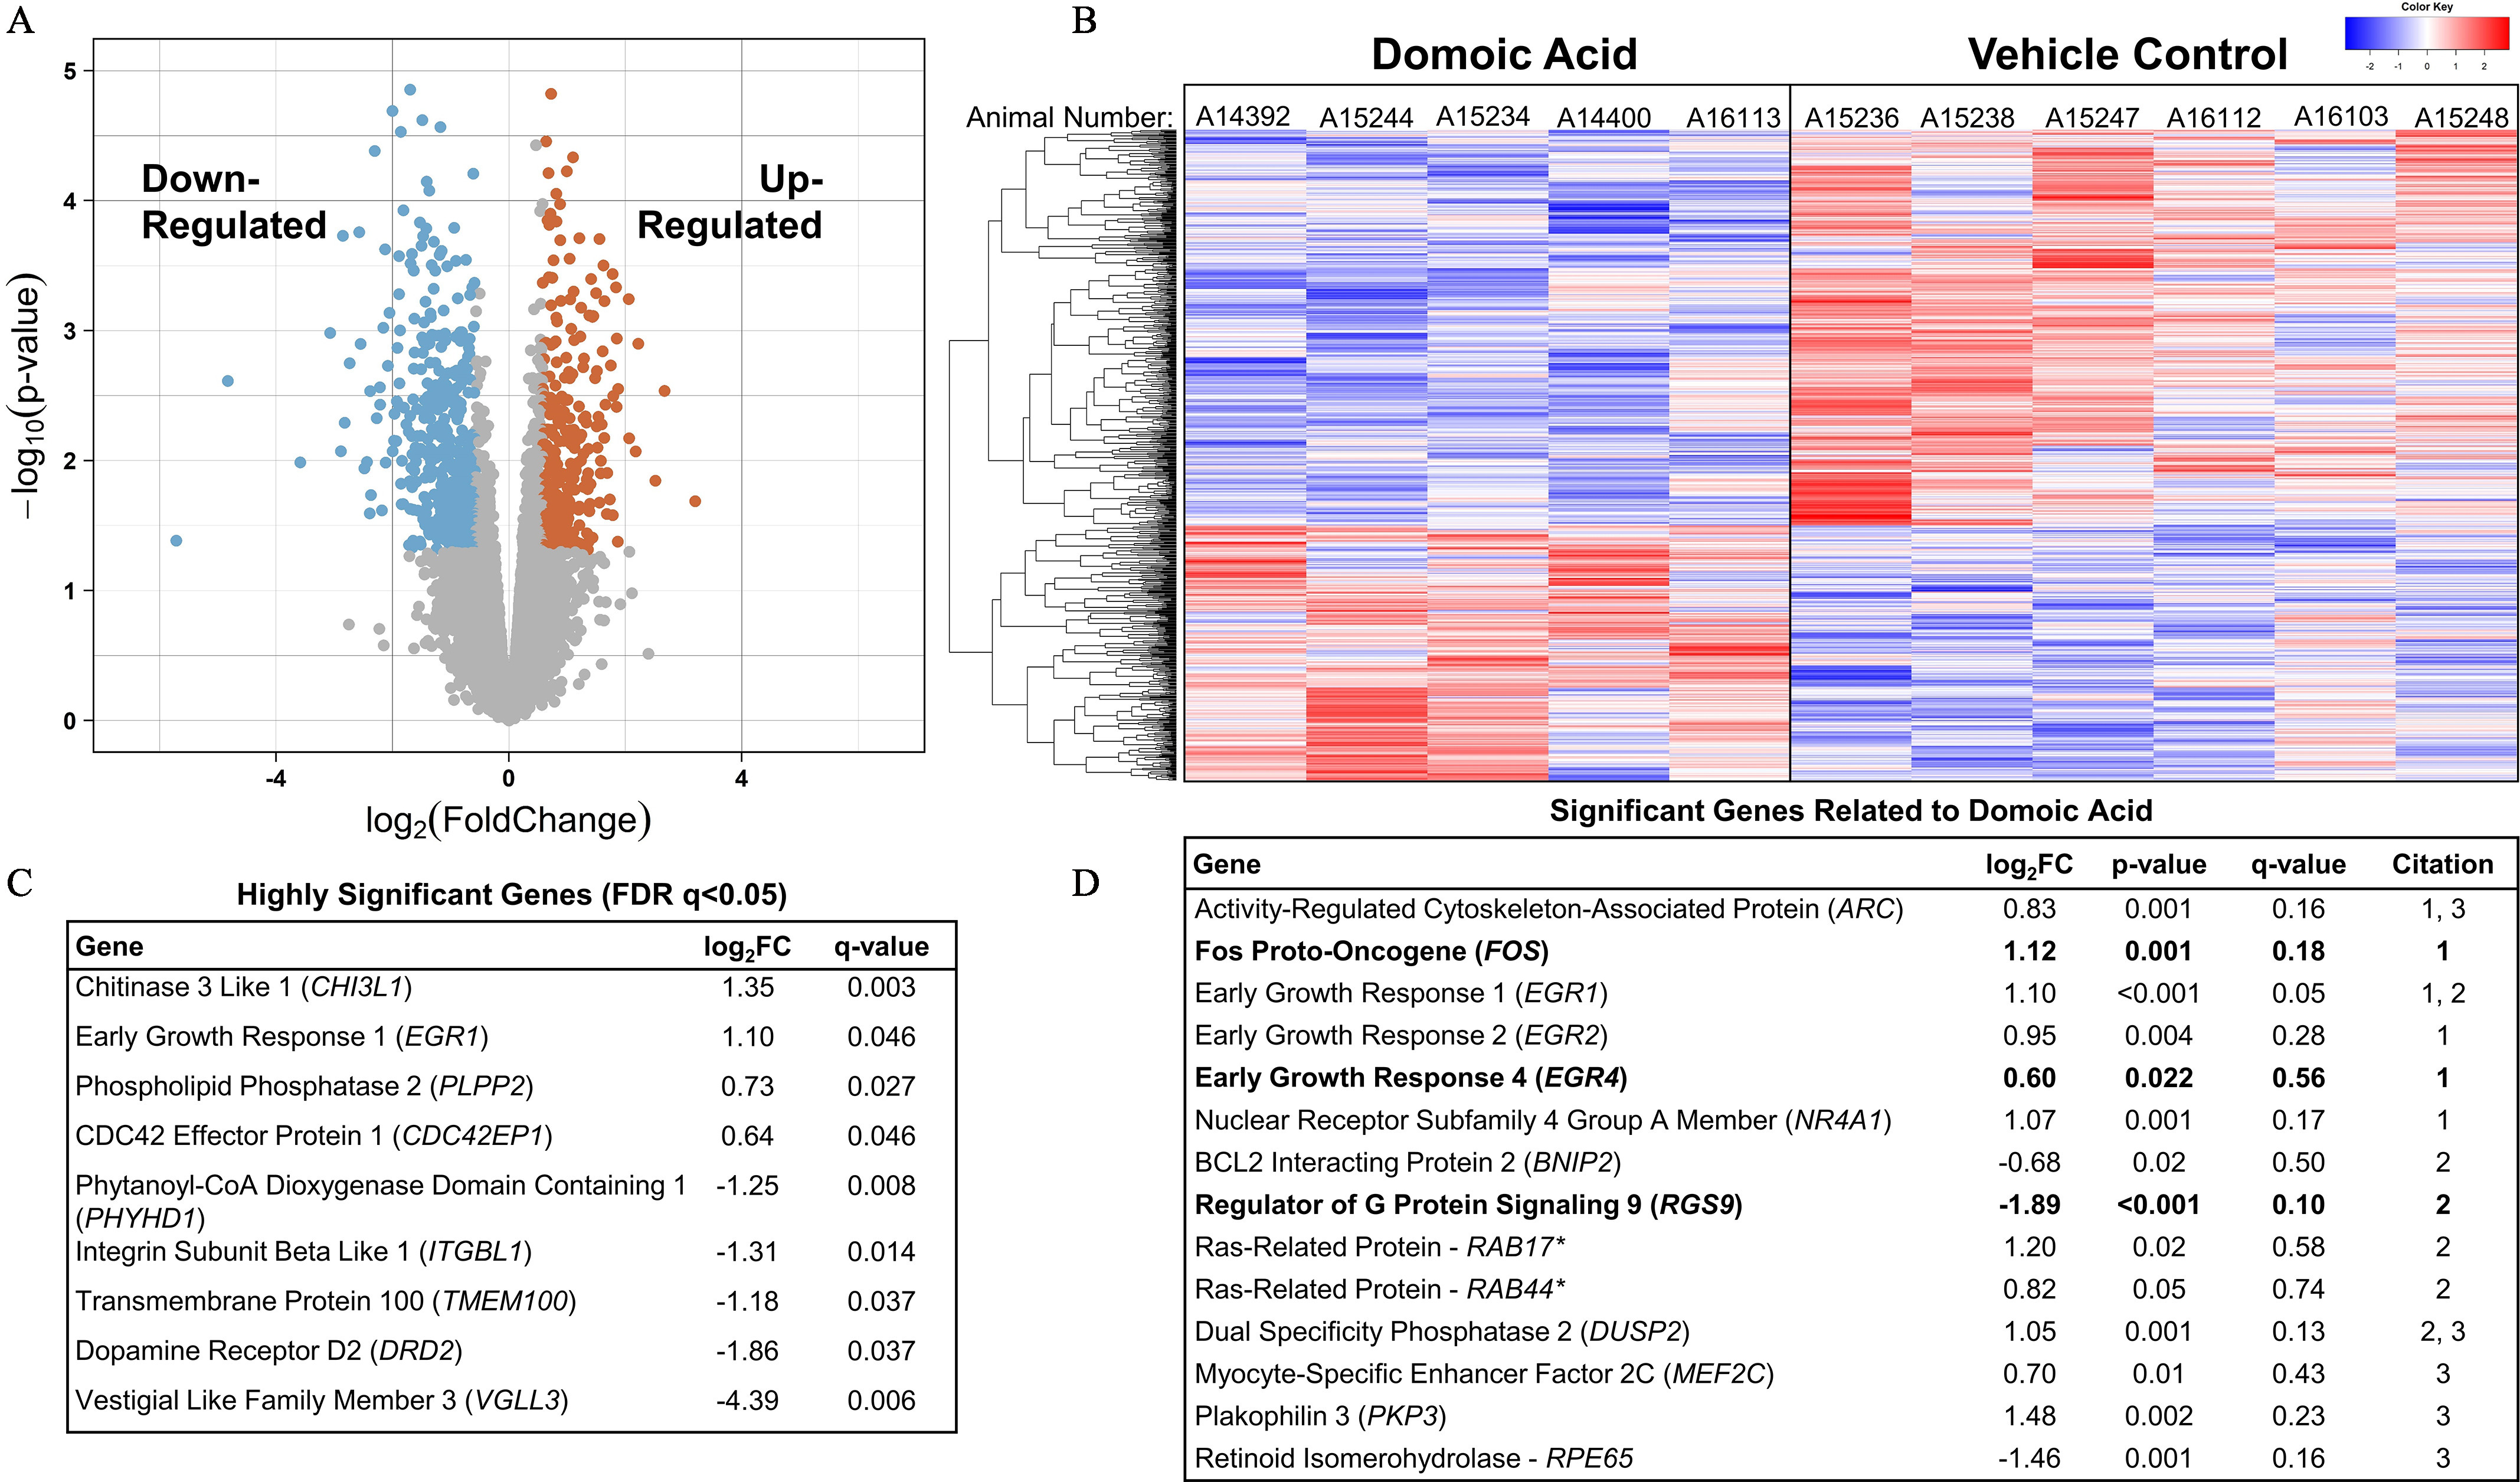
Results: Clinical blood counts, chemistry, and cytokine levels were not altered with DA exposure in nonhuman primates. Transcriptome analysis of the hippocampus yielded 748 differentially expressed genes (fold change1.5; p0.05), reflecting differences in a broad molecular profile of intermediate early genes (e.g., FOS, EGR) and genes related to myelin networks in DA animals. Between exposed and control animals, MR imaging showed comparable connectivity of the hippocampus and thalamus and histology showed no evidence of hypomyelination. Histological examination of the thalamus showed a larger microglia soma size and an extension of cell processes, but suggestions of a GFAP+astrocyte response showed no indication of astrocyte hypertrophy.

Discussion: In the absence of overt hippocampal excitotoxicity, chronic exposure of Macaca fascicularis monkeys to environmentally relevant levels of DA suggested a subtle shift in the molecular profile of the hippocampus and the microglia phenotype in the thalamus that was possibly reflective of an adaptive response due to prolonged DA exposure. https://doi.org/10.1289/EHP10923.


Figures

Figure 1 is a timeline in the form of an arrow pointing toward the right, depicting five stages of study, including Baseline, Initial Dosing, Breeding and Pregnancy, Postpartum, and Necropsy. The blood samples for complete blood counts plus serum chemistry were collected for Baseline and Initial Dosing. The levels of cytokines and chemokines in the blood were analyzed at Baseline and Initial Dosing for an average of 43 days. The breeding was between 1 and 8 months, and the pregnancy, six months. The magnetic resonance imaging was conducted during the Postpartum period. The levels of cytokines and chemokines in the blood were analyzed, and histopathology and ribonucleic acid sequencing were conducted during Necropsy. There was a three times a week behavior assessment, with weekly weights, and a biweekly exposure assessment.
Figure 1.
Timeline of study. Representation of the five stages of the study: Baseline (prior to dosing), Initial Dosing (2 months prior to breeding), Breeding and Pregnancy, Postpartum. Necropsy occurred in the Postpartum period. Daily, oral domoic acid (DA) dosing began in the Initial Dosing period and continued through Breeding and Pregnancy. A subset of animals was continued on daily dosing in the Postpartum period (see Table S1 for details). Blood samples for complete blood counts (CBCs) and serum chemistry were collected at the beginning of study (Baseline) and at the end of the Initial Dosing period (average: day 73). Blood levels of cytokines and chemokines were analyzed twice during Baseline, twice during Initial Dosing (average: day 15, day 43), and at necropsy (average: month 14 or 425 d). Magnetic resonance (MR) imaging was conducted during the Postpartum period. Tissue was collected at necropsy for histological assessment and RNA sequencing (RNAseq). Body weights, behavioral assessments, and DA exposure assessments were collected throughout the entire study.
Figure 2 is a set of ten images, depicting a rating scale from 1 to 5 for ionized calcium binding adaptor protein positive microglia with its related progressive change in morphology.
Figure 2.
Representative rating scale (1–5) for Iba+microglia morphology, as collected across the experimental brain regions examined. Images represent skeletonized Iba-1+microglia and their assigned rating score as it related to the progressive change in morphology. Briefly, stage 1 represents cells that had light cytoplasmic staining and limited branched processes; stage 2 represents cells that showed longer process and more branching; stage 3 represents cells that showed denser staining morphology but maintained long processes; stage 4 represents cells that showed thicker and shortened processes; stage 5 represents ameboid microglia that were almost globose and bore limited short processes. Note: Iba-1, ionized calcium binding adaptor molecule 1.
Figure 3 is a hippocampus and magnetic resonance image, depicting the coronal section in the brain of an animal with the transformed macaque atlas overlayed in the same space.
Figure 3.
Hippocampus and magnetic resonance (MR) image. A representative coronal slice of an animal with the transformed macaque atlas overlayed in the same space. Highlighted regions show the hippocampus (yellow, solid) in the lower portion of the image and the thalamus (blue, hatched) located within the middle of the image. Inserted data represent the mean volume±SEM from vehicle control (VC; n=6) and domoic acid-exposed groups (DA; n=6, 2 from the 0.075-mg/kg BW per day group and 4 from the 0.15-mg/kg BW per day group) for each of the sites, as indicated by arrows. No significant differences were observed across the VC and DA groups, using a two-tailed t-test. Units are in cc. Note: SEM, standard error of the mean.
Figure 4 is a set of three stained tissues titled Fimbria, Fornix, and Internal Capsule, displaying four columns, namely, hematoxylin and eosin, Luxol fast blue, ionized calcium binding adaptor molecule 1, and glial fibrillary acidic protein, and two rows, namely, vehicle control and domoic acid, respectively.
Figure 4.
Representative images of staining of 10% formalin-fixed, paraffin-embedded, 10-μm sections of the fimbria, fornix, and internal capsule for general cellularity by hematoxylin and eosin (H&E); myelin by Luxol fast blue (LFB); microglia by ionized calcium binding adaptor molecule 1 (Iba-1; 1:2,000; Wako Chemicals, see arrow); and astrocytes by glial fibrillary acidic protein (GFAP; 1:7,000, Dakocytomation, see arrow) from female Macaca fascicularis following prolonged exposed to domoic acid (0.15-mg/kg BW per day) or vehicle (5% sucrose). Scale bar:100μm.
Figure 5 is divided into two parts. On the top, two stained tissues are displayed titled Vehicle Control and Domoic Acid, depicting hippocampal ionized calcium binding adaptor molecule 1 immunoreactivity. At the bottom, a stained tissue displays three columns, namely, Dentate, cornu Ammonis 3 and cornu Ammonis 1, and rows, namely, Vehicle Control and Domoic Acid.
Figure 5.
Hippocampal Iba-1 immunoreactivity. Representative images of immunostaining of 10% formalin-fixed, paraffin-embedded, 10-μm sections for Iba-1+ (1:2,000; Wako Chemicals) microglia in the hippocampus of female Macaca fascicularis following prolonged exposed to domoic acid (0.15-mg/kg BW per day) or vehicle (5% sucrose). Images represent the hippocampus (scale bar:2,000μm) and specific hippocampal regions, including the dentate gyrus (scale bars: 200 and 100μm) and the CA3 and CA1 pyramidal cell layers (scale bar:100μm). Immunoreactivity was visualized with Vectastain Elite and shows as darker process-bearing cells within the image. Sections were counterstained with cresyl violet (CV). Note: CA, cornu ammonis area; Iba-1, ionized calcium binding adaptor molecule 1.
Figure 6 is a stained tissue titled Thalamus, displaying three columns, namely, Cresyl violet, Ionized calcium binding adaptor molecule 1 and Glial fibrillary acidic protein, and two rows, namely, Vehicle Control and Domoic Acid.
Figure 6.
Differences in glial morphology in the thalamus. Representative images of staining of 10% formalin-fixed, paraffin-embedded, 10-μm sections of the thalamus for cresyl violet (CV) and immunohistochemistry ionized calcium binding adaptor molecule 1 (Iba-1; 1:2,000; Wako Chemicals) microglia; and glial fibrillary acidic protein (GFAP; 1:7,000, Dakocytomation) astrocytes from female Macaca fascicularis following prolonged exposed to domoic acid (0.15-mg/kg BW per day) or vehicle (5% sucrose). Immunoreactivity was visualized with Vectastain Elite and sections were counterstained with CV. CV staining showed no evidence of differences in the distribution of Nissl substance. Representative immunoreactive cells for Iba-1 or GFAP display as darker stained cells. Scale bar:100μm.
Figure 7 is a set of two stained tissues titled Vehicle Control and Domoic Acid, depicting immunohistochemistry of glial fibrillary acidic protein positive astrocytes in the hippocampus and the dentate gyrus.
Figure 7.
Immunohistochemistry for GFAP+astrocytes in the hippocampus. Representative images of immunostaining of 10% formalin-fixed, paraffin-embedded, 10-μm sections for GFAP+astrocytes (1:7,000; Dakocytomation) in the hippocampus of female Macaca fascicularis following prolonged exposed to domoic acid (0.15-mg/kg BW per day) or vehicle (5% sucrose). Images represent the hippocampus (scale bar:2,000μm) and the dentate gyrus (scale bar:100μm). Note: GFAP, glial fibrillary acidic protein.
Figure 8 is a set of eight stained tissues titled Thalamus A 15244, Thalamus A 15249, Thalamus A 16106, Fornix A 15244, Internal Capsule A 15248, Fimbria A 16107, Nucleus Accumbens A 16108, and Nucleus Accumbens Vehicle Control, depicting sections at focal sites of microglia reactivity.
Figure 8.
Focal sites of microglia reactivity. Representative images of Iba-1 immunopositive microglia in 10% formalin-fixed, paraffin-embedded, 10-μm sections at focal sites of reactivity in the thalamus, fornix, fimbria, internal capsule, and nucleus accumbens of female Macaca fascicularis following prolonged exposed to domoic acid (0.15-mg/kg BW per day) or vehicle (5% sucrose). Representative image of the nucleus accumbens in vehicle control is included for comparison. Representative images for the vehicle control fornix, fimbria, internal capsule, and thalamus are provided in Figures 4 and 6. Numbers correspond to Animal Numbers in Table S1. A15244 and A16106 were in the 0.15-mg/kg BW per day group; A15249, A16107, and A16106 were in the 0.075-mg/kg BW per day group; and A15428 was in the control group. Microglia were immunostained with antibody to Iba-1 (1:2,000; Wako Chemicals) followed by IgG antibody, visualized with Vectastain Elite (brown), and counterstained with cresyl violet (CV). Scale bar:100μm.
Figure 9A is a volcano plot, plotting negative log to the base 10 of (lowercase p), ranging from 0 to 5 in unit increments (y-axis) across log to the base 2 (fold change), ranging from negative 4 to 4 (x-axis) for Down regulated and Up regulated. Figure 9B is a heatmap, plotting Animal number (y-axis) across domoic acid, including A 14392, A 15244, A 15234, A 14400, and A 16113 and Vehicle control, including A 15236, A 15238, A 15247, A 16103, and A 15248 (x-axis). A scale depicts color key ranges from negative 2 to 2 in unit increments. Figure 9C is a tabular representation titled Highly significant genes (false discovery rate lowercase q less than 0.05) and has nine rows and three columns, namely, Gene, log to the base 2 fold change, and lowercase q value. Row 1: Chitinase 3 like 1, 1.35, and 0.003. Row 2: Early growth response, 1.10, and 0.046. Row 3: Phospholipid Phosphatase 2, 0.73, and 0.027. Row 4: C D C 42 Effector Protein 1, 0.64, and 0.046. Row 5: Phytanoyl-C o A Dioxygenase Domain Containing 1, negative 1.25, and 0.008. Row 6: Integrin subunit beta like 1, negative 1.31, and 0.014. Row 7: Transmembrane Protein 100, negative 1.18, and 0.037. Row 8: Dopamine Receptor D 2, negative 1.86, and 0.037. Row 9: Vestigial like family member 3, negative 4.39, and 0.006. Figure 9D is a tabular representation titled Significant genes related to domoic acid and has fourteen rows and five columns, namely, Gene, log to the base 2 fold change, lowercase p value, lowercase q value, and citation. Row 1: Activity-regulated cytoskeleton-associated protein, 0.83, 0.001, 0.16, and 1,3. Row 2: Fos proto-oncogene, 1.12, 0.001, 0.18, and 1. Row 3: Early growth response 1, 1.10, less than 0.001, 0.05, 1,2. Row 4: Early growth response 2, 0.95, 0.004, 0.28, and 1. Row 5: Early growth response 4, 0.60, 0.022, 0.56, and 1. Row 6: Nuclear receptor subfamily 4 group a member, 1.07, 0.001, 0.17, and 1. Row 7: B C L 2 interacting protein 2, negative 0.68, 0.02, 0.50, and 2. Row 8: Regulator of G protein signaling 9, negative 1.89, less than 0.001, 0.10, and 2. Row 9: Ras-related protein – R A B 17 asterisk, 1.20, 0.02, 0.5, and 2. Row 10: Ras-related protein – R A B 44 asterisk, 0.82, 0.05, 0.74, and 2. Row 11: Dual specificity phosphatase 2, 1.05, 0.001, 0.13, and 2,3. Row 12: Myocyte-specific enhancer factor 2 C, 0.70, 0.01, 0.43, and 3. Row 13: Plakophilin 3, 1.48, 0.002, 0.23, and 3. Row 14: Retinoid isomerohydrolase – R P E 65, negative 1.46, 0.0.1, 0.16, and 3.
Figure 9.
RNAseq transcriptional profiling of the hippocampus from female Macaca fascicularis following prolonged exposed to domoic acid (DA) or vehicle (5% sucrose). (A) Volcano plot shows differential expression between DA-exposed and unexposed groups. Each dot represents one gene. As indicated by the text, significantly down-regulated genes are highlighted on the left side and up-regulated gene are highlighted on the right side (log2-FC >1.5 and p0.05). Genes along the middle indicate that expression was not significantly changed. (B) Heatmap shows significantly differentially expressed genes in both the exposed animals (left) and control animals (right). Each column represents an individual animal. A14392, A15244, and A15234 were in the 0.15-mg/kg BW per day group, and A14400 and A16113 were in the 0.075-mg/kg BW per day group. Blue highlighting indicates lower expression level and is observed in the upper two-thirds of the distribution for DA-exposed animals as compared with the lower one-third of the vehicle control animals. The red indicates high expression level and is an inverse distribution to those genes showing lower expression levels. The key in the upper right corner of the image provides the density gradient for the blue (lower) and red (upper). (C) Significant genes with a false discovery rate (FDR) of <0.05. All genes in this table had a p<0.001. (D) Significant genes previously reported to be differentially expressed in either a) mice, b) acute zebrafish, or c) chronic zebrafish after DA exposures. Bolded values indicate genes that were differentially expressed in the same direction across the previous studies. *Denotes unspecified homologous RAB gene identified in zebrafish. Note: FC, fold change; RNAseq, RNA sequencing.
Figure 10A is a Gene Set Enrichment Analysis plot titled Enrichment plot: White matter myelin axons, plotting enrichment score (E S), ranging from 0.0 to 0.6 in increments of 0.1 and Ranked list metric (difference of classes), ranging from negative 4 to 2 in unit increments (y-axis) across Rank in ordered data set, ranging from 0 to 14,000 in increments of 2,000 (x-axis) for enrichment profile, hits, and ranking metric scores. Figure 10B is a set of two stained tissues titled Vehicle Control and Domoic Acid, depicting Luxol fast blue staining for myelin in the hippocampus in animals. Figure 10C is a tabular representation with five rows and four columns, namely, Gene, log to the base 2 of fold change, lowercase p value, and lowercase q value. Row 1: Kallikrein related peptidase 6, 0.71, 0.003, and 0.27. Row 2: Myelin associated glycoprotein, 0.68, less than 0.001, and 0.05. Row 3: Galactose-3-O-sulfotransferase 1, 0.65, 0.4, and 0.67. Row 4: Myelin and Lymphocyte protein, 0.63, 0.006, and 0.34. Row 5: Neuregulin 1, negative 0.63, 0.02, and 0.53.
Figure 10.
White matter response to domoic acid. (A) Gene Set Enrichment Analysis (GSEA) plot. The enrichment profile across all genes in that set from GSEA is shown in the upper panel curve, with the significant genes demarked underneath by black vertical lines and a scale representing genes up-regulated on the left (red) to those down-regulated on the right side (blue) of the panel. (B) Representation image of Luxol fast blue (LFB) staining for myelin in the hippocampus of vehicle control and domoic acid-exposed animals. (C) Significantly differentially expressed genes from the white matter GSEA list by log2 FC. Note: Diff, difference; FC, fold change.

Similar articles

Cited by

References

    1. Bates SS, Hubbard KA, Lundholm N, Montresor M, Leaw CP. 2018. Pseudo-nitzschia, Nitzschia, and domoic acid: new research since 2011. Harmful Algae 79:3–43, PMID: , 10.1016/j.hal.2018.06.001. - DOI - PubMed
    1. Brunson JK, McKinnie SMK, Chekan JR, McCrow JP, Miles ZD, Bertrand EM, et al. . 2018. Biosynthesis of the neurotoxin domoic acid in a bloom-forming diatom. Science 361(6409):1356–1358, PMID: , 10.1126/science.aau0382. - DOI - PMC - PubMed
    1. Zaman L, Arakawa O, Shimosu A, Onoue Y, Nishio S, Shida Y, et al. . 1997. Two new isomers of domoic acid from a red alga, Chondria armata. Toxicon 35(2):205–212, PMID: , 10.1016/S0041-0101(96)00123-7. - DOI - PubMed
    1. Steele TS, Brunson JK, Maeno Y, Terada R, Allen AE, Yotsu-Yamashita M, et al. . 2022. Domoic acid biosynthesis in the red alga Chondria armata suggests a complex evolutionary history for toxin production. Proc Natl Acad Sci USA 119(6):e2117407119, PMID: , 10.1073/pnas.2117407119. - DOI - PMC - PubMed
    1. Trainer VL, Bates SS, Lundholm N, Thessen AE, Cochlan WP, Adams NG, et al. . 2012. Pseudo-nitzschia physiological ecology, phylogeny, toxicity, monitoring and impacts on ecosystem health. Harmful Algae 14:271–300, 10.1016/j.hal.2011.10.025. - DOI

Publication types