. 2022 Oct 12;96(19):e0100822.
doi: 10.1128/jvi.01008-22. Epub 2022 Sep 14.

Modulation of SOCS3 Levels via STAT3 and Estrogen-ERαp66 Signaling during Hepatitis E Virus Replication in Hepatocellular Carcinoma Cells

Affiliations

Modulation of SOCS3 Levels via STAT3 and Estrogen-ERαp66 Signaling during Hepatitis E Virus Replication in Hepatocellular Carcinoma Cells

Harini Sooryanarain et al. J Virol. .

Abstract

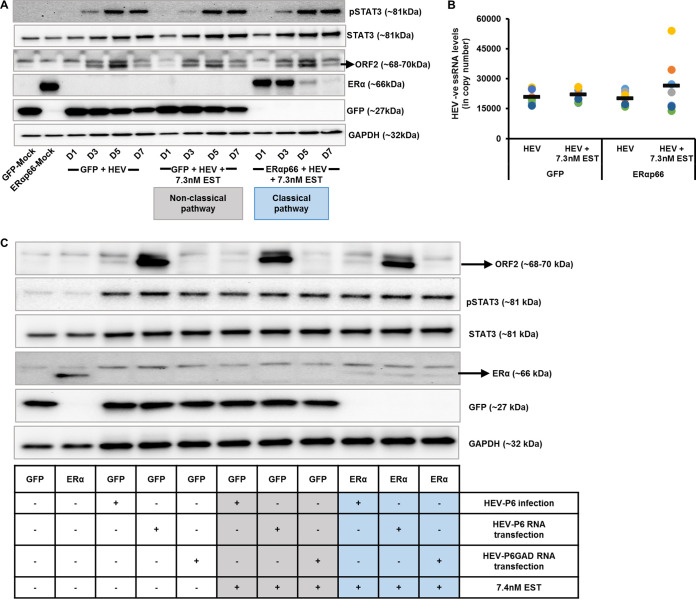
Hepatitis E virus (HEV) infection usually results in a self-limiting acute disease; however, in infected pregnant women, it is associated with increased mortality and fulminant hepatic failure. Estrogen is known to be elevated during pregnancy, and estrogen signaling via classical estrogen receptor-ERα is known to regulate hepatocyte function and host innate immune response, including the STAT3 pathway. In this study, we investigated whether the estrogen classical signaling pathway via ERαp66 has any effect on STAT3 activation during HEV replication and HEV-induced IFN response. We first demonstrated that Huh7-S10-3 liver cells expressed the nonfunctional estrogen receptor ERαp36 isoform and lack the functional ERαp66 isoform. We further showed persistent phosphorylated-STAT3 levels in genotype 3 human HEV (Kernow P6 strain) RNA-transfected cells at later time points. In Huh7-S10-3 cells, estrogen at first-to-third trimester concentration (7.3 to 73 nM) did not significantly affect HEV replication; however, blocking of STAT3 activation led to a decrease in the HEV ORF2 protein level. Our mechanistic study revealed that STAT3 differentially regulates SOCS3 and type-III interferon (IFN) levels during HEV replication and the presence of estrogen-ERαp66 signaling stabilizes SOCS3 levels in vitro. We also demonstrate that HEV infection in pregnant and nonpregnant rabbits led to a significant increase in IFN response as measured by increased levels of IFN-stimulated-gene-15 (ISG15) mRNA levels irrespective of pregnancy status. Collectively, the results indicate that estrogen signaling and STAT3 regulate SOCS3 and IFN responses in vitro during HEV replication. The results have important implications for understanding HEV replication and HEV-induced innate immune response in pregnant women. IMPORTANCE Hepatitis E is usually a self-resolving acute disease; however, in pregnant women, HEV infection is associated with high mortality and fulminant hepatic failure. During pregnancy, estrogen levels are elevated, and in the liver, the estrogen receptor ERα is predominant and estrogen signaling is known to regulate hepatocyte metabolism and leptin-induced STAT3 levels. Viruses can module host innate immune response via STAT3. Therefore, in this study, we investigated whether STAT3 and estrogen-classical signaling via the ERαp66 pathway modulate HEV replication and HEV-induced innate immune response. We demonstrated that estrogen signaling did not affect HEV replication in human liver cells, but blocking of STAT3 activation reduced HEV capsid protein levels in human liver cells. We also showed that inhibition of STAT3 activation reduced SOCS3 levels, while the presence of the estrogen-ERαp66 signaling pathway stabilized SOCS3 levels. The results from this study will aid our understanding of the mechanism of HEV pathogenesis and immune response during pregnancy.

Keywords: SOCS3; STAT3; estrogen; genotype 3 HEV; hepatitis E virus (HEV); pregnancy; replication.


Conflict of interest statement

The authors declare no conflict of interest.

Figures

FIG 1
FIG 1
Huh7-S10-3 hepatocellular carcinoma cells lack functional isoform of estrogen receptor ERαp66. (A) Western blot analyses of classical estrogen receptor ERα in Huh7-S10-3 cells (lane 2), HepG2-C3A cells (lane 3), JEG3 cells (lane 4; a known ERα-negative cell line), and IPECJ2 cells (lane 5). (B) Huh7-S10-3 cells (lane 2), Huh7-S10-3 cells transfected with pCMV-ERαp66 at 24 h posttransfection (lane 3), and 48 h posttransfection (lane 4). For panels A and B, lane 1 is the marker (All-blue marker; Bio-Rad; cat. no. 1610373).
FIG 2
FIG 2
Overexpression of ERαp66 in the presence or absence of first-trimester concentration of estrogen (7.3 nM estrogen). A representative Western blot for ERαp66, GFP, and β-actin protein levels in cells transfected with pCMV-ERαp66 plasmid or with pcDNA-EGFP (vector control) in the presence or absence of 7.3 nM estrogen at various time points (D1 to D10, i.e., 1 to 10 days posttransfection). Lanes containing samples obtained from cell control without estrogen treatment are labeled as CC; lanes containing samples obtained from cells treated with 7.3 nM estrogen are labeled as 7.3 nM EST.
FIG 3
FIG 3
Time kinetics of increased STAT3 phosphorylation during HEV replication in HEV P6 RNA-transfected Huh7-S10-3 liver cells. A representative Western blot of pSTAT3, STAT3, HEV ORF2, and GAPDH protein levels in HEV P6 RNA-transfected Huh7-S10-3 cells at various time points. The sample obtained from cell control without HEV P6 transfection is labeled as CC; samples obtained from HEV P6 RNA-transfected cells are labeled as HEV.
FIG 4
FIG 4
STAT3 phosphorylation increases as HEV replication progresses independent of estrogen receptor ERαp66. A representative Western blot of pSTAT3, STAT3, ERαp66, GFP, HEV ORF2, and GAPDH protein levels at various time points; n = 2 independent experiments. The sample obtained from mock control, i.e., cells without HEV P6 RNA transfection, is labeled as Mock; samples obtained from HEV P6 RNA-transfected cells are labeled as HEV. Time point is represented in hour (hr) post-HEV RNA transfection; 24 to 168 h is 1 to 7 days post-HEV RNA transfection. GFP overexpression, cells overexpressing GFP; ERα overexpression, cells overexpressing ERαp66.
FIG 5
FIG 5
pSTAT3 levels and HEV ORF2 levels remained unaffected by first-trimester concentration of the estrogen-mediated classical and nonclassical signaling pathways. (A) A representative Western blot of pSTAT3, STAT3, ERαp66, GFP, HEV ORF2, and GAPDH protein levels at various indicated time points. D1 to D7 is 1 to 7 days post-HEV RNA transfection; 7.3 nM EST is 7.3 nM estrogen treatment; n = 2 independent experiments. Mock, control cells without any treatment; GFP-Mock, mock control of GFP-overexpressing cells; ERαp66-Mock, mock control of ERαp66-overexpressing cells at D1; GFP + HEV, GFP-overexpressing cells transfected with HEV P6 RNA; ERαp66 + HEV, ERαp66-overexpressing cells transfected with HEV P6 RNA; Nonclassical pathway, estrogen treatment under GFP overexpression is considered to represent estrogen nonclassical pathway signaling; Classical pathway, estrogen treatment under ERαp66-overexpressing cells is considered to represent estrogen classical signaling pathway. (B) HEV RNA levels at day 5 post-HEV RNA transfection as determined by negative-strand HEV RNA RT-qPCR. Each dot represents one independent experiment, and mean is represented as thick black line; n = 7 independent experiments. (C) Representative Western blot of pSTAT3, STAT3, ERαp66, GFP, HEV ORF2, and GAPDH protein levels at 5 days post-HEV-P6 infectious virus infection, HEV-P6 RNA transfection, or HEV-P6-GAD (replication deficient) RNA transfection under various test conditions. GFP, GFP-overexpressing cells; ERαp66, ERαp66-overexpressing cells; HEV, HEV-P6 RNA-transfected cells; HEV + 7.3 nM EST, 7.3 nM estrogen-treated HEV-P6 RNA-transfected cells.
FIG 6
FIG 6
Inhibition of STAT3 activation reduces HEV ORF2 protein levels and stabilizes ERαp66 levels during the estrogen signaling pathway. (A) A representative Western blot of pSTAT3, STAT3, SOCS3, cyclin-D1, ERαp66, GFP, HEV ORF2, and GAPDH protein levels at day 5 post-HEV RNA transfection under various conditions tested in the presence or absence of 70 μM STAT3 inhibitor (S3I-201); n = 2 to 3 independent experiments. Estrogen Nonclassical pathway, estrogen treatment under GFP overexpression is considered to represent estrogen nonclassical pathway signaling; Estrogen Classical pathway, estrogen treatment under ERαp66-overexpressing cells is considered to represent estrogen classical signaling pathway. (B) HEV RNA levels at day 5 post-HEV P6 RNA transfection as determined by negative-strand HEV RNA RT-qPCR under various conditions tested with 70 μM STAT3-inhibitor (w Inh) or without 70 μM STAT3-inhibitor (w/o Inh) treatment, EST (7.3 nM estrogen) treatment; HEV + GFP, GFP-overexpressing cells transfected with HEV P6 RNA; HEV + ERα, ERαp66-overexpressing cells transfected with HEV P6 RNA. Each dot represents one independent experiment, and mean is represented as a thick black line; n = 5 independent experiments, *, P ≤ 0.05, ANOVA with post hoc Student’s t test.
FIG 7
FIG 7
Both estrogen-mediated ERα signaling and STAT3 regulate SOCS3 mRNA levels during HEV replication in vitro. (A and B) Negative-strand HEV RNA (HEV-ve ssRNA) (A) and SOCS3 mRNA (B) levels as determined by gene-specific RT-qPCR. Open bars represent samples obtained from without 70 μM STAT3-inhibitor treatment (w/o Inh), and filled bars represent samples obtained from with 70 μM STAT3-inhibitor (w Inh) treatment. EST (estrogen) treatment concentration as indicated in the figure. GFP + HEV, GFP-overexpressing cells transfected with HEV P6 RNA; ERα + HEV, ERαp66-overexpressing cells transfected with HEV P6 RNA; n = 3 independent biological replicates tested twice. *, P ≤ 0.05; **, P ≤ 0.01 ANOVA with post hoc Student’s t test (to compare STAT3 inhibitor treatment within a group) or Tukey test (to compare multiple groups among the STAT3 inhibitor-treated samples). Fold change was calculated using 2^-ddCT method as follows: RPS18 was used as housekeeping gene, for GFP set 2^-[(dCt GFP + HEV) − (dCt GFP − Mock)], for ERαp66 set 2^-[(dCt ERαp66 + HEV) − (dCt ERαp66 − Mock)]. Dashed line represents baseline gene expression in mock controls. (C) Representative Western blot of pSTAT3, STAT3, SOCS3, cyclin-D1, ERαp66, GFP, HEV ORF2, and GAPDH protein levels at day 5 post-HEV RNA transfection under various STAT3-inhibitor (S3I-201) concentrations tested as indicated; n = 2 independent experiments. Mock, control cells without any treatment; GFP-Mock, mock control of GFP-overexpressing cells; ERαp66-Mock, mock control of ERαp66-overexpressing cells at D1; GFP + HEV, GFP-overexpressing cells transfected with HEV P6 RNA; GFP + HEV + 7.3 nM EST, GFP-overexpressing cells transfected with HEV P6 RNA plus 7.3 nM estrogen treatment; ERαp66 + HEV + 7.3 nM EST, ERαp66-overexpressing cells transfected with HEV P6 RNA plus 7.3 nM estrogen treatment.
FIG 8
FIG 8
STAT3 inhibition enhances interferon response during HEV replication. (A to C) IFN-λ1 (A), ISG15 (B), and IL-6 mRNA (C) levels at day 5 post-HEV P6 RNA-transfected cells under various test conditions as determined by gene-specific RT-qPCR. Open bars represent samples obtained from without 70 μM STAT3-inhibitor treatment (w/o Inh), and filled bars represent samples obtained from with 70 μM STAT3-inhibitor (w Inh) treatment. EST (estrogen) treatment concentration as shown. GFP + HEV, GFP-overexpressing cells transfected with HEV P6 RNA; ERα + HEV, ERαp66-overexpressing cells transfected with HEV P6 RNA. Fold change was calculated using 2^-ddCT method as follows: RPS18 was used as housekeeping gene, for GFP set 2^-[(dCt GFP + HEV) − (dCt GFP − Mock)] and for ERαp66 set 2^-[(dCt ERαp66 + HEV) − (dCt ERαp66 − Mock)]. Dashed line represents baseline gene expression in mock controls; n = 3 independent biological replicates tested twice. *, P ≤ 0.05; **, P ≤ 0.01 ANOVA with post hoc Student’s t test (to compare STAT3 inhibitor treatment within a group) or Tukey test (to compare multiple groups among the STAT3 inhibitor-treated samples).
FIG 9
FIG 9
Increased ISG15 mRNA levels in the convenient liver tissues of HEV-infected rabbits irrespective of pregnancy status. (A) Representative western blot of ERαp66 and GAPDH in control and HEV-infected non-pregnant and pregnant rabbits (N = 3 from each group). (B) SOCS3, and (C) ISG15 mRNA levels as determined by gene-specific RT-qPCR in control and HEV-infected nonpregnant and pregnant rabbits at 4 weeks postinfection; n = 7 control nonpregnant rabbits, 7 HEV-infected nonpregnant rabbits, 8 control pregnant rabbits, and 8 HEV-infected pregnant rabbits. Each dot represents one individual animal, and thick black line represents mean. *, P ≤ 0.05 as determined by F test.

Similar articles

Cited by

References

    1. Purdy MA, Harrison TJ, Jameel S, Meng XJ, Okamoto H, Van der Poel WHM, Smith DB, Ictv Report Consortium. 2017. ICTV virus taxonomy profile: Hepeviridae. J Gen Virol 98:2645–2646. 10.1099/jgv.0.000940. - DOI - PMC - PubMed
    1. Purdy MA, Khudyakov YE. 2011. The molecular epidemiology of hepatitis E virus infection. Virus Res 161:31–39. 10.1016/j.virusres.2011.04.030. - DOI - PubMed
    1. Smith DB, Izopet J, Nicot F, Simmonds P, Jameel S, Meng XJ, Norder H, Okamoto H, van der Poel WHM, Reuter G, Purdy MA. 2020. Update: proposed reference sequences for subtypes of hepatitis E virus (species Orthohepevirus A). J Gen Virol 101:692–698. 10.1099/jgv.0.001435. - DOI - PMC - PubMed
    1. Lhomme S, Marion O, Abravanel F, Izopet J, Kamar N. 2020. Clinical manifestations, pathogenesis and treatment of hepatitis E virus infections. J Clin Med 9:331. 10.3390/jcm9020331. - DOI - PMC - PubMed
    1. Sooryanarain H, Meng XJ. 2019. Hepatitis E virus: reasons for emergence in humans. Curr Opin Virol 34:10–17. 10.1016/j.coviro.2018.11.006. - DOI - PMC - PubMed

Publication types

MeSH terms