

Counting the cost of premature mortality with progressively worse aortic stenosis in Australia: a clinical cohort study
- PMID: 36102774
- PMCID: PMC9484033
- DOI: 10.1016/S2666-7568(22)00168-4
Counting the cost of premature mortality with progressively worse aortic stenosis in Australia: a clinical cohort study
Abstract
Background: Aortic stenosis is the most common cardiac valve disorder requiring clinical management. However, there is little evidence on the societal cost of progressive aortic stenosis. We sought to quantify the societal burden of premature mortality associated with progressively worse aortic stenosis.
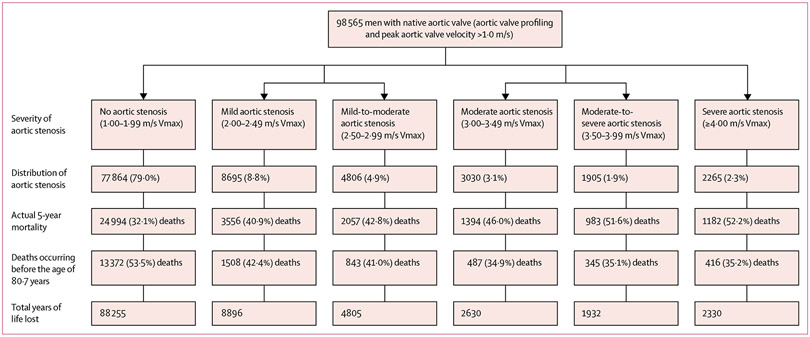
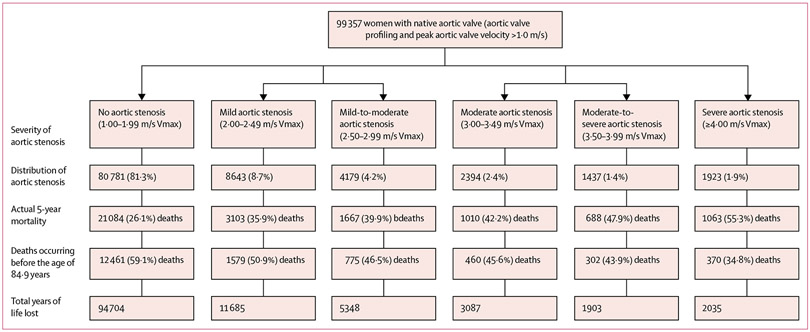
Methods: In this observational clinical cohort study, we examined echocardiograms on native aortic valves of 98 565 men and 99 357 women aged 65 years or older across 23 sites in Australia, from Jan 1, 2003, to Dec 31, 2017. Individuals were grouped according to their peak aortic valve velocity in 0·50 m/s increments up to 4·00 m/s or more (severe aortic stenosis), using 1·00-1·99 m/s (no aortic stenosis) as the reference group. Sex-specific premature mortality and years of life lost during a 5-year follow-up were calculated, along with willingness-to-pay to regain quality-adjusted life years (QALYs).
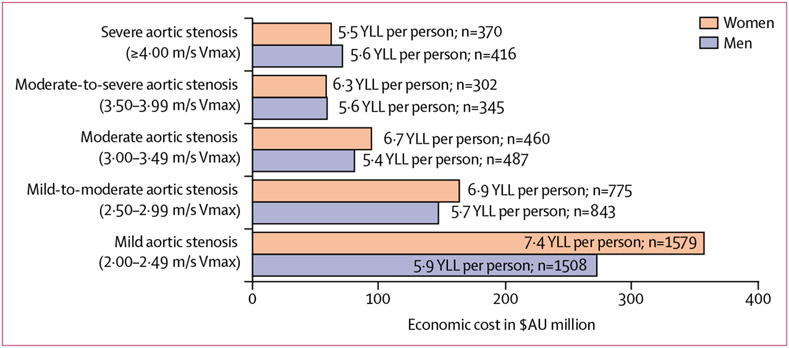
Findings: Overall, 20 701 (21·0%) men and 18 576 (18·7%) women had evidence of mild-to-severe aortic stenosis. The actual 5-year mortality in men with normal aortic valves was 32·1% and in women was 26·1%, increasing to 40·9% (mild aortic stenosis) and 52·2% (severe aortic stenosis) in men and to 35·9% (mild aortic stenosis) and 55·3% (severe aortic stenosis) in women. Overall, the estimated societal cost of premature mortality associated with aortic stenosis was AU$629 million in men and $735 million in women. Per 1000 men and women investigated, aortic stenosis was associated with eight more premature deaths in men resulting in 32·5 more QALYs lost (societal cost of $1·40 million) and 12 more premature deaths in women resulting in 57·5 more QALYs lost (societal cost of $2·48 million) when compared with those without aortic stenosis.
Interpretation: Any degree of aortic stenosis in older individuals is associated with premature mortality and QALYs. In this context, there is a crucial need for cost-effective strategies to promptly detect and optimally manage this common condition within our ageing populations.
Funding: Edwards LifeSciences, National Health and Medical Research Council of Australia, and the National Heart, Lung, and Blood Institute.
Copyright © 2022 The Author(s). Published by Elsevier Ltd. This is an Open Access article under the CC BY 4.0 license. Published by Elsevier Ltd.. All rights reserved.
Conflict of interest statement
Declaration of interests GAS and DP are the co-principal investigators and directors of the National Echo Database of Australia (NEDA; a not-for-profit research entity). NEDA has received investigator-initiated funding support from Novartis Pharmaceuticals, Pfizer Pharmaceuticals, ECHO IQ, and Edward Lifesciences in the past 3 years. SS has received consultancy fees from NEDA. SS, DP, and GAS have previously received consultancy or speaking fees from Edwards Lifesciences. DP and GAS have previously received consultancy or speaking fees from Medtronic. JBS reports grant support from Ultromics, HeartSciences, and Anumana; consulting fees from Bracco Diagnostics; and speaker fees from Northwest Imaging Forums. All other authors declare no competing interests.
Figures
Comment in
-
Live longer and better without aortic valve stenosis.Lancet Healthy Longev. 2022 Sep;3(9):e573-e574. doi: 10.1016/S2666-7568(22)00188-X. Epub 2022 Aug 18. Lancet Healthy Longev. 2022. PMID: 36102767 No abstract available.
References
-
- Tsao CW, Aday AW, Almarzooq ZI, et al. Heart disease and stroke statistics-2022 update: a report from the American Heart Association. Circulation 2022; 145: e153–639. - PubMed
-
- Durko AP, Osnabrugge RL, Van Mieghem NM, et al. Annual number of candidates for transcatheter aortic valve implantation per country: current estimates and future projections. Eur Heart J 2018; 39: 2635–42. - PubMed
Publication types
MeSH terms
Grants and funding
LinkOut - more resources
Full Text Sources
Research Materials
