. 2022 Nov 7;221(11):e202201160.
doi: 10.1083/jcb.202201160. Epub 2022 Sep 14.

Mitochondrial dysfunction triggers actin polymerization necessary for rapid glycolytic activation

Affiliations

Mitochondrial dysfunction triggers actin polymerization necessary for rapid glycolytic activation

Rajarshi Chakrabarti et al. J Cell Biol. .

Abstract

Mitochondrial damage represents a dramatic change in cellular homeostasis. One rapid response is perimitochondrial actin polymerization, termed acute damage-induced actin (ADA). The consequences of ADA are not understood. In this study, we show evidence suggesting that ADA is linked to rapid glycolytic activation upon mitochondrial damage in multiple cells, including mouse embryonic fibroblasts and effector CD8+ T lymphocytes. ADA-inducing treatments include CCCP, antimycin, rotenone, oligomycin, and hypoxia. The Arp2/3 complex inhibitor CK666 or the mitochondrial sodium-calcium exchanger (NCLX) inhibitor CGP37157 inhibits both ADA and the glycolytic increase within 5 min, supporting ADA's role in glycolytic stimulation. Two situations causing chronic reductions in mitochondrial ATP production, mitochondrial DNA depletion and mutation to the NDUFS4 subunit of complex 1 of the electron transport chain, cause persistent perimitochondrial actin filaments similar to ADA. CK666 treatment causes rapid mitochondrial actin loss and a drop in ATP in NDUFS4 knock-out cells. We propose that ADA is necessary for rapid glycolytic activation upon mitochondrial impairment, to re-establish ATP production.


Figures

Figure 1.
Figure 1.
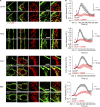
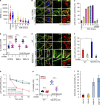
ADA in multiple cell types. (A) Micrographs of live-cell imaging for U2-OS, HeLa, Cos-7, and MEF cell before (0 s) and at their peak ADA timepoints after 20 µM CCCP addition (150 s–U2-OS; 135 s -HeLa; 210 s–Cos-7; 225 s–MEF). All cells were transfected with markers for actin filaments (GFP-F-tractin, green) and mitochondria (mito-DsRed, red). Scale bars are 10 μm (full cell) and 5 μm (inset). Yellow arrow indicates punctate mitochondrion without actin assembly. Corresponds to Videos 1, 2, 3, and 4. (B) Graph of actin intensity (± SEM) around mitochondria in U2-OS, HeLa, Cos-7, and MEF cells as a function of time of 20 µM CCCP or 100 µM CK666 + 20 µM CCCP simultaneous treatment. Cells per condition: U2-OS, n = 31; HeLa, n = 32; Cos-7, n ≥ 17; MEF, n ≥ 22 combined from two independent experiments. Arrows indicate time of treatment. **** P < 0.0001. Statistical significance was calculated between the indicated timepoint using unpaired two-tailed t tests. Experiments done in 25 mM glucose with serum. Exact number of experiments, statistical tests, and sample sizes are provided in Table S1.
Figure S1.
Figure S1.
Line scans of ADA MEFs. (A) Micrographs of actin assembly around mitochondria in fixed MEFs, stained for actin (green) and mitochondria (red). Scale bar: 5 µm. Blue lines represent the region for line scans in B. Yellow arrows indicate punctate mitochondria without actin assembly. (B) Line scans showing the fluorescent intensity for actin and mitochondria signal across each mitochondrion as shown in A. (C) Quantification of % mitochondria displaying ADA in control (DMSO-treated) and CCCP-treated (3 min) MEFs. n = 30 cells combined from three independent experiments. Mean, SD, and number of cells given for each condition on graph. **** P < 0.0001. Statistical significance was calculated using unpaired two-tailed t tests. Number of experiments, sample sizes, and statistical tests are provided in Table S1. Video 5 shows a closedup mitochondria with ADA in U2-OS cell.
Figure 2.
Figure 2.
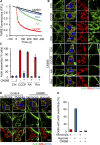
ADA stimulation by mitochondrial depolarization or ETC inhibition. (A) Mitochondrial depolarization (assessed by TMRE fluorescence) in MEFs with DMSO, CCCP, antimycin A or rotenone (± SEM) treatments. n ≥ 98 cells per group combined from three independent experiments. Experiments done in 25 mM glucose with serum. (B) MEFs stained for actin filaments (TRITC-phalloidin, green), mitochondria (Tom20, red) and DNA (DAPI, blue) after 3 min treatment with DMSO, 20 µM CCCP, 25 µM antimycin A or 50 µM rotenone in the absence (top) or presence (bottom) of 100 µM CK666. Right images are zooms of boxed regions. Scale bar: 5 μm. (C) % cells (± SD) displaying ADA for the conditions shown in B. n ≥ 62/18 cells/fields of view (FOV) per group combined from two experiments. Experiments done in 25 mM glucose with serum. (D) MEFs stained similarly to B, in normoxia or hypoxia for 30 min, in the presence or absence of 100 µM CK666. Scale bars are 10 μm (full cell) and 5 μm (inset). (E) % cells displaying ADA after 30 min normoxia or hypoxia, in the absence or presence of 100 µM CK666. n ≥ 174/20 cells/FOV per group combined from two biological experiments. Experiments done in 25 mM glucose without serum. Exact number of experiments, FOV and sample size are provided in Table S1.
Figure S2.
Figure S2.
Oligomycin-induced ADA in MEFs. (A) Mitochondrial polarization (assessed by TMRE fluorescence) in MEFs with DMSO, 1 µM CCCP or 1.5 µM oligomycin (± SEM) treatment. n ≥ 118 cells per group combined from two independent experiments. Experiments done in 2 mM glucose without serum. (B) MEFs stained for actin filaments (TRITC-phalloidin, green), mitochondria (Tom20, red) and DNA (DAPI, blue) after 5 min treatment with DMSO, 1.5 µM oligomycin or 1.5 µM oligomycin with 100 µM CK666. Bottom images are zooms of boxed regions. Experiments done in 2 mM glucose without serum. Scale bars: 10 and 5 μm. Arrow indicates actin assembly. (C) % cells (± SEM) displaying ADA for the conditions shown in panel B. n ≥ 65/14 cells/fields of view (FOV) per group combined from two independent experiments. **** P < 0.0001. Statistical significance was calculated using unpaired two-tailed t tests. Experiments done in 2 mM glucose without serum. (D) Graph of actin intensity (± SEM) around mitochondria in MEF cells as a function of time for 1 µM CCCP or 100 µM CK666 + 1 µM CCCP simultaneous treatment. Cells were cultured in Agilent seahorse DMEM supplemented with 1 mM glucose and 4 mM glutamine but without serum for 1 h before imaging. n ≥ 35 cells per condition combined from two independent experiments. Arrow indicates time of treatment. **** P < 0.0001. Statistical significance at indicated timepoint was calculated using unpaired two-tailed t tests. Number of experiments, statistical tests, and sample sizes are provided in Table S1.
Figure 3.
Figure 3.
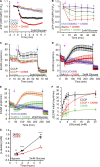
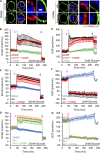
ADA is required for glycolytic activation upon mitochondrial perturbation in MEFs. (A) Cytoplasmic ATP levels (± SEM) after 20 µM CCCP in the absence or presence of 100 µM CK666, using GO-ATeam1. n ≥ 35 cells per group combined from two independent experiments. P values are graphed in Fig. S3 A. Arrow indicates time of treatment. Experiments done in 2 mM glucose with serum. (B) Cytoplasmic ATP levels (± SEM) after 25 µM antimycin A or 50 µM rotenone in the absence or presence of 100 µM CK666, using GO-ATeam1. n ≥ 24 cells per group combined from two independent experiments. P values graphed in Fig. S3 C. Arrow indicates time of treatment. Experiments done in 2 mM glucose with serum. (C) ECAR (± SD) upon 100 µM CK666, 1 µM CCCP or 1 µM CCCP + 100 µM CK666 addition (15 min), followed by 50 mM 2-deoxyglucose (2-DG) (59 min) in 2 mM glucose medium without serum. n = 3 individual well measurements for CCCP and CK666; 4 for CCCP + CK666. Pink arrow indicates drug treatment and blue arrow indicate 2-DG treatment. (D) ECAR (± SD) upon DMSO, 100 µM CK666, 2.5 µM antimycin A or 2.5 µM antimycin A + 100 µM CK666 addition (33 min), then 50 mM 2-DG (258 min) in 2 mM glucose medium without serum. n = 5 individual well measurements per condition. Pink arrow indicates drug treatment and blue arrow indicates 2-DG treatment. (E) ECAR (± SD) upon DMSO, 100 µM CK666, 5 µM rotenone or 5 µM rotenone + 100 µM CK666 addition (33 min), then 50 mM 2-DG (258 min) in 2 mM glucose medium without serum. n = 5 individual well measurements per condition. Pink arrow indicates drug treatment and blue arrow indicates 2-DG treatment. (F) Effect of glucose concentration on ECAR spike (± SD) induced by 3 min 1 µM CCCP, with and without 100 µM CK666. n = 9 individual well measurements for CCCP and CK666; 12 for CCCP + CK666. P values graphed in Fig. S4 D. (G) Effect of 100 µM CK666 on lactate production in hypoxia (1% O2) in MEFs at 2 mM glucose without serum. Points indicate individual well measurements starting with 100,000 cells/well. n = 8 individual well measurements from four independent experiments. ** P = 0.0018; **** P < 0.0001. Statistical significance was calculated by two-way ANOVA using Tukey’s multiple comparisons test. Number of experiments, FOV, sample sizes and statistical tests are provided in Table S1.
Figure S3.
Figure S3.
ATP levels changes by complex I or III inhibition. (A) Graph of P values for comparisons of GO-ATeam1 timecourses in Fig. 3 A (CCCP or CCCP/CK666 treatment of MEFs in 2 mM glucose). Statistical significance was calculated by two-way ANOVA using Tukey’s multiple comparisons test. (B) ATP levels (± SD) in MEFs upon DMSO, 1 µM CCCP or 1 µM CCCP + 100 µM CK666 treatments in medium containing either 1 or 25 mM glucose without serum, assayed from cell extracts. Points indicate individual measurements starting with 106 cells/dish. n = 12 individual well measurements from four independent experiments for 25 mM glucose groups and 18 individual well measurements from six independent experiments for 1 mM glucose groups. n.s. P > 0.05; **** P < 0.0001. Statistical significance was calculated by one-way ANOVA using Tukey’s multiple comparisons test. (C) Graph of P values for comparisons of GO-ATeam1 timecourses in Fig. 3 B (antimycin A and rotenone treatments of MEFs in 2 mM glucose). Statistical significance was calculated by two-way ANOVA using Tukey’s multiple comparisons test. (D) Graph of change in ATP levels (± SEM) in live MEFs stimulated with 20 µM CCCP in the absence or presence of 100 µM CK666, using GO-ATeam1 biosensor. Cells cultured in medium containing 25 mM glucose with serum. n ≥ 20 cells for each group combined from two independent experiments. Arrow indicates time of treatment. Statistical significance was calculated by two-way ANOVA using Tukey’s multiple comparisons test and presented in Table S1. (E) Graph of change in ATP levels (± SEM) in live MEFs stimulated with 25 µM antimycin A or 50 µM rotenone in the absence or presence of 100 µM CK666, using GO-ATeam1 biosensor. Cells cultured in medium containing 25 mM glucose with serum. n ≥ 33 cells for each group combined from two independent experiments. Arrow indicates time of treatment. Statistical significance was calculated by two-way ANOVA using Tukey’s multiple comparisons test and presented in Table S1. Number of experiments, statistical tests, and sample sizes are provided in Table S1.
Figure S4.
Figure S4.
Changes in ECAR in MEFs after mitochondrial inhibitor treatments. (A) ECAR (± SD) upon 100 µM CK666, 1 µM CCCP or 1 µM CCCP + 100 µM CK666 addition (15 min), followed by 50 mM 2-DG (59 min) in 25 mM glucose medium without serum. n = 3 individual well measurements for CCCP and CK666; 4 for CCCP + CK666. Pink arrow indicates drug treatment and blue arrow indicates 2-DG treatment. (B) ECAR (± SD) upon DMSO, 100 µM CK666, 2.5 µM antimycin A or 2.5 µM antimycin A + 100 µM CK666 addition (33 min), then 50 mM 2-DG (258 min) in 25 mM glucose medium without serum. n = 5 individual well measurements per condition. Pink arrow indicates drug treatment and blue arrow indicates 2-DG treatment. (C) ECAR (± SD) upon DMSO, 100 µM CK666, 5 µM rotenone or 5 µM rotenone + 100 µM CK666 addition (33 min), then 50 mM 2-DG (258 min) in 25 mM glucose medium without serum. n = 5 individual well measurements per condition. Pink arrow indicates drug treatment and blue arrow indicates 2-DG treatment. (D) P values for comparisons between individual curves in Fig. 3 F. Statistical significance was calculated by two-way ANOVA using Tukey’s multiple comparisons test. (E) Effect of glucose concentration (± SD) on prolonged ECAR increase (after 40 min) induced by 1 µM CCCP or 1 µM CCCP + 100 µM CK666 in MEFs. n = 9 individual well measurements for CCCP and CK666; 12 for CCCP + CK666. P values graphed in F. (F) P values for comparisons between individual curves in E. Statistical significance was calculated by two-way ANOVA using Tukey’s multiple comparisons test. Number of experiments, statistical tests, and sample sizes are provided in Table S1.
Figure S5.
Figure S5.
Effect of NCLX inhibition on CCCP- and oligomycin-activated glycolysis. (A) ECAR (± SD) upon DMSO, 100 µM CK666, 80 µM CGP37157, 1 µM CCCP, 1 µM CCCP + 100 µM CK666 addition, or 1 µM CCCP + 80 µM CGP37157 addition (at 23 min, pink arrow), followed by 50 mM 2-DG (at 89 min, blue arrow) in 2 mM glucose medium without serum. n = 8 individual well measurements per condition. (B) ECAR (± SD) upon DMSO, 100 µM CK666, 80 µM CGP37157, 1.5 µM oligomycin, 1 µM oligomycin + 100 µM CK666 addition or 1 µM oligomycin + 80 µM CGP37157 addition (at 23 min, pink arrow), followed by 50 mM 2-DG (at 89 min, blue arrow) in 2 mM glucose medium without serum. n = 8 individual well measurements per condition. (C) OCR (± SD) in MEFs (in 2 mM glucose without serum) upon 100 µM CK666, 1 µM CCCP or 1 µM CCCP + CK666 addition at 15 min, then 50 mM 2-DG at 59 min. n = 3 individual well measurements for CCCP and CK666; 4 for CCCP + CK666. Pink arrow indicates drug treatment and blue arrow indicates 2-DG treatment. (D) OCR (± SD) in MEFs (in 2 mM glucose without serum) upon DMSO, 100 µM CK666, 2.5 µM antimycin A or 2.5 µM antimycin A + 100 µM CK666 addition at 33 min, then 50 mM 2-DG at 258 min. n = 5 individual well measurements per condition. Pink arrow indicates drug treatment and blue arrow indicates 2-DG treatment. (E) OCR (± SD) in MEFs (in 2 mM glucose without serum) upon DMSO, 100 µM CK666, 2.5 µM rotenone or 2.5 µM rotenone + 100 µM CK666 addition at 33 min, then 50 mM 2-DG at 258 min. n = 5 individual well measurements per condition. Pink arrow indicates drug treatment and blue arrow indicates 2-DG treatment. Number of experiments and sample sizes are provided in Table S1.
Figure S6.
Figure S6.
Changes in lactate production induced by mitochondrial inhibitors and hypoxia in MEFs. (A) Effect of 100 µM CK666 on lactate production upon 1 µM CCCP, 2.5 µM antimycin A, 5 µM rotenone or DMSO treatment of MEFs in 2 mM glucose without serum. Points indicate individual well measurements starting with 75,000 cells/well. n = 8 individual well measurements from four independent experiments. Statistical significance was calculated by two-way ANOVA using Tukey’s multiple comparisons test and presented in Table S1. (B) Effect of 100 µM CK666 on lactate production upon 1 µM CCCP, 2.5 µM antimycin A, 5 µM rotenone or DMSO treatment of MEFs in 25 mM glucose without serum. Points indicate individual well measurements starting with 75,000 cells/well. n = 8 individual well measurements from four independent experiments. Statistical significance was calculated by two-way ANOVA using Tukey’s multiple comparisons test and presented in Table S1. (C) Effect of 100 µM CK666 on lactate production in normoxia (21% O2) in MEFs at 2 mM glucose without serum. Points indicate individual well measurements starting with 100,000 cells/well. n = 8 individual well measurements from four independent experiments. n.s. P > 0.05; ** P = 0.002. *** P = 0.0002. Statistical significance was calculated by two-way ANOVA using Tukey’s multiple comparisons test. (D) Effect of 100 µM CK666 on lactate production in normoxia in MEFs at 25 mM glucose without serum. Points indicate individual well measurements starting with 100,000 cells/well. n = 8 individual well measurements from four independent experiments. n.s. P > 0.05. Statistical significance was calculated by two-way ANOVA using Sidak’s multiple comparisons test. (E) Effect of 100 µM CK666 on lactate production in hypoxia in MEFs at 25 mM glucose without serum. Points indicate individual well measurements starting with 100,000 cells/well. n = 8 individual well measurements from four independent experiments. n.s. P > 0.05; *** P = 0.0003. Statistical significance was calculated by two-way ANOVA using Tukey’s multiple comparisons test. Number of experiments, statistical tests, and sample sizes are provided in Table S1.
Figure S7.
Figure S7.
Cytoplasmic ATP changes induced by ATP synthase inhibition. (A) Cytoplasmic ATP levels (± SEM) after 1.5 µM oligomycin in the absence or presence of 100 µM CK666, or 1 µM CCCP using GO-ATeam1. Data were normalized to DMSO control. n ≥ 24 cells per group combined from two independent experiments. Arrow indicates time of treatment. Statistical significance was calculated by two-way ANOVA using Tukey’s multiple comparisons test and presented in Table S1. Experiments done in 25 mM glucose without serum. (B) Cytoplasmic ATP levels (± SEM) after 1.5 µM oligomycin in the absence or presence of 100 µM CK666, or 1 µM CCCP using GO-ATeam1. Data were normalized to DMSO control. n ≥ 24 cells per group combined from two independent experiments. Arrow indicates time of treatment. Statistical significance was calculated by two-way ANOVA using Tukey’s multiple comparisons test and presented in Table S1. Experiments done in 2 mM glucose without serum. (C) AMPK activation after 5 min treatment of MEFs with ETC or ATP synthase inhibition. Actin is used as a loading control. Experiments done in 2 mM glucose without serum. Number of experiments, statistical tests, and sample sizes are provided in Table S1. Source data are available for this figure: SourceDataFS7.
Figure 4.
Figure 4.
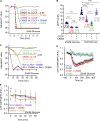
Actin assembly in ETC protein depleted cells. (A) Mitochondrial polarization in MEFs (± SD) after 0.2 μg/ml ethidium bromide(EtBr)/50 μg/ml uridine treatment. Ctrl, untreated. Uridine, uridine treatment alone (10 d). CCCP - 10 min 20 µM CCCP-treated Ctrl cells. Circles indicate individual cell measurements (n ≥ 86 cells per group combined from two independent experiments). Experiments done in 25 mM glucose with serum. (B) MEFs under uridine alone or ethidium bromide/uridine treatment (EtBr) for 10 d, stained for actin filaments (green) and mitochondria (red). Scale bars: 5 μm. (C) % cells (± SD) displaying actin assembly after time in ethidium bromide/uridine, with and without 100 µM CK666. n ≥ 98/15 cells/fields of view (FOV) per group combined from two experiments. Experiments done in 25 mM glucose with serum. (D) Lactate production (± SD) in ethidium bromide cells (4 d, EtBr-4; 10 d, EtBr-10) and uridine-treated control (10 d), with and without 100 µM CK666 after 6 h. Points indicate individual well measurements starting with 75,000 cells/well. n = 8 individual well measurements from four independent experiments. n.s. P > 0.05; **** P < 0.0001. Statistical significance was calculated by one-way ANOVA using Tukey’s multiple comparisons test. Experiments done in 2 mM glucose without serum. (E) WT and NDUFS4 KO MEFs stained for actin filaments (green) and mitochondria (red). Scale bars: 5 μm. (F) % cells (± SD) displaying actin assembly in WT and NDUFS4 KO MEFs, with and without 10 min of 100 µM CK666 treatment. n ≥ 70/12 cells/FOVs per group combined from three independent experiments. * P = 0.018. Statistical significance was calculated using unpaired two-tailed t tests. Experiments done in 25 mM glucose with serum. (G) Cytosolic ATP levels in WT or NDUFS4 KO MEFs upon 100 µM CK666 treatment. n ≥ 30 cells per group combined from three independent experiments. Arrow indicates drug treatment. Experiments done in 25 mM glucose with serum. (H) Lactate production (± SD) in WT and NDUFS4 KO cells, with and without 100 µM CK666 after 6 h. Points indicate individual well measurements starting with 75,000 cells/well. n = 8 individual well measurements from four independent experiments. n.s. P > 0.05; **** P < 0.0001. Statistical significance was calculated by one-way ANOVA using Tukey’s multiple comparisons test. Experiments done in 2 mM glucose without serum. (I) % cells (± SEM) displaying actin assembly in control or Leigh syndrome patient fibroblasts. n ≥ 76/13 cells/FOVs per group combined from two independent experiments. Experiments done in 25 mM glucose with serum. Statistical tests are tabled in Fig. S10 B. Number of experiments, FOV, sample sizes, and statistical tests are provided in Table S1.
Figure S8.
Figure S8.
ADA and mitochondrial depolarization in EtBr-treated cells. (A) Micrographs of TMRE staining of EtBr-treated cells at varying days post-treatment or control cells treated with uridine for 10 days. For days 8 and 10 post-EtBr treatment, the images below represent increased processing to reveal the presence of cells. Scale bar: 5 μm. (B) Micrographs of actin staining (TRITC-phalloidin, green) around mitochondria (Tom20, red) at different days of EtBr treatment. DNA is stained with DAPI (blue). Images at the bottom are zooms of the boxed region. Scale bars: 5 μm. (C) Micrographs of actin staining (TRITC-phalloidin, green) around mitochondria (Tom20, red) at day 10 of EtBr treatment with or without 100 µM CK666 for 5 min before fixation. Images at the right are zooms of the boxed region. Scale bars: 10 and 5 μm.
Figure S9.
Figure S9.
Changes in lactate production in EtBr or NDUFS4 KO MEFs. (A) Time course of lactate production from control cells (uridine-treated and in 2 mM glucose without serum) in the presence or absence of 100 µM CK666. Points indicate individual well measurements starting with 75,000 cells/well. n = 8 individual well measurements from four independent experiments. n.s. P > 0.05. (B) Time course of lactate production from EtBr-4 cells (in 2 mM glucose without serum) in the presence or absence of 100 µM CK666. Points indicate individual well measurements starting with 75,000 cells/well. n = 8 individual well measurements from four independent experiments. **** P < 0.0001. Statistical significance was calculated by two-way ANOVA using Tukey’s multiple comparisons test. (C) Time course of lactate production from EtBr-10 cells (in 2 mM glucose without serum) in the presence or absence of 100 µM CK666. Points indicate individual well measurements starting with 75,000 cells/well. n = 8 individual well measurements from four independent experiments. **** P < 0.0001. Statistical significance was calculated by two-way ANOVA using Tukey’s multiple comparisons test. (D) Time course of lactate production from WT and NDUFS4 KO cells (in 2 mM glucose without serum) in the presence or absence of 100 µM CK666. Points indicate individual well measurements starting with 75,000 cells/well. n = 8 individual well measurements from four independent experiments. Statistical significance between WT conditions and NDUFS4 KO conditions were calculated by two-way ANOVA using Tukey’s multiple comparisons test and presented in Table S1. (E) Time course of lactate production from WT and NDUFS4 KO cells (in 25 mM glucose without serum) in the presence or absence of 100 µM CK666. Points indicate individual well measurements starting with 75,000 cells/well. n = 8 individual well measurements from four independent experiments. Statistical significance between WT conditions and NDUFS4 KO conditions were calculated by two-way ANOVA using Tukey’s multiple comparisons test and presented in Table S1. Number of experiments, statistical tests, and sample sizes are provided in Table S1.
Figure S10.
Figure S10.
Actin assembly in Leigh syndrome fibroblasts. (A) Micrographs of actin staining (TRITC-phalloidin, green) around mitochondria (Tom20, red) for control and Leigh syndrome fibroblasts. Scale bars are 10 µm (full cell) and 5 µm (inset). (B) Table giving P values for comparisons of graph in Fig. 4 I using unpaired Student’s t test. Ctrl #1–2 were combined for analysis. Number of experiments and sample sizes are provided in Table S1.
Figure 5.
Figure 5.
Effector T lymphocytes (Teff) require ADA for glycolytic activation. (A) Teff stained for actin filaments (TRITC-phalloidin, green), mitochondria (Tom20, red), and DNA (DAPI, blue) under un-stimulated conditions, or after treatment with 3 min 1 µM CCCP, 5 min 2.5 µM antimycin A, 5 5 µM min rotenone, or 60 min hypoxia in 2 mM glucose medium. Right images are zooms of boxed regions. Scale bars: 5 μm (full cell) and 2 μm (inset). (B) % cells (± SEM) displaying ADA in treatments described in A, n ≥ 61/5 cells/FOV per group combined from two independent experiments. **** P < 0.0001. Statistical significance between respective treatments in the presence or absence of CK666 was calculated using unpaired two-tailed t tests. Experiments done in 2 mM glucose without serum. (C) ECAR (± SD) in Teff upon addition of 100 µM CK666, 1 µM CCCP or 1 µM CCCP + 100 µM CK666 (45 min), followed by 50 mM 2-deoxyglucose (2-DG; 223 min) in 2 mM glucose medium without serum. n = 4 individual well measurements per condition. Pink arrow indicates drug treatment and blue arrow indicates 2-DG treatment. (D) ECAR (± SD) in Teff upon addition of DMSO, 2.5 µM antimycin A or 2.5 µM antimycin A + 100 µM CK666 (45 min), followed by 50 mM 2-DG (223 min) in 2 mM glucose medium without serum. n = 4 individual well measurements per condition. Pink arrow indicates drug treatment and blue arrow indicates 2-DG treatment. (E) ECAR (± SD) in Teff upon addition of DMSO, 5 µM rotenone or 5 µM rotenone + 100 µM CK666 (45 min), followed by 50 mM 2-DG (223 min) in 2 mM glucose medium without serum. n = 4 individual well measurements per condition. Pink arrow indicates drug treatment and blue arrow indicates 2-DG treatment. (F) Lactate production (2 mM glucose without serum) induced by hypoxia (1% oxygen) in Teff in the presence or absence of 100 µM CK666 addition. Circles indicate individual well measurements starting with 400,000 cells/well. n = 8 individual well measurements from four independent experiments. ** P = 0.0013; **** P < 0.0001. Statistical significance was calculated by two-way ANOVA using Tukey’s multiple comparisons test. Number of experiments, FOV, sample size, and statistical tests used are provided in Table S1.
Figure S11.
Figure S11.
Effect of CK666 on ADA and glycolytic activation in Teff. (A) Teff stained for actin filaments (TRITC-phalloidin, green), mitochondria (Tom20, red) and DNA (DAPI, blue) after CCCP, antimycin A, rotenone, or hypoxia in the presence of CK666 for 2 mM glucose medium without serum (1 µM CCCP + 100 µM CK666, 3 min; 2.5 µM antimycin A + 100 µM CK666 and 5 µM rotenone + 100 µM CK666, 5 min; hypoxia with 100 µM CK666, 60 min). Images at right are zooms of boxed regions. Scale bars: 5 μm (full cell) and 2 μm (inset). (B) ECAR (± SD) in 25 mM glucose without serum upon 100 µM CK666, 1 µM CCCP or 1 µM CCCP + 100 µM CK666 addition at 45 min, then 50 mM 2-deoxyglucose (2-DG) at 223 min. n = 4 individual well measurements per condition. Pink arrow indicates drug treatment and blue arrow indicates 2-DG treatment. (C) ECAR (± SD) in 25 mM glucose without serum upon DMSO, 2.5 µM antimycin A or 2.5 µM antimycin A + 100 µM CK666 addition at 45 min, then 50 mM 2-DG at 223 min. n = 4 individual well measurements per condition. Pink arrow indicates drug treatment and blue arrow indicates 2-DG treatment. (D) ECAR (± SD) in 25 mM glucose without serum upon DMSO, 5 µM rotenone or 5 µM rotenone + 100 µM CK666 addition at 45 min, then 50 mM 2-DG at 223 min. n = 4 individual well measurements per condition. Pink arrow indicates drug treatment, and blue arrow indicates 2-DG treatment. (E) OCR (± SD) in 2 mM glucose without serum upon 100 µM CK666, 1 µM CCCP or 1 µM CCCP + 100 µM CK666 addition at 45 min, then 50 mM 2-DG at 223 min. n = 4 individual well measurements per condition. Pink arrow indicates drug treatment and blue arrow indicates 2-DG treatment. (F) OCR (± SD) in 2 mM glucose without serum upon DMSO, 2.5 µM antimycin A or 2.5 µM antimycin A + 100 µM CK666 addition at 45 min, then 50 mM 2-DG at 223 min. n = 4 individual well measurements per condition. Pink arrow indicates drug treatment and blue arrow indicates 2-DG treatment. (G) OCR (± SD) in 2 mM glucose without serum upon DMSO, 5 µM rotenone or 5 µM rotenone + 100 µM CK666 addition at 45 min, then 50 mM 2-DG at 223 min. n = 4 individual well measurements per condition. Pink arrow indicates drug treatment and blue arrow indicates 2-DG treatment. Number of experiments and sample sizes are provided in Table S1.
Figure S12.
Figure S12.
Effect of CK666 on hypoxia-induced lactate production in Teff. (A) Lactate production induced by hypoxia (1% oxygen) in Teff in the presence or absence of 100 µM CK666 addition (5 mM glucose without serum). Circles indicate individual well measurements starting with 400,000 cells/well. n = 8 individual well measurements from four independent experiments. *** P = 0.0003; **** P < 0.0001. Statistical significance was calculated by two-way ANOVA using Tukey’s multiple comparisons test. (B) Lactate production induced by hypoxia (1% oxygen) in Teff cells in the presence or absence of 100 µM CK666 addition (25 mM glucose without serum). Circles indicate individual well measurements starting with 400,000 cells/well. n = 8 individual well measurements from four independent experiments. n.s. P > 0.05; * P = 0.0136; **** P < 0.0001. Statistical significance was calculated by two-way ANOVA using Tukey’s multiple comparisons test. Number of experiments, statistical tests, and sample sizes are provided in Table S1.

References

    1. Blanchoin, L., Boujemaa-Paterski R., Sykes C., and Plastino J.. 2014. Actin dynamics, architecture, and mechanics in cell motility. Physiol. Rev. 94:235–263. 10.1152/physrev.00018.2013 - DOI - PubMed
    1. Brand, M.D., and Nicholls D.G.. 2011. Assessing mitochondrial dysfunction in cells. Biochem. J. 435:297–312. 10.1042/BJ20110162 - DOI - PMC - PubMed
    1. Chakrabarti, R., Ji W.K., Stan R.V., de Juan Sanz J., Ryan T.A., and Higgs H.N.. 2018. INF2-mediated actin polymerization at the ER stimulates mitochondrial calcium uptake, inner membrane constriction, and division. J. Cell Biol. 217:251–268. 10.1083/jcb.201709111 - DOI - PMC - PubMed
    1. Chakrabarti, R., Lee M., and Higgs H.N.. 2021. Multiple roles for actin in secretory and endocytic pathways. Curr. Biol. 31:R603–R618. 10.1016/j.cub.2021.03.038 - DOI - PMC - PubMed
    1. Chang, C.H., Curtis J.D., Maggi L.B. Jr., Faubert B., Villarino A.V., O'Sullivan D., Huang S.C., van der Windt G.J., Blagih J., Qiu J., et al. . 2013. Posttranscriptional control of T cell effector function by aerobic glycolysis. Cell. 153:1239–1251. 10.1016/j.cell.2013.05.016 - DOI - PMC - PubMed

Publication types