. 2023 Feb;36(1):65-77.
doi: 10.1007/s10334-022-01041-3. Epub 2022 Sep 14.

A densely interconnected network for deep learning accelerated MRI

Affiliations

A densely interconnected network for deep learning accelerated MRI

Jon André Ottesen et al. MAGMA. 2023 Feb.

Abstract

Objective: To improve accelerated MRI reconstruction through a densely connected cascading deep learning reconstruction framework.

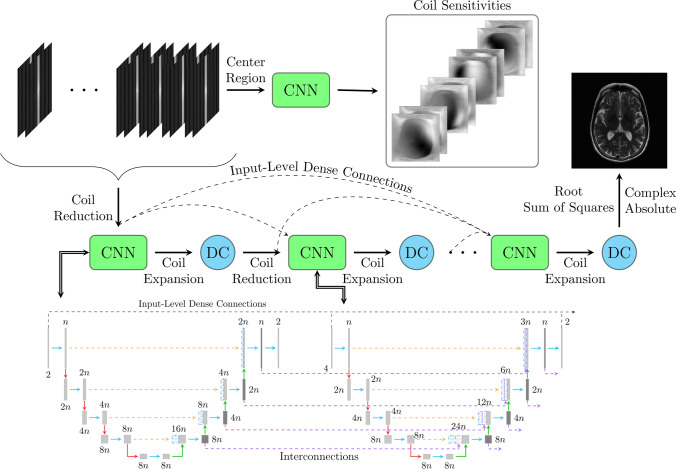
Materials and methods: A cascading deep learning reconstruction framework (reference model) was modified by applying three architectural modifications: input-level dense connections between cascade inputs and outputs, an improved deep learning sub-network, and long-range skip-connections between subsequent deep learning networks. An ablation study was performed, where five model configurations were trained on the NYU fastMRI neuro dataset with an end-to-end scheme conjunct on four- and eightfold acceleration. The trained models were evaluated by comparing their respective structural similarity index measure (SSIM), normalized mean square error (NMSE), and peak signal to noise ratio (PSNR).

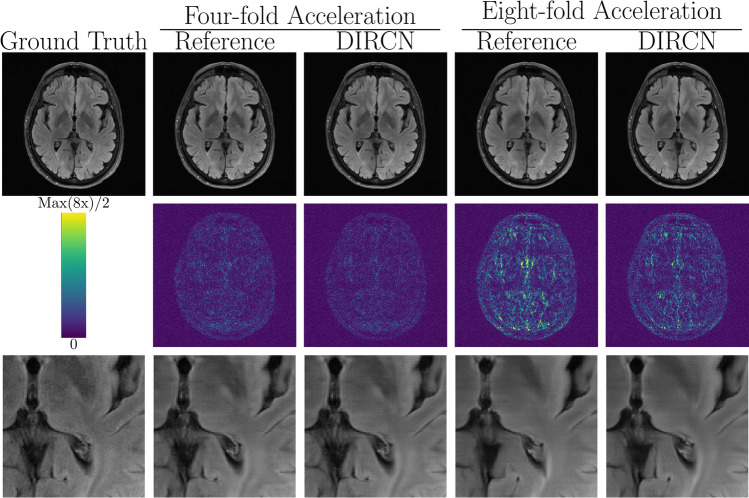
Results: The proposed densely interconnected residual cascading network (DIRCN), utilizing all three suggested modifications achieved a SSIM improvement of 8% and 11%, a NMSE improvement of 14% and 23%, and a PSNR improvement of 2% and 3% for four- and eightfold acceleration, respectively. In an ablation study, the individual architectural modifications all contributed to this improvement for both acceleration factors, by improving the SSIM, NMSE, and PSNR with approximately 2-4%, 4-9%, and 0.5-1%, respectively.

Conclusion: The proposed architectural modifications allow for simple adjustments on an already existing cascading framework to further improve the resulting reconstructions.

Keywords: Deep learning; Image reconstruction; MRI.


Conflict of interest statement

M.W.A. Caan is shareholder of Nico.lab International Ltd.

Figures

Fig. 1
Fig. 1
An illustration of the dense interconnected residual cascading network (DIRCN). The model consists of m cascades of a simplified U-Net-based architecture and data consistency (DC). Each cascade is connected to every prior cascade by input-level dense connections illustrated by the black dashed lines. Every sub-network is connected to the prior sub-network through concatenation, dubbed interconnections and they are illustrated by the purple dashed lines. The output is the root-sum-of-squares image of the data-consistent output from the last cascade
Fig. 2
Fig. 2
The suggested ResXUNet model used for the CNN refinement step. The model includes aggregated residual connections [27] for improved gradient flow, squeeze-and-excitation [29] for learnable channel-wise attention and the SiLU activation function [–32]. The squeeze-and-excitation operation was implemented as the final operation in all residual blocks
Fig. 3
Fig. 3
An illustration of the preprocessing steps for the undersampled k-space and the fully sampled magnitude image. Raw multi-coil k-space data were first Fourier transformed to image space, then quadratically cropped along the height and width dimension for all coils. The ground truth image was the complex absolute and root sum of squares of the complex coil images. For model inputs, the cropped complex coil images were Fourier transformed back to k-space before being masked by either a four- or eightfold downsampling mask
Fig. 4
Fig. 4
Structural similarity index measure (SSIM) distributions for the designated test dataset for the reference model and DIRCN for T1-weighted, T2-weighted, FLAIR, and all images. The distributions show the SSIM for both four- and eightfold acceleration. Note, alle outlier for low SSIM values are emitted for readability, with the outlier definition following regular conventions
Fig. 5
Fig. 5
A representative example of a T1-weighted reconstruction with the reference model and DIRCN for four- and eightfold acceleration. This includes their respective reconstructions and the corresponding error map (absolute difference) between the fully sampled image and the reconstruction. The colormap goes between 0 and half the maximum error for eightfold acceleration to emphasize visual difference. The bottom images are a region of interest where slight improvement between the reference and DIRCN can be seen at close inspection
Fig. 6
Fig. 6
A representative example of a T2-weighted reconstruction with the reference model and DIRCN for four- and eightfold acceleration. This includes their respective reconstructions and the corresponding error map (absolute difference) between the fully sampled image and the reconstruction. The colormap goes between 0 and half the maximum error for eightfold acceleration to emphasize visual difference. The bottom images are a region of interest where differences between the reference model and DIRCN reconstructions for eightfold acceleration can be seen
Fig. 7
Fig. 7
A representative example of a FLAIR reconstruction with the reference model and DIRCN for four- and eightfold acceleration. This includes their respective reconstructions and the corresponding error map (absolute difference) between the fully sampled image and the reconstruction. The colormap goes between 0 and half the maximum error for eightfold acceleration to emphasize visual difference. The bottom images are a region of interest where one can see an erroneous reconstruction for eightfold acceleration for both models
Fig. 8
Fig. 8
Different brain pathologies for four- and eightfold acceleration reconstructed with the DIRCN model. The pathological annotations are credited the fastMRI + initiative [43], and the images were selected at random from the test dataset from the labels selected above
Fig. 9
Fig. 9
The training and validation losses for the reference and DIRCN for 120 iterations. The plotted losses are mean losses for a 5-point sliding window starting at iteration 3 and ending at iteration 117
Fig. 10
Fig. 10
The validation losses for all network configurations for 120 iterations. The plotted losses are mean losses for a 5-point sliding window starting at iteration 3 and ending at iteration 117
Fig. 11
Fig. 11
The logarithm with base 10 of the mean gradients for every learnable parameter per cascade for the first 20 iterations. A contour plot of the absolute difference between the logarithm of the mean gradients between the networks is embedded into the 3D visualization with the corresponding colorbar. Mean gradient values were 10-6 for the DIRCN, whereas the reference model had mean absolute gradient values ranging 10-6-10-9 depending on the cascade

References

    1. Griswold MA, Jakob PM, Heidemann RM, Nittka M, Jellus V, Wang J, Kiefer B, Haase A. Generalized autocalibrating partially parallel acquisitions (GRAPPA) Magn Reson Med. 2002;47:1202–1210. doi: 10.1002/mrm.10171. - DOI - PubMed
    1. Pruessmann KP, Weiger M, Scheidegger MB, Boesiger P (1999) SENSE: Sensitivity encoding for fast MRI. Magn Reson Med 42:952–962. 10.1002/(SICI)1522-2594(199911)42:5 - PubMed
    1. Sodickson DK, Manning WJ. Simultaneous acquisition of spatial harmonics (SMASH): fast imaging with radiofrequency coil arrays. Magn Reson Med. 1997;38:591–603. doi: 10.1002/mrm.1910380414. - DOI - PubMed
    1. Lustig M, Donoho D, Pauly JM. Sparse MRI: the application of compressed sensing for rapid MR imaging. Magn Reson Med. 2007;58:1182–1195. doi: 10.1002/mrm.21391. - DOI - PubMed
    1. Jaspan ON, Fleysher R, Lipton ML. Compressed sensing MRI: a review of the clinical literature. Br J Radiol. 2015 doi: 10.1259/BJR.20150487. - DOI - PMC - PubMed

LinkOut - more resources