. 2022 Sep;11(9):e12263.
doi: 10.1002/jev2.12263.

Microscopic and biochemical monitoring of endosomal trafficking and extracellular vesicle secretion in an endogenous in vivo model

Affiliations

Microscopic and biochemical monitoring of endosomal trafficking and extracellular vesicle secretion in an endogenous in vivo model

Karen Linnemannstöns et al. J Extracell Vesicles. 2022 Sep.

Abstract

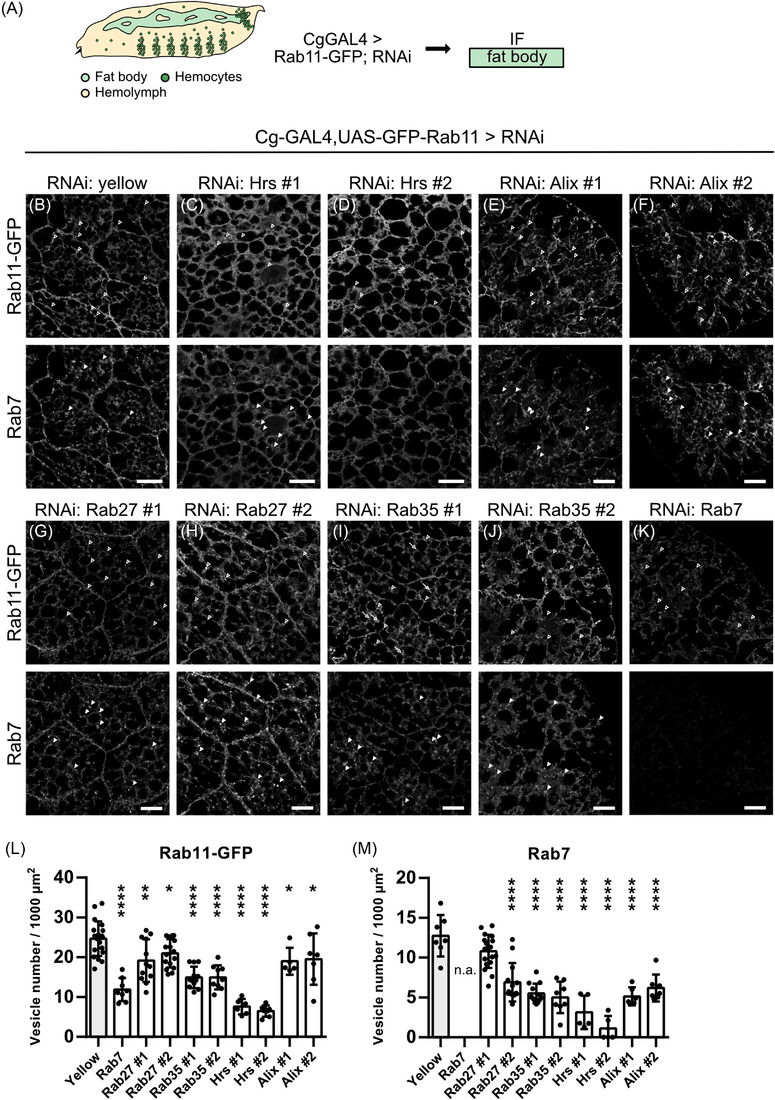
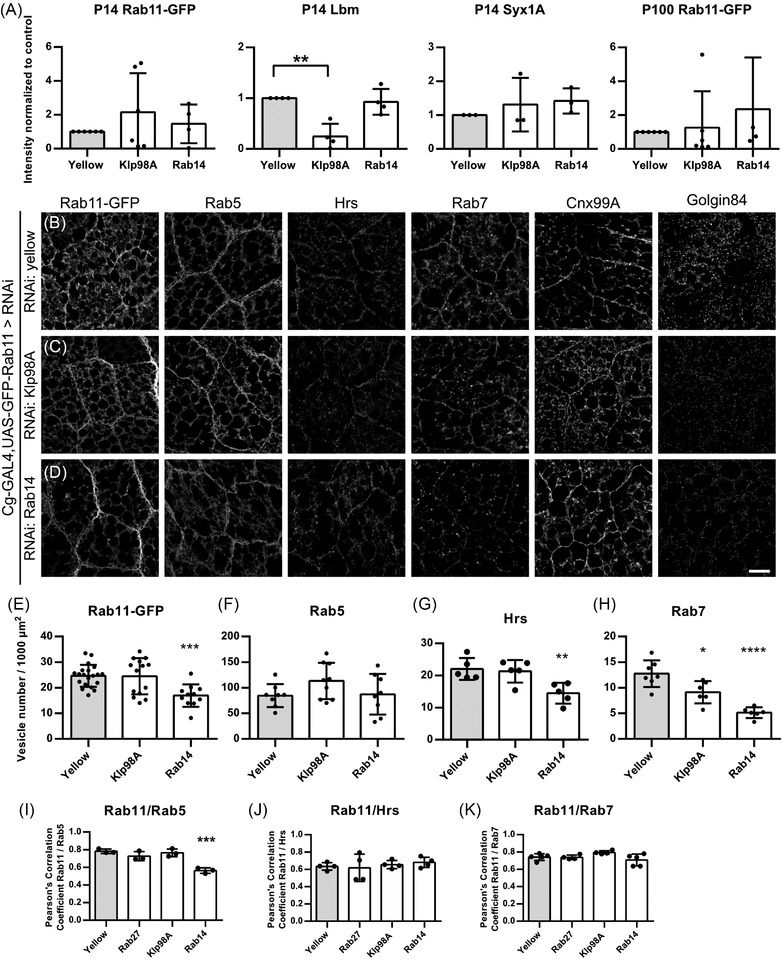
Extracellular vesicle (EV) secretion enables cell-cell communication in multicellular organisms. During development, EV secretion and the specific loading of signalling factors in EVs contributes to organ development and tissue differentiation. Here, we present an in vivo model to study EV secretion using the fat body and the haemolymph of the fruit fly, Drosophila melanogaster. The system makes use of tissue-specific EV labelling and is amenable to genetic modification by RNAi. This allows the unique combination of microscopic visualisation of EVs in different organs and quantitative biochemical purification to study how EVs are generated within the cells and which factors regulate their secretion in vivo. Characterisation of the system revealed that secretion of EVs from the fat body is mainly regulated by Rab11 and Rab35, highlighting the importance of recycling Rab GTPase family members for EV secretion. We furthermore discovered a so far unknown function of Rab14 along with the kinesin Klp98A in EV biogenesis and secretion.

Keywords: Drosophila; Rab11; Rab35; Tsp96F; exosomes; fat body; haemolymph; intercellular communication.


Conflict of interest statement

The authors have no competing financial interests.

Figures

FIGURE 1
FIGURE 1
Purification and characterisation of EVs from D. melanogaster haemolymph. (A) Overview of the Drosophila life cycle. The third instar larval stage relevant for the following results is indicated. (B) Scheme of EV purification from L3 larval haemolymph by differential centrifugation. The P14 and P100 pellets representing large and small EVs were used for further studies. (C) Protein content of P14 and P100 is represented for five independent samples. (D) Total particle concentration per μl of resuspended P14 and P100 pellets as determined by Nanoparticle Tracking Analysis (NTA) from three independent samples. Three videos were recorded per sample and each point corresponds to one video. The line represents the mean. Size distribution of P14 and P100 were studied by electron microscopy (EM) (E–F) and NTA (G–I). (E) Representative EM image of P14 and P100 pellets. Exosome‐like vesicles with characteristic cup‐shape were discovered in both fractions. Scale bars represent 500 nm. (F) Size distribution of P14 and P100 as determined by EM of three independent samples. (G) Mean size of P14 and P100 as determined by NTA from three independent samples. Three videos were recorded per sample and each point corresponds to one video. The line represents the mean. (H) Size distribution of P14 as determined by NTA from three videos of three independent samples. (I) Size distribution of P100 as determined by NTA from three videos of three independent samples. Data are mean ± SD
FIGURE 2
FIGURE 2
Analysis of the haemolymph EV proteome. (A) EVs were isolated from wildtype L3 larval haemolymph of three independent replicates by differential centrifugation. The composition of the resulting 14,000 g (P14) and 100,000 g (P100) pellets and remaining supernatant (SN100) was analysed by label‐free data independent acquisition mass spectrometry (DIA‐MS). (B and C) Volcano plots of all 2466 proteins quantified by DIA‐MS. Significance of enrichment was established using FDR‐based calculation with p ≤ 0.05 and S0 = 0.5, resulting in an at least 2‐fold enrichment as a requirement for significance. Proteins significantly enriched appear in blue (P14) (B) or green (P100) (C). Data points are annotated by gene name. (D and E) Enriched GO cellular components of P14 (D) and P100 (E) with a p‐value < 0.05 as determined by Fisher Exact Test with the Benjamini–Hochberg False Discovery Rate < 0.05. (F) Overlap of P14 and P100 with Drosophila orthologues of Top100 EV markers and FunRich identified markers for Drosophila. The Top100 EV markers were retrieved from EVpedia and ExoCarta and the corresponding Drosophila orthologues identified with DIOPT. FunRich database provides another Drosophila EV marker dataset based on Vesiclepedia. (G) Common proteins (annotated by gene name) identified in EVs and their closest human orthologues. Proteins found in P14 only are indicated in blue. Proteins found in P100 are indicated in green
FIGURE 3
FIGURE 3
Identification and characterisation of novel Drosophila EV markers. (A) EVs were isolated from wildtype L3 larval haemolymph by differential centrifugation and the resulting pellets analysed by immunoblot for previously published markers as indicated. (B–F) Overexpression of different tagged EV markers. (B) Transgenes encoding tagged EV markers were expressed with Collagen IV‐GAL4 (Cg‐GAL4), which is active on both the fat body and haemocytes. Haemolymph EVs were isolated from the corresponding progeny and analysed for both endogenous and overexpressed EV markers. (C) Overexpression of mouse UAS‐CD63‐pHluorin using CgGAL4. CD63‐pHluorin could be detected in the P0.75 and P14 of respective haemolymph EVs. (D) Close up of a phylogenetic tree of human CD9, CD63 and CD81 against all 36 Drosophila tetraspanin sequences. The full tree can be found in the Supplementary Material. (E) Overexpression of UAS‐mCherry‐Tsp96F using CgGAL4. mCherry‐Tsp96F could be detected in the P0.75 and P14 of respective haemolymph EVs. (F) CgGAL4 > UAS‐mCherry‐Tsp96F derived P14 EVs were treated with proteinase K in the presence or absence of TritonX‐100. The internal N‐terminal tag is protected and the extracellular part of Tsp96F is digested by proteinase K alone (lane 2). In the presence of detergent, the whole protein is degraded (lane 4) (G) CgGAL4, GFP‐Rab11 derived haemolymph was diluted with increasing amounts of wildtype haemolymph prior to EV isolation. (H) Quantification of (G). The dotted black line represents the haemolymph ratio. The solid‐colored lines represent the Rab11‐GFP signal normalised to endogenous controls as indicated. Data are mean ± SD. All immunoblots depicted are representative blots for at least three independent experiments
FIGURE 4
FIGURE 4
Novel EV markers localise to distinct compartments in fat body cells. (A) Transgenes encoding tagged EV markers were expressed with Collagen IV‐GAL4 (Cg‐GAL4), which is active in both the fat body and haemocytes. Fat bodies were dissected from the corresponding progeny and analysed for both endogenous and overexpressed EV markers by immunofluorescence. (B) Overview of the fat body composed of flat polygonal adipocytes visualised by expression of cytoplasmic eGFP and co‐staining with Phalloidin to label F‐actin. (C) Co‐expression of eGFP and Tsp96F‐mCherry. Tsp96F localises to large vacuolar structures containing a lumen. Lipid droplets appear as GFP‐negative holes. (D) Magnified view of the boxed region in (C). The filled arrows point at the membrane of Tsp96F labelled vacuoles, the filled arrow heads point at internal puncta, the empty arrow heads point at intraluminal vesicles, the asterisks label lipid droplets. (E‐G) mCherry‐Tsp96F was expressed and co‐stained with endogenous endosomal markers Rab5 (E), Hrs (F), Rab7 (G). (H) The tetraspanin Lbm labels a subset of Tsp96F‐mCherry positive structures. (I) Magnified view of the boxed region in (H). mCherry‐Tsp96F co‐localises to the same compartment with eGFP‐Lamp1 (J) and CD63‐pHluorin (K). (L) Magnified view of the boxed region in (K). (M–P) Rab11‐GFP was expressed alone (M) and co‐stained with endogenous endosomal markers Rab5 (N), Hrs (O), Rab7 (P). (Q) Endogenous Myc‐YFP‐Rab11 reflects the localisation of overexpressed Rab11‐GFP in (M‐P). (R) Co‐expression of Rab11‐GFP and mCherry‐Tsp96F. Rab11‐GFP and Tsp96F‐mCherry mark different compartments. (S) Magnified view of the boxed region in (R). All images show representative confocal images. Scale bar represents 50 μm in (B) and 10 μm in all other images
FIGURE 5
FIGURE 5
Fat‐body mediated knockdown of ESCRT and RAB components can alter the amount of EVs secreted in the haemolymph. (A) Tagged EV markers were co‐expressed with RNAi using Cg‐GAL4. EVs were isolated from the corresponding L3 larval haemolymph and the resulting P14 and P100 pellets analysed by immunoblot. (B) Representative immunoblot probing for Rab11‐GFP and endogenous Syx1A and Lbm. RNAi against yellow was used as control. The intensity of the endogenous markers in P100 was too low to be quantified. (C) List of all knockdown candidates. (D) Quantification of Rab11‐GFP, Lbm and Syx1A signal intensity upon knockdown of ESCRT components Hrs, Tsg101, Shrb and Alix. One‐way ANOVA: *p = 0.00238. (E) Quantification of Rab11‐GFP, Lbm and Syx1A signal intensity upon knockdown of Rab7, Rab27 and Rab35. One‐way ANOVA: *p = 0.0451. (F) Quantification of Tsp96F‐mCherry, Lbm and Syx1A signal intensity upon knockdown of Rab11. Student's unpaired two‐tailed t‐test: **p = 0.0048 (P14 Tsp96F), **p = 0.0058 (P14 Lbm), *p = 0.0192, ****p < 0.0001. All quantifications were performed on at least three independent experiments. Data are mean ± SD
FIGURE 6
FIGURE 6
ESCRT and RAB knockdown regulates EV trafficking in fat body cells. (A) Rab11‐GFP was co‐expressed with RNAi using Cg‐GAL4. Fat bodies were dissected from the corresponding progeny and analysed by immunofluorescence. (B) RNAi against yellow is used as control. Fat bodies expressing RNAi against Hrs (C, D), Alix (E, F), Rab27 (G, H), Rab35 (I and J) and Rab7 (K) were stained for Rab11‐GFP (upper panel) and endogenous Rab7 (lower panel). Empty arrowheads in (B, upper panel) point at Rab11‐GFP positive puncta. Arrowheads in (B, lower panel) point at Rab7‐positive ring‐like structures. Arrows in (I, J) point at Rab11‐GFP mislocalising to Rab7‐positive ring‐like structures (L) Quantification of number of Rab11‐GFP positive vesicles (upper panel in B‐K). One‐way ANOVA: ****p < 0.0001, **p = 0.0017 (Rab27 #1), *p = 0.0424 (Rab27 #2), *p = 0.0318 (Alix #1), *p = 0.0256 (Alix #2). (M) Quantification of number of Rab7 positive vesicles (lower panel in B‐K). One‐way ANOVA: ****p < 0.0001. Data are mean ± SD. All images show representative confocal images and maximum intensity projection of two sections (distance 1 μm) are depicted for visualisation. Scale bar 20 μm
FIGURE 7
FIGURE 7
Fat‐body mediated knockdown of Klp98A/Rab14 affects EV secretion in the haemolymph. (A) Quantification of Rab11‐GFP, Lbm and Syx1A signal intensity upon knock down of Klp98A and Rab14. Quantifications were performed on at least three independent experiments. Data are mean ± SD. One‐way ANOVA: **p = 0.0011. (B‐D) Rab11‐GFP was co‐expressed with RNAi using Cg‐GAL4. Fat bodies were dissected from the corresponding progeny and analysed by immunofluorescence. RNAi against yellow was used as control. Fat bodies expressing RNAi against yellow (B), Klp98A (C) and Rab14 (D) were stained for Rab11‐GFP as well as endogenous Rab5, Hrs, Rab7, Cnx99A and Golgin as indicated. (E) Quantification of number of Rab11‐GFP positive vesicles in (B–D). One‐way ANOVA: ***p = 0.0008. (F) Quantification of number of Rab5‐positive vesicles in (B–D). (G) Quantification of number of Hrs‐positive vesicles in (B–D). One‐way ANOVA: **p = 0.0078. (H) Quantification of number of Rab7 positive vesicles in (B–D). One‐way ANOVA: *p = 0.0124, ****p < 0.0001. (I) Pearson's correlation coefficient of Rab11‐GFP/Rab5 is decreased upon Rab14 knockdown. One‐way ANOVA: ***p = 0.0004. Pearson's correlation coefficient of Rab11‐GFP/Hrs (J) and Rab11‐GFP/Rab7 (K) is not affected by the knockdown conditions tested. Data are mean ± SD. All images show representative confocal images and maximum intensity projection of two sections (distance 1 μm) are depicted for visualisation. Scale bar 20 μm

Similar articles

Cited by

References

    1. Acharya, U. , & Acharya, J. K. (2005). Enzymes of sphingolipid metabolism in Drosophila melanogaster . Cellular and Molecular Life Sciences, 62, 128–142. 10.1007/s00018-004-4254-1 - DOI - PMC - PubMed
    1. Arrese, E. L. , & Soulages, J. L. (2010). Insect fat body: Energy, metabolism, and regulation. Annual Review of Entomology, 55, 207–225. 10.1146/annurev-ento-112408-085356 - DOI - PMC - PubMed
    1. Asha, H. , Nagy, I. , Kovacs, G. , Stetson, D. , Ando, I. , & Dearolf, C. R. (2003). Analysis of Ras‐induced overproliferation in Drosophila hemocytes. Genetics, 163, 203–215. - PMC - PubMed
    1. Ashley, J. , Cordy, B. , Lucia, D. , Fradkin, L. G. , Budnik, V. , & Thomson, T. (2018). Retrovirus‐like Gag protein Arc1 binds RNA and traffics across synaptic boutons. Cell, 172, 262–270.e11. 10.1016/j.cell.2017.12.022 - DOI - PMC - PubMed
    1. Atanassov, I. , & Urlaub, H. (2013). Increased proteome coverage by combining PAGE and peptide isoelectric focusing: Comparative study of gel‐based separation approaches. Proteomics, 13, 2947–2955. 10.1002/pmic.201300035 - DOI - PMC - PubMed

Publication types