

doi: 10.1002/ctm2.1054.
Loss of Sirtuin 1 (SIRT1) potentiates endothelial dysfunction via impaired glycolysis during infectious challenge
Affiliations
- PMID: 36103428
- PMCID: PMC9473483
- DOI: 10.1002/ctm2.1054
Item in Clipboard
Loss of Sirtuin 1 (SIRT1) potentiates endothelial dysfunction via impaired glycolysis during infectious challenge
Clin Transl Med.
2022 Sep.
No abstract available
Conflict of interest statement
None declared.
Figures

(A) SIRT1 mRNA relative values on day 0 (<24 h) of hospitalisation are shown for children (top, ≤10 years of age) or adult (bottom, >18 years of age) patients with or without sepsis from the respective GEO Datasets (GSE26378, children and GSE134364, adults). The median expression value is shown with a horizontal bar per condition with 75% interquartile range normalised to the respective controls (children: controls n = 21, sepsis n = 79; adults: controls n = 83, sepsis n = 156). (B) qRT‐PCR values of SIRT1 mRNA normalised to GAPDH control (top, n = 4 individual replicates) or SIRT1 protein expression with associated western blots normalised to tubulin (bottom, n = 6 individual replicates) either with vehicle or LPS treatment (100 ng/ml) for 6 or 24 h in HMVECs. (C) Top: Transendothelial electrical resistance (TEER) of HMVECs treated with scrambled siRNA (siControl) or siRNA to SIRT1 for 72 h prior to LPS exposure of 100 ng/ml and subsequently followed for 24 h. Data are normalised to baseline prior to LPS exposure. Open circles represent HMVECs exposed to siControl for 72 h without LPS (vehicle). Bottom: Area under the curve (AUC) relative to change from baseline is shown for the TEER. †p < .05 between indicated group and control. *p < .05 between designated groups. n = 4–6 individual replicates per group. (D) Top: TEER of HMVECs pretreated with 0.1 μM EX527 30 min prior to LPS compared to vehicle control. All data are normalised to baseline resistance per condition prior to addition of EX527. Bottom: AUC relative to change from baseline resistance over time calculated for all conditions following EX527 or vehicle addition out to 24 h. †p < .05 between indicated group and control. *p < .05 between designated groups. n = 3 individual replicates per group. (E) Relaxation of isolated murine mesenteric arteries to escalating doses of acetylcholine (ACh, top) or sodium nitroprusside (SNP, bottom) treated with control (DMSO, n = 8), EX527 (0.1 μM, n = 8), LPS (100 ng/ml, n = 7) or EX527 with LPS (n = 8) for 24 h prior to myography assessments. †p < .05 between LPS and EX527 + LPS at the respective dose. #p < .05 for EC50 between LPS and EX527 + LPS. ‡p < .05 for EC50 between EX527 and EX527 + LPS

(A) eNOS, FOXO1 and TFAM mRNA transcript relative values are shown for children with or without sepsis from the respective GEO Dataset (GSE26378). The median expression value is shown with a horizontal bar per condition with 75% interquartile range normalised to the respective cohort controls. (B) Expression values for eNOS, FOXO1 or TFAM in comparison to individually matched SIRT1 transcript values for control patients or patients with sepsis. Associated coefficients of determination (R
2) are shown with Spearman r correlation coefficient p values. Linear regression (solid lines) with 95% CI (dotted lines) are displayed. *p < .05 between indicated group and control cohort. NS = non‐significant. (C) Densitometry analysis and associated images of whole cell lysate western blots (n = 6 individual replicates per group) calculated for SIRT1, eNOS, FOXO1 or TFAM expression relative to tubulin. HMVECs were treated with respective siRNA for 72 h prior to LPS exposure (100 ng/ml) at the times indicated. (D) Proximity ligation assay (PLA) counts normalised to cell number for SIRT1 interactions with eNOS, FOXO1 and TFAM with or without LPS exposure for 6 h. Associated representative confocal images (40×, line bar represents a distance of 50 μm) are shown for SIRT1‐eNOS (cyan), SIRT1‐FOXO1 (purple) and SIRT1‐TFAM (red) PLA reactions. n = 5 individual replicates per group. *p < .05 between designated groups. †p < .05 between indicated group and respective siRNA control. NS = non‐significant

(A) Seahorse XFe96 assays for oxygen consumption rate (OCR, left) or extracellular acidification rate (ECAR, right) using Control and SIRT1 siRNA treated HMVECs with 6 h of LPS exposure (100 ng/ml) prior to assays. (B) Respective components of OCR via calculation as follows: ‘Basal OCR’ = pre Oligomycin – post Antimycin/Rotenone, ‘ATP‐linked’ = pre Oligomycin – post Oligomycin, ‘Max Respiration’ = post FCCP – post Antimycin/Rotenone, ‘Reserve OCR’ = post FCCP – pre FCCP. (C) Respective ECAR components with calculations as follows: ‘Basal ECAR’ = pre Glucose – post 2‐deoxyglucose (2‐DG), ‘Glycolysis’ = post Glucose – pre Glucose, ‘Max Glycolysis’ = post Oligomycin – post 2‐DG, ‘Reserve ECAR’ = post Oligomycin – pre Oligomycin. n = 11‐12 individual replicates per group. (D) Seahorse XFe96 assays for oxygen consumption rate (OCR, left) or extracellular acidification rate (ECAR, right) using Control and SIRT1 siRNA treated HMVECs with 24 h of LPS exposure or condition media prior to assays. Components of OCR (E) or ECAR (F) for respective siRNA ECs treated with or without 24 h of LPS exposure. *p < .05 between designated groups. †p < .05 between indicated group and respective siRNA control
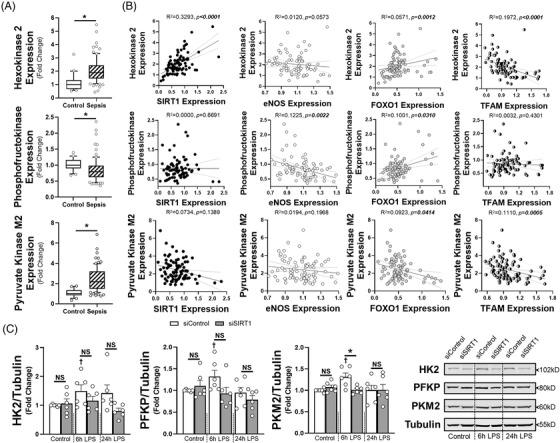
(A) Hexokinase 2 (HK2), phosphofructokinase (platelet, PFKP) or pyruvate kinase M2 (PKM2) mRNA transcript relative values are shown for children with or without sepsis from the respective GEO Dataset (GSE26378). The median expression value is shown with a horizontal bar per condition with 75% interquartile range normalised to the respective cohort controls. (B) Expression values for HK2, PFKP or PKM2 in relation to individually matched transcript levels for SIRT1, eNOS, FOXO1 or TFAM for patients with sepsis. Associated coefficients of determination (R
2) are shown with Spearman r correlation coefficient p values. Linear regression (solid lines) with 95% CI (dotted lines) are displayed. *p < .05 between indicated group and control cohort. NS = non‐significant. (C) Densitometry analysis (left) and associated images (right) of whole cell lysate western blots (n = 6 individual replicates per group) calculated for HK2, PFKP or PKM2 expression relative to tubulin. HMVECs were treated with respective siRNA for 72 h prior to LPS exposure (100 ng/ml) at the times indicated. *p < .05 between designated groups. †p < .05 between indicated group and respective siRNA control. NS = non‐significant
Similar articles
-
Endothelial SIRT1 as a Target for the Prevention of Arterial Aging: Promises and Challenges.J Cardiovasc Pharmacol. 2021 Dec 1;78(Suppl 6):S63-S77. doi: 10.1097/FJC.0000000000001154. J Cardiovasc Pharmacol. 2021. PMID: 34840264 Review.
-
Sirtuin 1 ablation in endothelial cells is associated with impaired angiogenesis and diastolic dysfunction.Am J Physiol Heart Circ Physiol. 2014 Dec 15;307(12):H1691-704. doi: 10.1152/ajpheart.00281.2014. Epub 2014 Sep 19. Am J Physiol Heart Circ Physiol. 2014. PMID: 25239805 Free PMC article.
-
Childhood psychosocial stress is linked with impaired vascular endothelial function, lower SIRT1, and oxidative stress in young adulthood.Am J Physiol Heart Circ Physiol. 2021 Sep 1;321(3):H532-H541. doi: 10.1152/ajpheart.00123.2021. Epub 2021 Jul 30. Am J Physiol Heart Circ Physiol. 2021. PMID: 34328346 Free PMC article.
-
Knockdown of circ0082374 inhibits cell viability, migration, invasion and glycolysis in glioma cells by miR-326/SIRT1.Brain Res. 2020 Dec 1;1748:147108. doi: 10.1016/j.brainres.2020.147108. Epub 2020 Sep 4. Brain Res. 2020. PMID: 32896523
-
Sirtuin 1 and Alzheimer's disease: An up-to-date review.Neuropeptides. 2018 Oct;71:54-60. doi: 10.1016/j.npep.2018.07.001. Epub 2018 Jul 9. Neuropeptides. 2018. PMID: 30007474 Review.
Cited by
-
Impact of FASN-enriched EVs on endothelial cell function in obstructive sleep apnea hypopnea syndrome.J Pharm Anal. 2025 May;15(5):101251. doi: 10.1016/j.jpha.2025.101251. Epub 2025 Mar 1. J Pharm Anal. 2025. PMID: 40521370 Free PMC article.
-
Research progress in the regulatory mechanism of silent information regulator 1 in sepsis (Review).Mol Med Rep. 2025 Aug;32(2):208. doi: 10.3892/mmr.2025.13573. Epub 2025 May 26. Mol Med Rep. 2025. PMID: 40417877 Free PMC article. Review.
-
Protein-mediated interactions in the dynamic regulation of acute inflammation.Biocell. 2023;47(6):1191-1198. doi: 10.32604/biocell.2023.027838. Epub 2023 May 19. Biocell. 2023. PMID: 37261220 Free PMC article.
References
-
- Shankar‐Hari M, Harrison DA, Rubenfeld GD, Rowan K. Epidemiology of sepsis and septic shock in critical care units: comparison between sepsis‐2 and sepsis‐3 populations using a national critical care database. Br J Anaesth. 2017;119:626‐636. - PubMed
-
- Wang X, Zhang Q, Yan Y, Yang Y, Shang X, Li Y. Clinical Significance of pro‐inflammatory cytokines and their correlation with disease severity and blood coagulation in septic patients with bacterial co‐infection. Shock. 2021;56:396‐402. - PubMed
Publication types
MeSH terms
Substances
Grants and funding
LinkOut - more resources
Full Text Sources
Medical