

Functional Data Analysis for Predicting Pediatric Failure to Complete Ten Brief Exercise Bouts
- PMID: 36103443
- PMCID: PMC10011010
- DOI: 10.1109/JBHI.2022.3206100
Functional Data Analysis for Predicting Pediatric Failure to Complete Ten Brief Exercise Bouts
Abstract
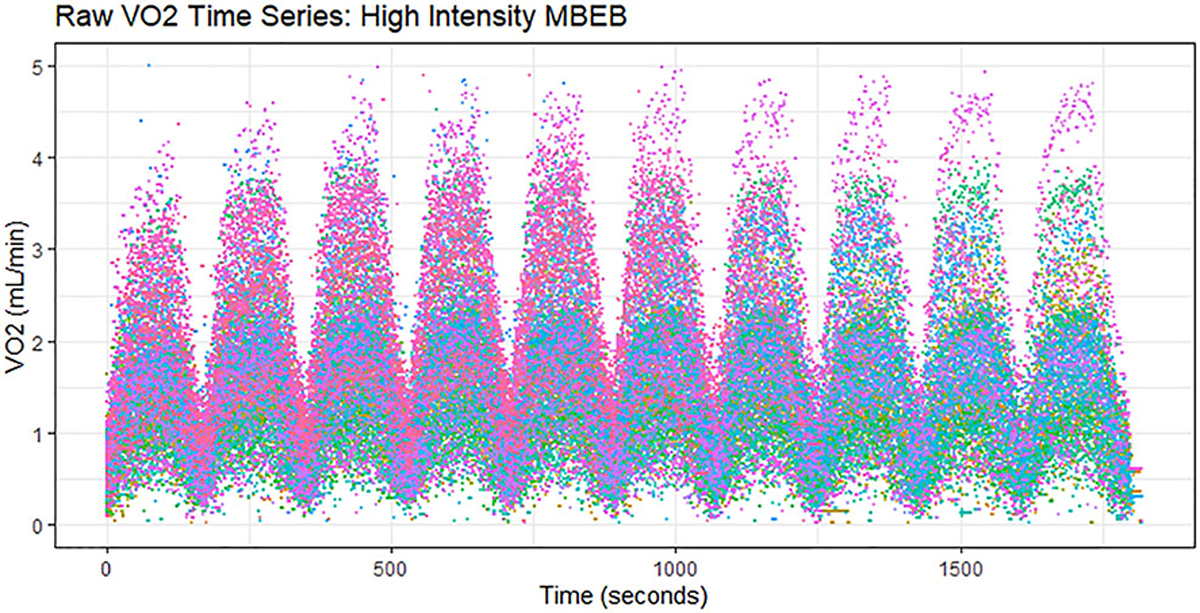
Physiological response to physical exercise through analysis of cardiopulmonary measurements has been shown to be predictive of a variety of diseases. Nonetheless, the clinical use of exercise testing remains limited because interpretation of test results requires experience and specialized training. Additionally, until this work no methods have identified which dynamic gas exchange or heart rate responses influence an individual's decision to start or stop physical activity. This research examines the use of advanced machine learning methods to predict completion of a test consisting of multiple exercise bouts by a group of healthy children and adolescents. All participants could complete the ten bouts at low or moderate-intensity work rates, however, when the bout work rates were high-intensity, 50% refused to begin the subsequent exercise bout before all ten bouts had been completed (task failure). We explored machine learning strategies to model the relationship between the physiological time series, the participant's anthropometric variables, and the binary outcome variable indicating whether the participant completed the test. The best performing model, a generalized spectral additive model with functional and scalar covariates, achieved 93.6% classification accuracy and an F1 score of 93.5%. Additionally, functional analysis of variance testing showed that participants in the 'failed' and 'success' groups have significantly different functional means in three signals: heart rate, oxygen uptake rate, and carbon dioxide uptake rate. Overall, these results show the capability of functional data analysis with generalized spectral additive models to identify key differences in the exercise-induced responses of participants in multiple bout exercise testing.
Figures


Similar articles
-
Heart rate and gas exchange dynamic responses to multiple brief exercise bouts (MBEB) in early- and late-pubertal boys and girls.Physiol Rep. 2022 Aug;10(15):e15397. doi: 10.14814/phy2.15397. Physiol Rep. 2022. PMID: 35923083 Free PMC article.
-
Training effects of long versus short bouts of exercise in healthy subjects.Am J Cardiol. 1990 Apr 15;65(15):1010-3. doi: 10.1016/0002-9149(90)91005-q. Am J Cardiol. 1990. PMID: 2327335
-
Effects of prior arm exercise on pulmonary gas exchange kinetics during high-intensity leg exercise in humans.Exp Physiol. 1998 Jul;83(4):557-70. doi: 10.1113/expphysiol.1998.sp004138. Exp Physiol. 1998. PMID: 9717077
-
The Effects of Hyperoxia on Sea-Level Exercise Performance, Training, and Recovery: A Meta-Analysis.Sports Med. 2018 Jan;48(1):153-175. doi: 10.1007/s40279-017-0791-2. Sports Med. 2018. PMID: 28975517 Review.
-
Measurement of the maximum oxygen uptake V̇o2max: V̇o2peak is no longer acceptable.J Appl Physiol (1985). 2017 Apr 1;122(4):997-1002. doi: 10.1152/japplphysiol.01063.2016. Epub 2017 Feb 2. J Appl Physiol (1985). 2017. PMID: 28153947 Review.
Cited by
-
Universal representation learning for multivariate time series using the instance-level and cluster-level supervised contrastive learning.Data Min Knowl Discov. 2024 May;38(3):1493-1519. doi: 10.1007/s10618-024-01006-1. Epub 2024 Feb 9. Data Min Knowl Discov. 2024. PMID: 39949582 Free PMC article.
References
-
- Gilliam TB, Freedson PS, Geenen DL, and Shahraray B, “Physical activity patterns determined by heart rate monitoring in 6–7 year-old children,” Med. Sci. Sports Exercise, vol. 13, no. 1, pp. 65–67, 1981. - PubMed
-
- Bailey RC, Olson J, Pepper SL, Porszasz J, Barstow TJ, and Cooper DM, “The level and tempo of children’s physical activities: An observational study,” Med. Sci. Sports Exercise, vol. 27, no. 7, pp. 1033–1041, 1995. - PubMed
-
- Armstrong N, “Youth aerobic fitness,” Pediatr. Exercise Sci, vol. 31, no. 2, pp. 137–143, 2019. - PubMed
-
- Bartels MN and Prince DZ, “27 - Acute medical conditions: Cardiopulmonary disease, medical frailty, and renal failure,” in Braddom’s Physical Medicine and Rehabilitation. Amsterdam, Netherlands: Elsevier, 2021, pp. 511–534.e5.
