. 2022 Sep 14;14(662):eabq1945.
doi: 10.1126/scitranslmed.abq1945. Epub 2022 Sep 14.

Dual spike and nucleocapsid mRNA vaccination confer protection against SARS-CoV-2 Omicron and Delta variants in preclinical models

Affiliations

Dual spike and nucleocapsid mRNA vaccination confer protection against SARS-CoV-2 Omicron and Delta variants in preclinical models

Renee L Hajnik et al. Sci Transl Med. .

Abstract

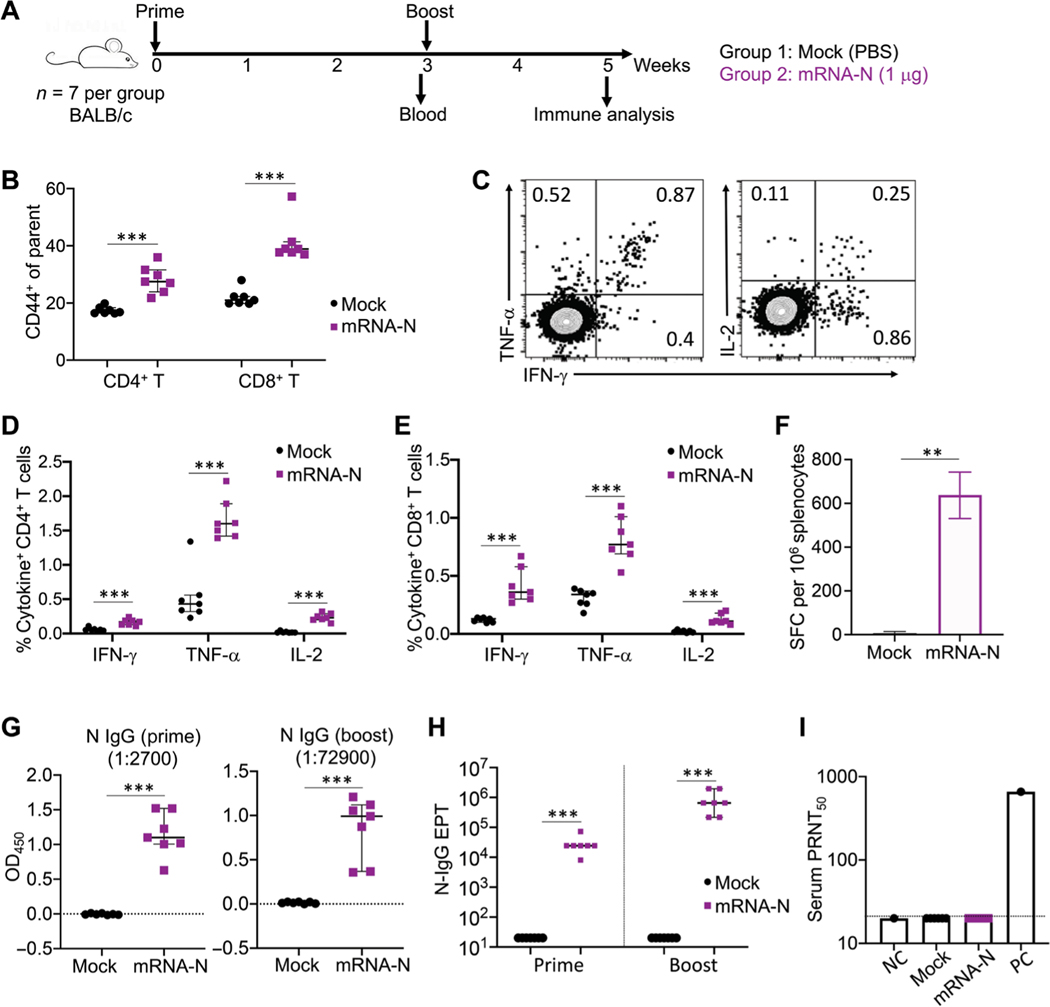
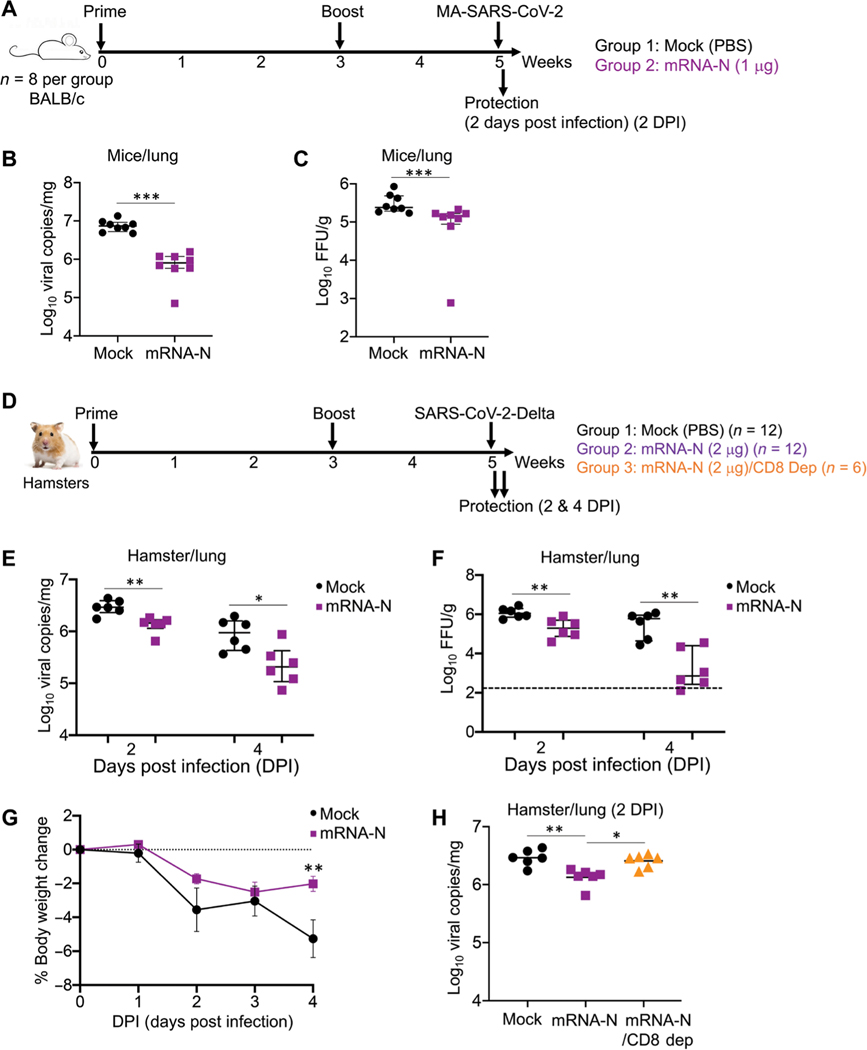
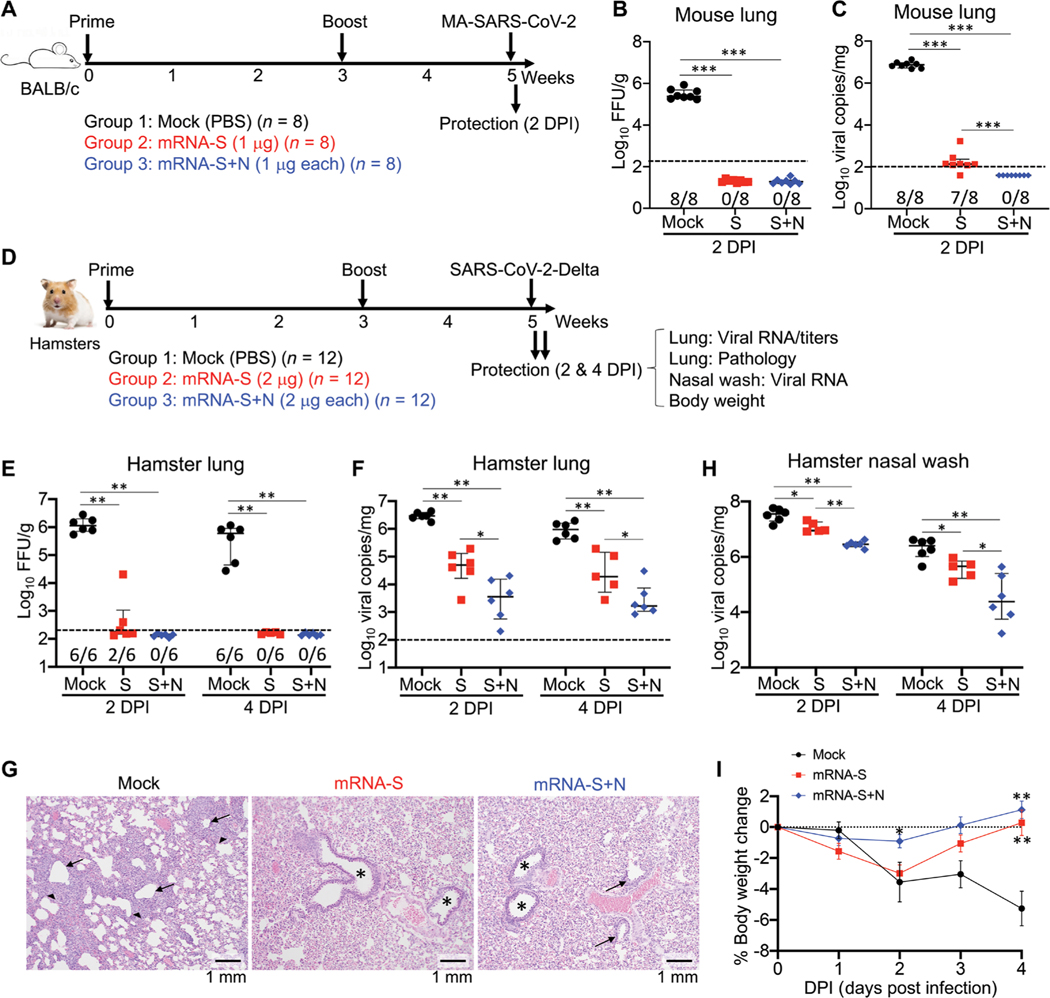
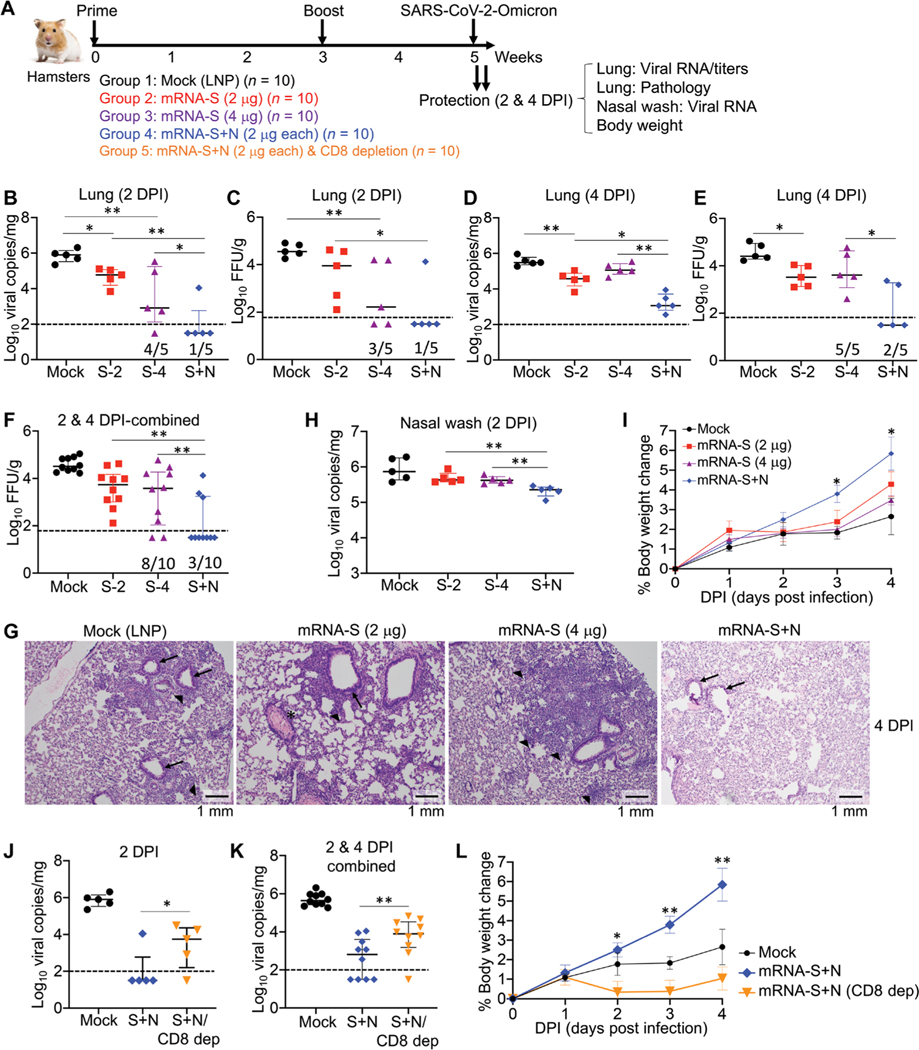
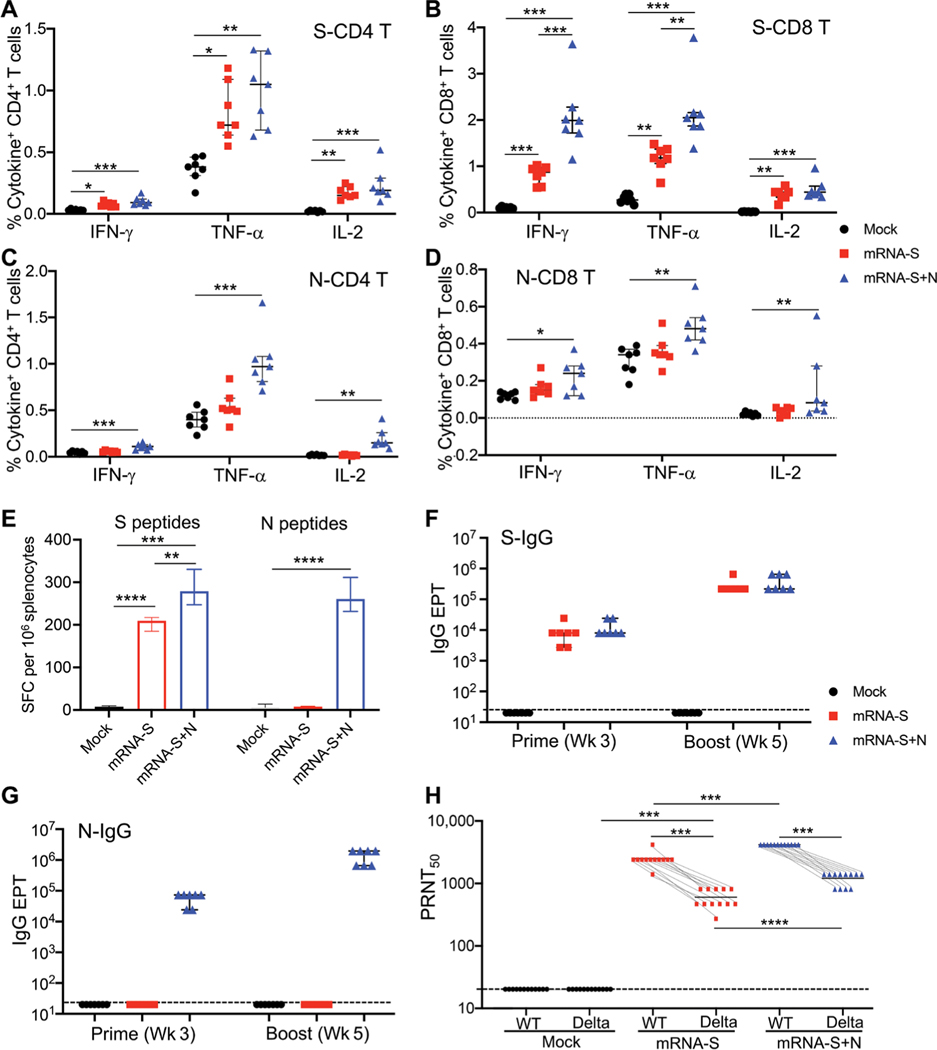
Emergence of SARS-CoV-2 variants of concern (VOCs), including the highly transmissible Omicron and Delta strains, has posed constant challenges to the current COVID-19 vaccines that principally target the viral spike protein (S). Here, we report a nucleoside-modified messenger RNA (mRNA) vaccine that expresses the more conserved viral nucleoprotein (mRNA-N) and show that mRNA-N vaccination alone can induce modest control of SARS-CoV-2. Critically, combining mRNA-N with the clinically proven S-expressing mRNA vaccine (mRNA-S+N) induced robust protection against both Delta and Omicron variants. In the hamster models of SARS-CoV-2 VOC challenge, we demonstrated that, compared to mRNA-S alone, combination mRNA-S+N vaccination not only induced more robust control of the Delta and Omicron variants in the lungs but also provided enhanced protection in the upper respiratory tract. In vivo CD8+ T cell depletion suggested a potential role for CD8+ T cells in protection conferred by mRNA-S+N vaccination. Antigen-specific immune analyses indicated that N-specific immunity, as well as augmented S-specific immunity, was associated with enhanced protection elicited by the combination mRNA vaccination. Our findings suggest that combined mRNA-S+N vaccination is an effective approach for promoting broad protection against SARS-CoV-2 variants.


Figures

Fig. 1.
Fig. 1.. mRNA-N vaccination is immunogenic in mice.
(A) Experimental design and timeline. Two groups of BALB/c mice (n = 7) were intramuscularly vaccinated with PBS (Mock) or mRNA-N vaccine (1 μg) at weeks 0 and 3. At week 3 before booster vaccination, blood and serum samples were collected for analysis of antibody response. Two weeks after booster vaccination (week 5), mice were euthanized and subjected to immune analysis. (B) Analysis of total CD4+ and CD8+ T cell activation in the mouse spleen at week 5 after immunization. Expression of CD44 on CD4+ and CD8+ T cells was examined by flow cytometry and shown as percent CD44+ of parental population. (C) Vaccine-specific T cells in mouse spleen were measured by ICS. Splenocytes were stimulated with a SARS-CoV-2 N peptide pool (QHD43423.2), followed by immune staining and flow cytometric analysis. Representative flow cytometry plots for cytokine expression in T cells are shown. (D) Shown is the comparison of percent cytokine-positive, N-specific CD4+ T cells in the spleen between mock and vaccine groups. (E) Shown is the comparison of percent cytokine-positive, N-specific CD8+ T cells in the spleen between mock and vaccine groups. (F) N-specific T cells in the spleen were measured by IFN-γ ELISPOT. Data were shown as SFC per 106 splenocytes. (G) ELISA measurements are shown for serum N-specific–binding IgG after prime (week 3) or booster (week 5) vaccination. Optical density (OD450) values for individual serum samples after prime or booster vaccination at indicated serum dilution (1:2700 for prime; 1:72900 for booster) are shown. (H) Comparison of N-specific IgG end point titers (EPT) between mock and vaccine groups after prime and booster vaccination is shown. (I) Serum neutralizing activity was measured by plaque reduction neutralization test (PRNT) using wild-type SARS-CoV-2. PRNT50 for individual serum samples of the mock and vaccine groups are shown. Dashed line in (I) indicates the limit of detection. NC, negative control; PC, positive control. Data are presented as median and IQR. Mann-Whitney (F to H) or Kruskal-Wallis (B to E) test was used for statistical analysis. **P < 0.01 and ***P < 0.001.
Fig. 2.
Fig. 2.. mRNA-N vaccination induced protection against SARS-CoV-2 challenge in mice and hamsters.
(A) Mouse experimental design and timeline. Two groups of BALB/c mice (n = 8) were intramuscularly vaccinated with PBS (mock) or mRNA-N vaccine (1 μg) at weeks 0 and 3. Two weeks after booster vaccination (week 5), mice were intranasally challenged with mouse-adapted (MA) SARS-CoV-2 (2 × 10⁴ pfu). Two days post infection (DPI), viral loads in the lungs were analyzed to evaluate vaccine-induced protection. (B) Comparison of viral RNA copies in the mouse lungs between mock and vaccine groups are shown. Viral RNA copies were quantified by RT-PCR and expressed as log10 copies per milligram of lung tissue. (C) Comparison of viral titers in the mouse lungs between mock and vaccine group are shown. Viral titers were quantified by plaque assay and expressed as log10 FFU per gram of lung tissue. (D) Hamster experimental design and timeline. Three groups of hamsters were investigated. The first two groups (n = 12 per group) were intramuscularly vaccinated with mock or mRNA-N (2 μg) at weeks 0 and 3, followed by SARS-CoV-2 Delta challenge at week 5 and viral load analysis on 2 (n = 6) and 4 (n = 6) DPI. The third group (n = 6) received the same mRNA-N vaccine and subsequent viral challenge, except that these hamsters were intraperitoneally injected with two doses of antibodies for CD8+ T cell depletion at 6 and 3 days before viral challenge. Viral loads were analyzed on 2 DPI (n = 6).(E) Comparison of viral RNA copies in hamster lungs (log10 viral copies per milligram) between mock and vaccine group are shown for samples collected on 2 and 4 DPI. (F) Comparisons of viral titers in the hamster lungs (log10 FFU per gram) between mock and vaccine group are shown for samples collected on 2 and 4 DPI. (G) Comparison of hamster body weight loss is shown for the mock and vaccine group from days 0 to 4 DPI. (H) A comparison of viral RNA copies in the lung of hamsters (log10 viral copies per milligram) among the three groups is shown for samples collected on 2 DPI. The dashed line in (F) indicates the limit of detection. Data are presented as median and IQR where appropriate. Mann-Whitney (B, C, and G) or Kruskal-Wallis (E, F, and H) test was used for statistical analysis. *P < 0.05, **P < 0.01, and ***P < 0.001.
Fig. 3.
Fig. 3.. Combination mRNA-S+N vaccination confers improved protection against challenge with the SARS-CoV-2 Delta variant compared to mRNA-S vaccination alone.
(A) Mouse experimental design and timeline. Three groups of mice (n = 8 per group) were vaccinated intramuscularly with mock, mRNA-S (1 μg), or mRNA-S+N (1 μg for each) at weeks 0 and 3, followed by intranasal challenge with MA-SARS-CoV-2 (2 × 10⁴ pfu). On 2 DPI, viral RNA copies and titers in the lungs were quantified. (B) A comparison of viral titers between different groups is shown for mouse lungs collected on 2 DPI (log10 FFU per gram). (C) Shown is a comparison of viral RNA copies in the mouse lungs (log10 viral copies per milligram) between different groups at 2 DPI. (D) Hamster experimental design and timeline. Three groups of hamsters (n = 12 per group) were vaccinated intramuscularly with mock, mRNA-S (2 μg), or mRNA-S+N (2 μg for each) at weeks 0 and 3, followed by intranasal challenge with SARS-CoV-2 Delta strain (2 × 10⁴ pfu) at week 5. On 2 (n = 6) and 4 DPI (n = 6), lung tissues were harvested for analysis of viral RNA copies, viral titers, and pathology; nasal washes were collected for analysis of viral RNA copies; hamster body weights were also monitored. (E) Shown is a comparison of viral titers (log10 FFU per gram) in the hamster lungs between different groups on 2 and 4 DPI. (F) A comparison of viral RNA copies in the hamster lungs (log10 viral copies per milligram) is shown between different groups using samples collected at 2 and 4 DPI. (G) Hamster lung histopathology is shown. Postchallenge lung tissues (2 DPI) were fixed, and 5-μm sections were cut from hamsters and stained with hematoxylin and eosin. Left, lung of mock-immunized hamsters demonstrates bronchi with bronchiolitis (arrows) and adjacent marked interstitial pneumonia (arrowheads); middle and right, lungs of hamsters immunized with mRNA-S (middle) or mRNA-S+N (right) demonstrate normal bronchial (stars), bronchiolar (arrows), and alveolar architecture. Scale bars, 1 mm. (H) A comparison of viral RNA copies in the nasal washes (log10 viral copies per milligram) is shown between the indicated groups on 2 and 4 DPI. (I) A comparison of hamster body weight changes is shown between different groups from 0 to 4 DPI. * on 2 DPI denotes difference of mRNA-S+N from mRNA-S or mock; ** on 4 DPI denote differences of mRNA-S+N or mRNA-S from mock, respectively. Dashed lines in (B, C, E, and F) show the assay limit of detection. The numbers at the bottom of (B, C, and E) indicate the proportion of animals with a result above the limit of detection. Data are presented as median and IQR where appropriate. Mann-Whitney (B and C) or Kruskal-Wallis (E, F, H, and I) test was used for statistical analysis. *P < 0.05, **P < 0.01, and ***P < 0.001.
Fig. 4.
Fig. 4.. Combination mRNA-S+N vaccination confers protection against the Omicron variant in hamsters.
(A) Hamster experimental design and timeline. Four groups of hamsters (n = 10 per group) were vaccinated intramuscularly with mock (empty LNP), mRNA-S (2 μg), mRNA-S (2 μg), or mRNA-S+N (2 μg for each) at weeks 0 and 3, followed by intranasal challenge with SARS-CoV-2 Omicron strain (2 × 10⁴ pfu) at week 5. On 2 (n = 6) and 4 DPI (n = 6), lung tissues were harvested for analysis of viral RNA copies, viral titers, and pathology; nasal washes were collected for analysis of viral RNA copies; hamster body weights were monitored. In addition, a fifth group (n = 10) that was vaccinated with the same mRNA-S+N but received two doses of anti-CD8β–depleting antibody (intraperitoneally) before viral challenge (days −6 and −3) was included. (B to E) Viral RNA copies (log10 viral copies per milligram) (B and D) and viral titers (log10 FFU per gram) (C and E) were measured in the hamster lungs collected from the indicated groups at 2 DPI (B and C) and 4 DPI (D and E). (F) Pooled analysis of viral titers is shown for the hamster lung samples collected at 2 and 4 DPI. Log10 FFU per gram was compared between the different groups. (G) Hamster lung histopathology is shown using samples collected at 4 DPI. Mock, lung demonstrates bronchi with bronchiolitis (arrows) and adjacent marked interstitial pneumonia (arrowheads); mRNA-S (2 μg), lung demonstrates peribronchiolitis (arrow), perivasculitis (asterisk), and multifocal interstitial pneumonia (arrowhead); mRNA-S (4 μg), lung demonstrates marked interstitial pneumonia (arrowheads); mRNA-S+N, lung demonstrates normal bronchial, bronchiolar (arrows), and alveolar architecture. Scale bars, 1 mm. (H) A comparison of viral RNA copies in the nasal washes (log10 viral copies per milligram) between different groups on 2 and 4 DPI is shown. (I) A comparison of hamster body weight changes among the indicated groups is shown. * denotes difference between mRNA-S+N and mRNA-S (4 μg). (J) Shown is a comparison of viral RNA copies in the hamster lungs (log10 viral copies per milligram) on 2 DPI between mock, mRNA-S+N (S+N), and mRNA-S+N/CD8+ T cell depletion (S+N/CD8 Dep) groups. (K) Pooled analysis is shown for viral RNA copies in the hamster lungs for 2 and 4 DPI samples together. (L) Shown is a comparison of hamster body weight changes between the indicated groups. In (L), * and ** denote comparison of mRNA-S+N with mRNA-S+N/CD8 Dep. Dashed lines show limit of detection. The numbers at the bottom of (B to F) indicate the proportion of animals with a result above the limit of detection. Data are presented as median and IQR where appropriate. Kruskal-Wallis test was used for statistical analysis. *P < 0.05 and **P < 0.01.
Fig. 5.
Fig. 5.. Combination mRNA-S+N vaccination induces antigen-specific immune responses in mice and hamsters.
Immunogenicity experimental design and timeline: Three groups of BALB/c mice (n = 7 per group) were vaccinated intramuscularly with mock, mRNA-S (1 μg), or combination mRNA-S+N (1 μg for each) at weeks 0 and 3. Blood and serum samples were collected at week 3 (before booster) to measure antibody responses. Two weeks after booster (week 5), vaccine-induced T cell and antibody responses were measured. (A and B) ICS measurements of S-specific CD4+ and CD8+ T cells in the mouse spleen (week 5) are shown. Percent of individual cytokine-positive CD4+ (A) or CD8+ (B) T cells were compared between the mock and vaccine groups. (C and D) ICS measurements of N-specific CD4+ and CD8+ T cells in the mouse spleen (week 5) are shown. Percent of individual cytokine-positive CD4+ (C) or CD8+ (D) T cells were compared between the mock and vaccine groups. (E) IFN-γ ELISPOT measurements of antigen- specific T cells in spleen (week 5) are shown. Data were shown as SFC per 106 splenocytes. (F and G) ELISA measurement of serum S-specific (F) or N-specific (G) binding IgG are shown for samples collected after prime (week 3) or booster (week 5) vaccination in mice. Antibody EPTs were determined on the basis of serum serial dilutions and compared between different groups. (H) Serum samples were collected from the hamsters in Fig. 3D (n = 12) after booster vaccination (week 5) but before viral challenge. Samples were used to measure neutralizing activity by PRNT. PRNT50 neutralization titers for individual serum samples were compared among different groups and between the wild-type virus and the Delta variants. Dashed lines (F, G, and H) show limit of detection for each assay. Data are presented as median and IQR where appropriate. Kruskal-Wallis test was used for statistical analysis. *P < 0.05, **P < 0.01, ***P < 0.001, and ****P < 0.0001.

Similar articles

Cited by

References

    1. Zhu N, Zhang D, Wang W, Li X, Yang B, Song J, Zhao X, Huang B, Shi W, Lu R, Niu P, Zhan F, Ma X, Wang D, Xu W, Wu G, Gao GF, Tan W; China Novel Coronavirus Investigating and Research Team, A novel coronavirus from patients with pneumonia in China, 2019. N. Engl. J. Med. 382, 727–733 (2020). - PMC - PubMed
    1. Zhou P, Yang XL, Wang XG, Hu B, Zhang L, Zhang W, Si HR, Zhu Y, Li B, Huang CL, Chen HD, Chen J, Luo Y, Guo H, Jiang RD, Liu MQ, Chen Y, Shen XR, Wang X, Zheng XS, Zhao K, Chen QJ, Deng F, Liu LL, Yan B, Zhan FX, Wang YY, Xiao GF, Shi ZL, A pneumonia outbreak associated with a new coronavirus of probable bat origin. Nature 579, 270–273 (2020). - PMC - PubMed
    1. Tregoning JS, Flight KE, Higham SL, Wang Z, Pierce BF, Progress of the COVID-19 vaccine effort: Viruses, vaccines and variants versus efficacy, effectiveness and escape. Nat. Rev. Immunol. 21, 626–636 (2021). - PMC - PubMed
    1. Madhi SA, Baillie V, Cutland CL, Voysey M, Koen AL, Fairlie L, Padayachee SD, Dheda K, Barnabas SL, Bhorat QE, Briner C, Kwatra G, Ahmed K, Aley P, Bhikha S, Bhiman JN, Bhorat AE, du Plessis J, Esmail A, Groenewald M, Horne E, Hwa SH, Jose A, Lambe T, Laubscher M, Malahleha M, Masenya M, Masilela M, McKenzie S, Molapo K, Moultrie A, Oelofse S, Patel F, Pillay S, Rhead S, Rodel H, Rossouw L, Taoushanis C, Tegally H, Thombrayil A, van Eck S, Wibmer CK, Durham NM, Kelly EJ, Villafana TL, Gilbert S, Pollard AJ, de Oliveira T, Moore PL, Sigal A, Izu A; NGS-SA Group; Wits-VIDA COVID Group, Efficacy of the ChAdOx1 nCoV-19 Covid-19 vaccine against the B.1.351 variant. N. Engl. J. Med. 384, 1885–1898 (2021). - PMC - PubMed
    1. Moore JP, Offit PA, SARS-CoV-2 vaccines and the growing threat of viral variants. JAMA 325, 821–822 (2021). - PubMed

Publication types

Supplementary concepts