

Cold shock domain-containing protein E1 is a posttranscriptional regulator of the LDL receptor
- PMID: 36103516
- PMCID: PMC10174261
- DOI: 10.1126/scitranslmed.abj8670
Cold shock domain-containing protein E1 is a posttranscriptional regulator of the LDL receptor
Abstract
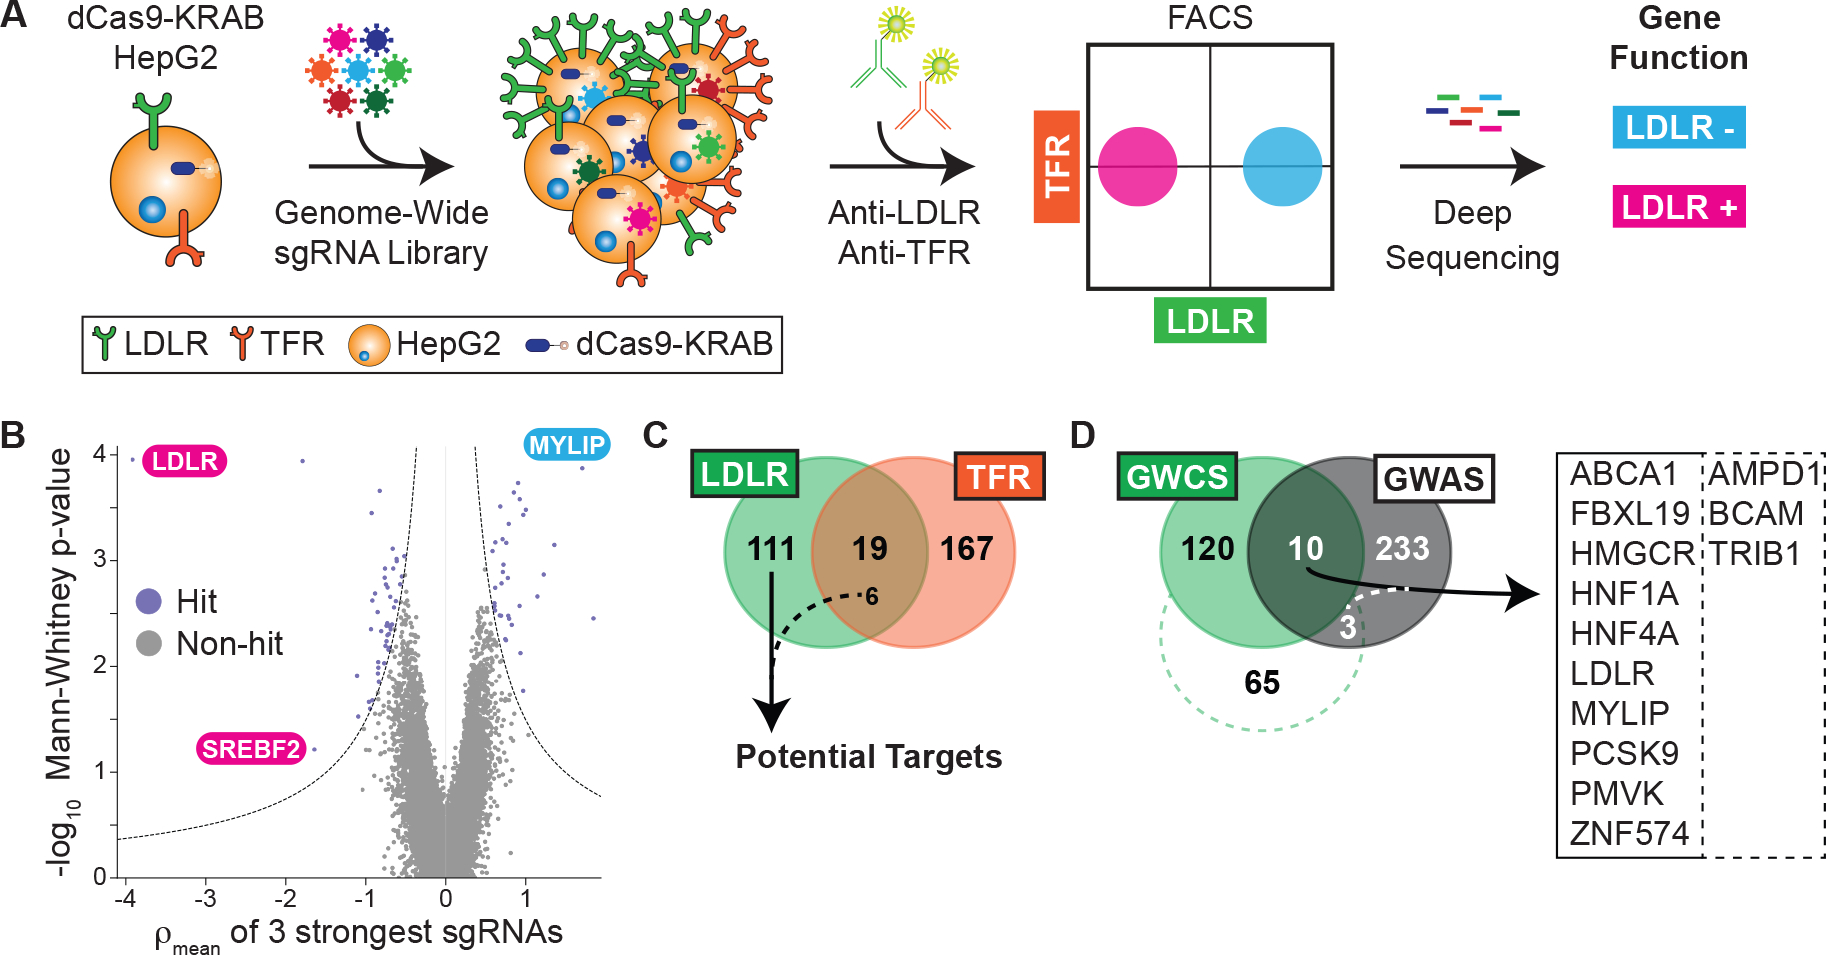
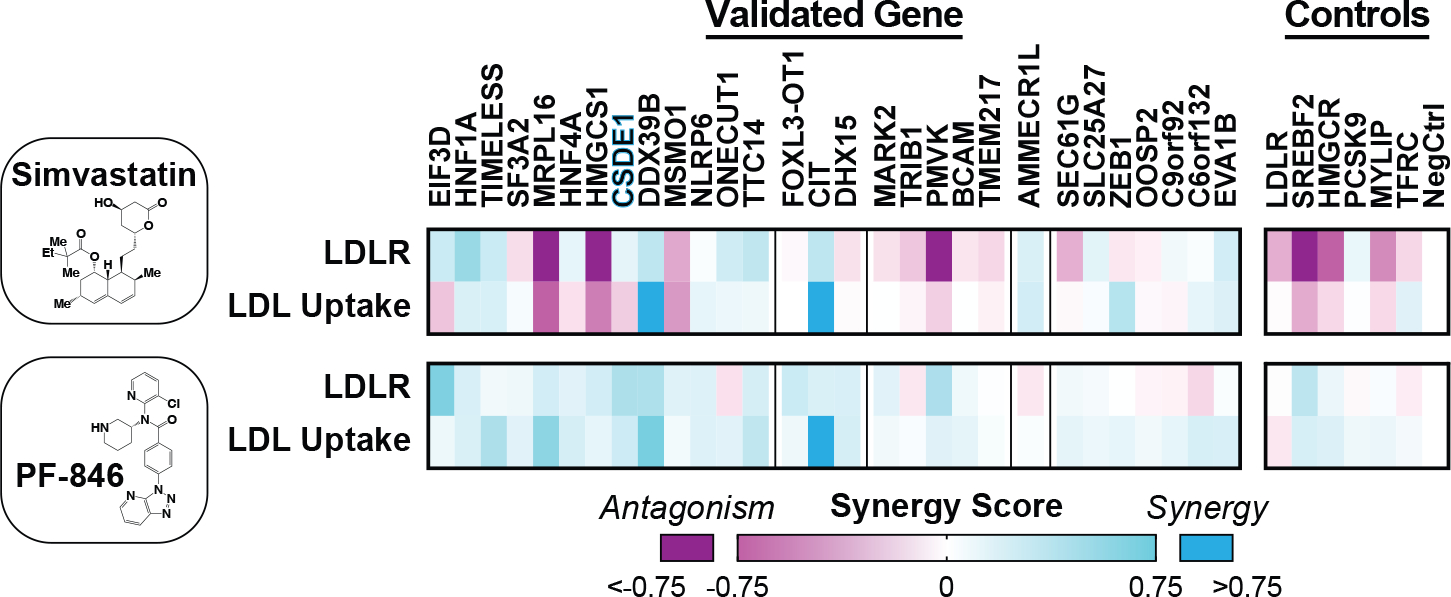
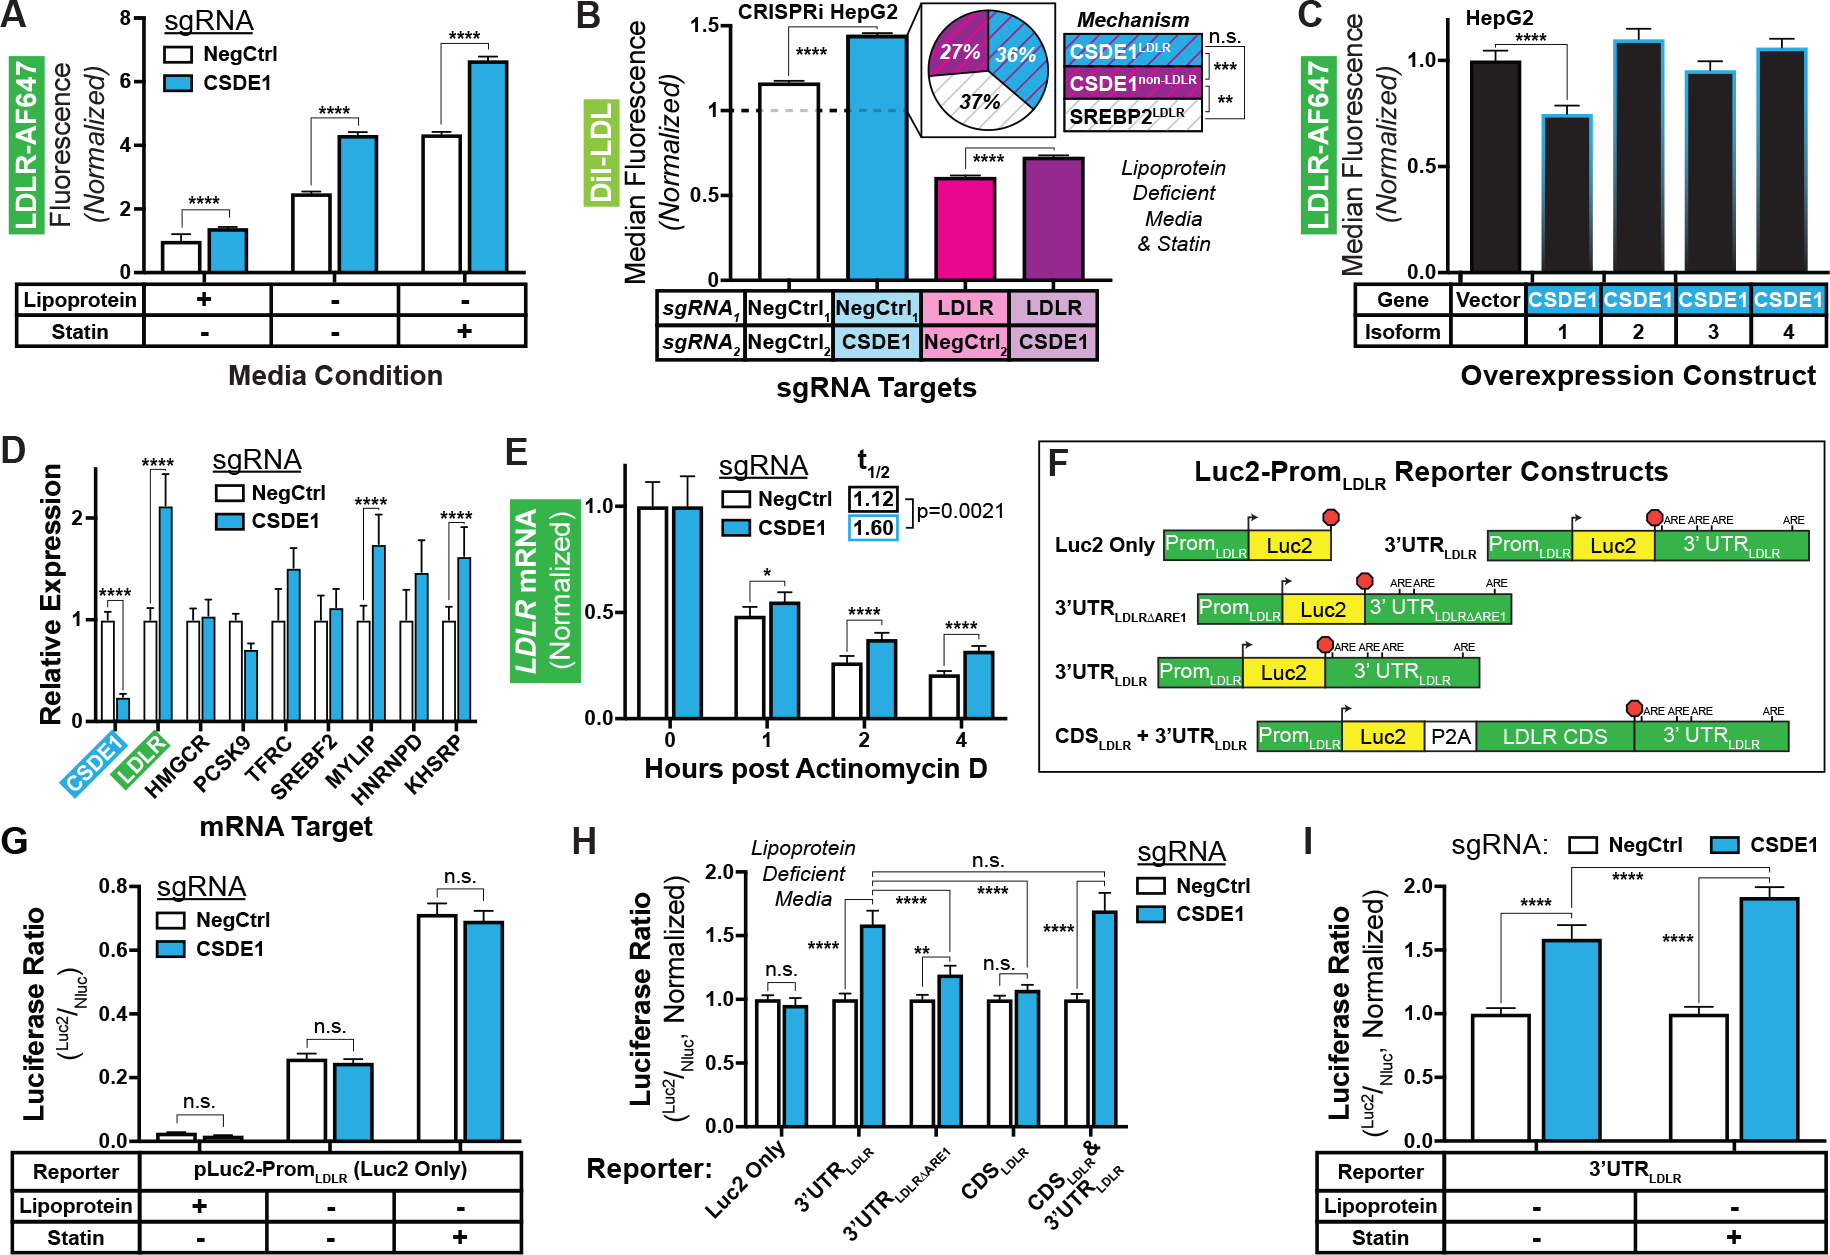
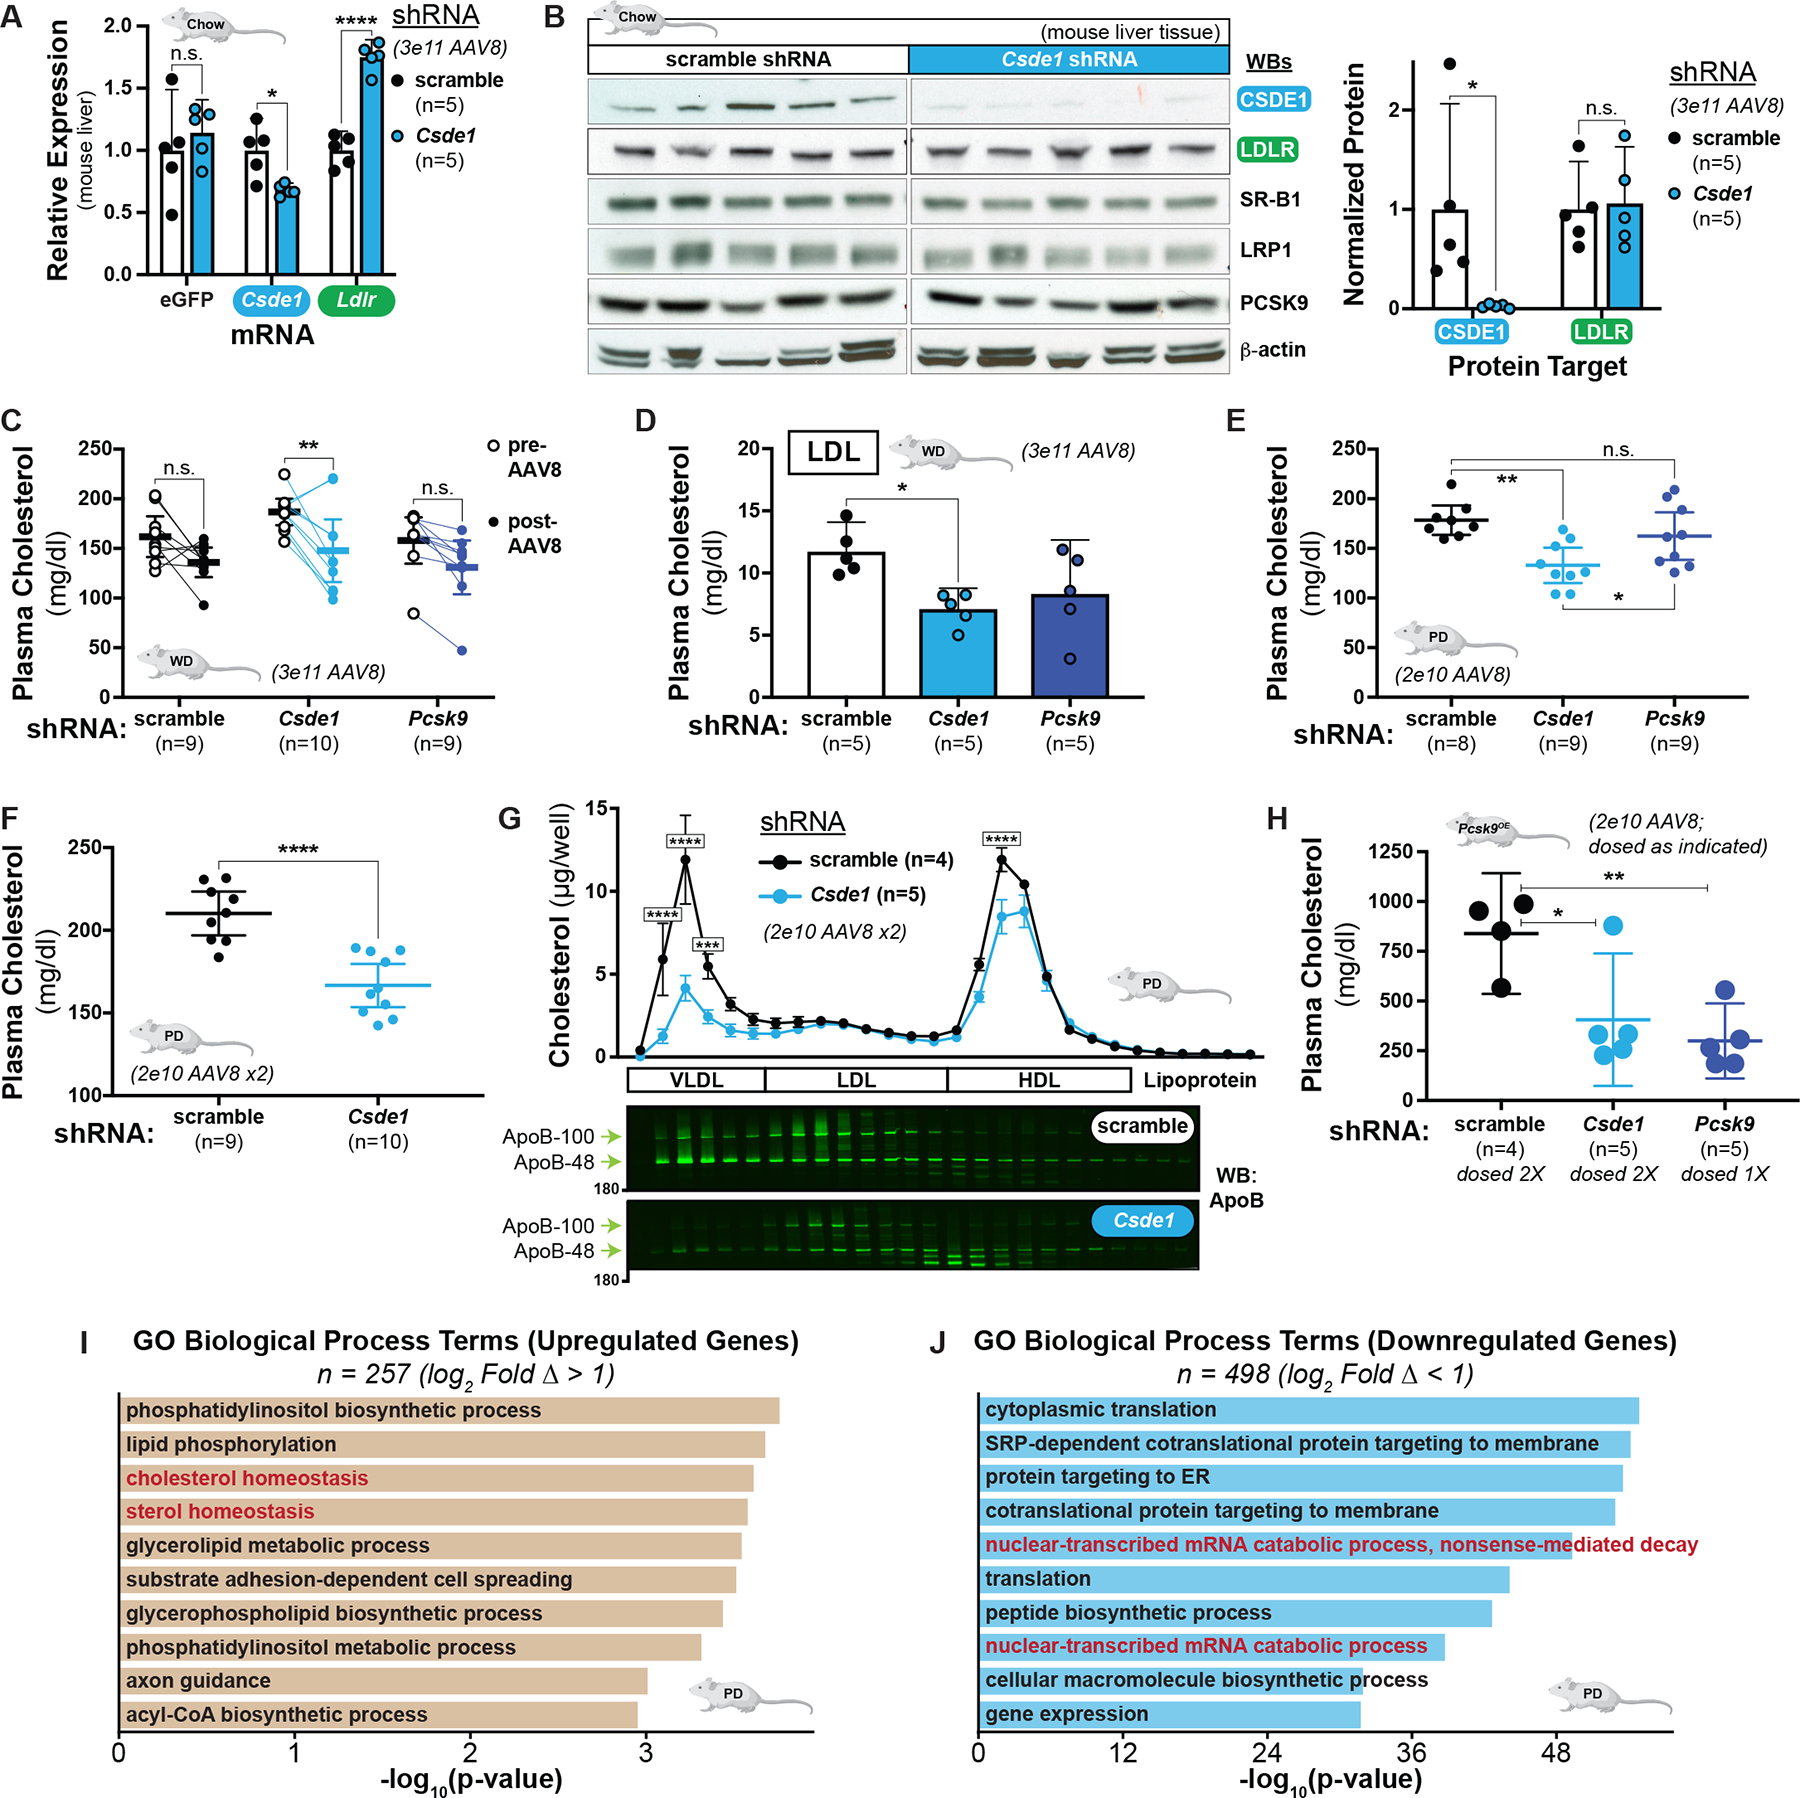
The low-density lipoprotein receptor (LDLR) controls cellular delivery of cholesterol and clears LDL from the bloodstream, protecting against atherosclerotic heart disease, the leading cause of death in the United States. We therefore sought to identify regulators of the LDLR beyond the targets of current therapies and known causes of familial hypercholesterolemia. We found that cold shock domain-containing protein E1 (CSDE1) enhanced hepatic LDLR messenger RNA (mRNA) decay via its 3' untranslated region and regulated atherogenic lipoproteins in vivo. Using parallel phenotypic genome-wide CRISPR interference screens in a tissue culture model, we identified 40 specific regulators of the LDLR that were not previously identified by observational human genetic studies. Among these, we demonstrated that, in HepG2 cells, CSDE1 regulated the LDLR at least as strongly as statins and proprotein convertase subtilisin/kexin type 9 (PCSK9) inhibitors. In addition, we showed that hepatic gene silencing of Csde1 treated diet-induced dyslipidemia in mice to a similar degree as Pcsk9 silencing. These results suggest the therapeutic potential of targeting CSDE1 to manipulate the posttranscriptional regulation of the LDLR mRNA for the prevention of cardiovascular disease. Our approach of modeling a clinically relevant phenotype in a forward genetic screen, followed by mechanistic pharmacologic dissection and in vivo validation, may serve as a generalizable template for the identification of therapeutic targets in other human disease states.
Conflict of interest statement
Figures

Comment in
-
CSDE1 regulates LDL receptor levels.Nat Rev Cardiol. 2022 Dec;19(12):782. doi: 10.1038/s41569-022-00795-6. Nat Rev Cardiol. 2022. PMID: 36180591 No abstract available.
Similar articles
-
Cyclase-associated protein 1 is a binding partner of proprotein convertase subtilisin/kexin type-9 and is required for the degradation of low-density lipoprotein receptors by proprotein convertase subtilisin/kexin type-9.Eur Heart J. 2020 Jan 7;41(2):239-252. doi: 10.1093/eurheartj/ehz566. Eur Heart J. 2020. PMID: 31419281 Free PMC article.
-
Proprotein Convertase Subtilisin/Kexin Type 9 (PCSK9) Single Domain Antibodies Are Potent Inhibitors of Low Density Lipoprotein Receptor Degradation.J Biol Chem. 2016 Aug 5;291(32):16659-71. doi: 10.1074/jbc.M116.717736. Epub 2016 Jun 8. J Biol Chem. 2016. PMID: 27284008 Free PMC article.
-
An Unbiased Mass Spectrometry Approach Identifies Glypican-3 as an Interactor of Proprotein Convertase Subtilisin/Kexin Type 9 (PCSK9) and Low Density Lipoprotein Receptor (LDLR) in Hepatocellular Carcinoma Cells.J Biol Chem. 2016 Nov 18;291(47):24676-24687. doi: 10.1074/jbc.M116.746883. Epub 2016 Oct 7. J Biol Chem. 2016. PMID: 27758865 Free PMC article.
-
Targeting the proprotein convertase subtilisin/kexin type 9 for the treatment of dyslipidemia and atherosclerosis.J Am Coll Cardiol. 2013 Oct 15;62(16):1401-8. doi: 10.1016/j.jacc.2013.07.056. Epub 2013 Aug 21. J Am Coll Cardiol. 2013. PMID: 23973703 Review.
-
Proprotein Convertase Subtilisin/Kexin-Type 9 and Lipid Metabolism.Adv Exp Med Biol. 2020;1276:137-156. doi: 10.1007/978-981-15-6082-8_9. Adv Exp Med Biol. 2020. PMID: 32705598 Review.
Cited by
-
Functional interrogation of cellular Lp(a) uptake by genome-scale CRISPR screening.Atherosclerosis. 2025 Apr;403:119174. doi: 10.1016/j.atherosclerosis.2025.119174. Epub 2025 Mar 22. Atherosclerosis. 2025. PMID: 40174266
-
Heparin Does Not Regulate Circulating Human PCSK9 (Proprotein Convertase Subtilisin-Kexin Type 9) in a General Population-Brief Report.Arterioscler Thromb Vasc Biol. 2023 Feb;43(2):352-358. doi: 10.1161/ATVBAHA.122.318556. Epub 2022 Dec 8. Arterioscler Thromb Vasc Biol. 2023. PMID: 36475702 Free PMC article.
-
CRISPR screening in cardiovascular research.Front Cell Dev Biol. 2023 Apr 12;11:1175849. doi: 10.3389/fcell.2023.1175849. eCollection 2023. Front Cell Dev Biol. 2023. PMID: 37123412 Free PMC article. Review.
-
Systematic interrogation of functional genes underlying cholesterol and lipid homeostasis.Genome Biol. 2025 Mar 17;26(1):59. doi: 10.1186/s13059-025-03531-8. Genome Biol. 2025. PMID: 40098013 Free PMC article.
-
Rapid Multiplexed Flow Cytometric Validation of CRISPRi sgRNAs in Tissue Culture.Bio Protoc. 2023 Jan 20;13(2):e4591. doi: 10.21769/BioProtoc.4591. eCollection 2023 Jan 20. Bio Protoc. 2023. PMID: 36789164 Free PMC article.
References
-
- Brown MS, Goldstein JL, A receptor-mediated pathway for cholesterol homeostasis, Science 232, 34–47 (1986). - PubMed
-
- Silverman MG, Ference BA, Im K, Wiviott SD, Giugliano RP, Grundy SM, Braunwald E, Sabatine MS, Association between lowering LDL-C and cardiovascular risk reduction among different therapeutic interventions, JAMA 316, 1289–1297 (2016). - PubMed
-
- Kochanek KD, Xu J, Arias E, Mortality in the United States, 2019, NCHS Data Brief 395, 1–8 (2020). - PubMed
-
- Sabatine MS, Giugliano RP, Keech AC, Honarpour N, Wiviott SD, Murphy SA, Kuder JF, Wang H, Liu T, Wasserman SM, Sever PS, Pedersen TR, FOURIER Steering Committee and Investigators, Evolocumab and clinical outcomes in patients with cardiovascular disease, N. Engl. J. Med. 376, 1713–1722 (2017). - PubMed
Publication types
MeSH terms
Substances
Grants and funding
- R01 HL146404/HL/NHLBI NIH HHS/United States
- P01 HL146366/HL/NHLBI NIH HHS/United States
- R01 HL127240/HL/NHLBI NIH HHS/United States
- MC_QA137853/MRC_/Medical Research Council/United Kingdom
- R01 HL127564/HL/NHLBI NIH HHS/United States
- P01 HL039707/HL/NHLBI NIH HHS/United States
- R01 DK119621/DK/NIDDK NIH HHS/United States
- R03 HL145259/HL/NHLBI NIH HHS/United States
- MC_PC_17228/MRC_/Medical Research Council/United Kingdom
- R01 HL148050/HL/NHLBI NIH HHS/United States
- C06 RR018928/RR/NCRR NIH HHS/United States
- R01 HL148565/HL/NHLBI NIH HHS/United States
- K08 HL157700/HL/NHLBI NIH HHS/United States
- K08 HL124068/HL/NHLBI NIH HHS/United States
- R01 HL142711/HL/NHLBI NIH HHS/United States
- R01 HL057181/HL/NHLBI NIH HHS/United States
- R01 HL159457/HL/NHLBI NIH HHS/United States
- R01 HL139783/HL/NHLBI NIH HHS/United States
LinkOut - more resources
Full Text Sources
Other Literature Sources
Molecular Biology Databases
Miscellaneous
