. 2022 Sep 16;8(37):eabm9427.
doi: 10.1126/sciadv.abm9427. Epub 2022 Sep 14.

Eprenetapopt triggers ferroptosis, inhibits NFS1 cysteine desulfurase, and synergizes with serine and glycine dietary restriction

Affiliations

Eprenetapopt triggers ferroptosis, inhibits NFS1 cysteine desulfurase, and synergizes with serine and glycine dietary restriction

Kenji M Fujihara et al. Sci Adv. .

Abstract

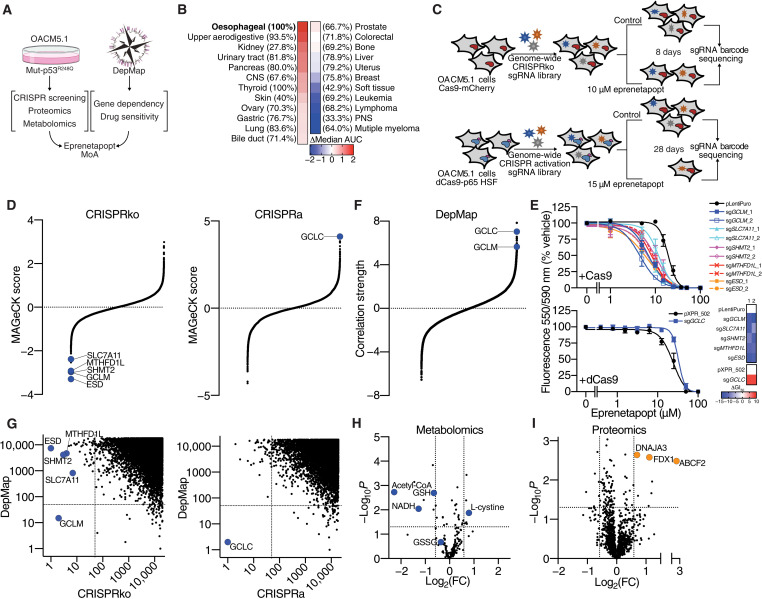
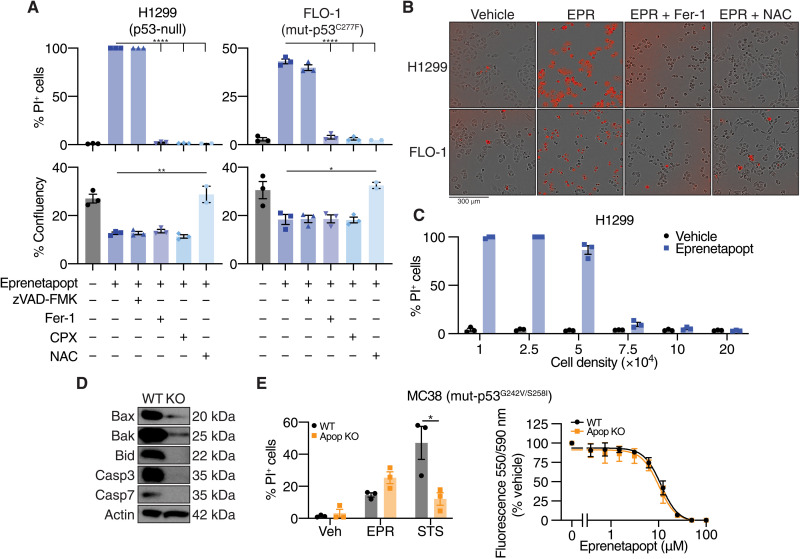
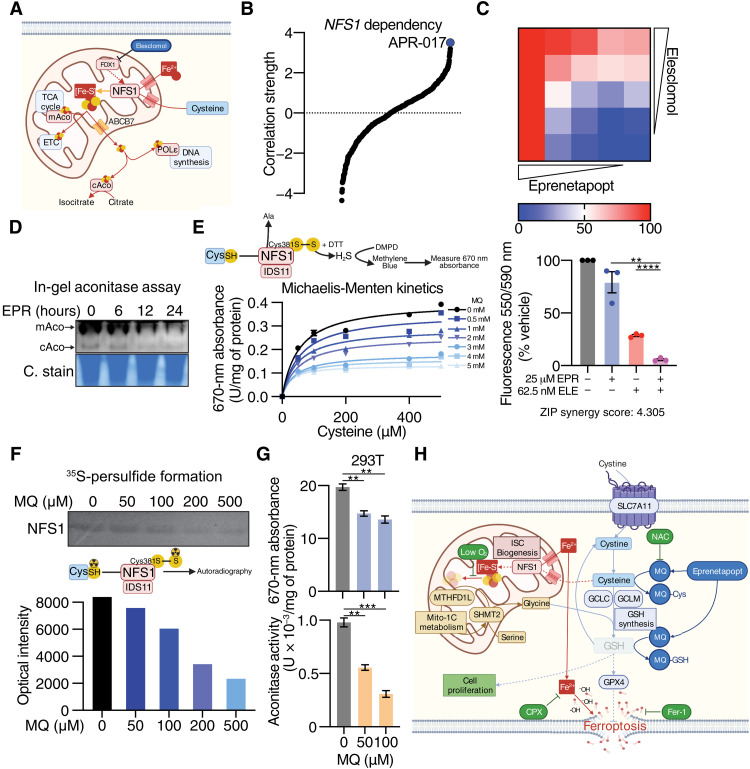
The mechanism of action of eprenetapopt (APR-246, PRIMA-1MET) as an anticancer agent remains unresolved, although the clinical development of eprenetapopt focuses on its reported mechanism of action as a mutant-p53 reactivator. Using unbiased approaches, this study demonstrates that eprenetapopt depletes cellular antioxidant glutathione levels by increasing its turnover, triggering a nonapoptotic, iron-dependent form of cell death known as ferroptosis. Deficiency in genes responsible for supplying cancer cells with the substrates for de novo glutathione synthesis (SLC7A11, SHMT2, and MTHFD1L), as well as the enzymes required to synthesize glutathione (GCLC and GCLM), augments the activity of eprenetapopt. Eprenetapopt also inhibits iron-sulfur cluster biogenesis by limiting the cysteine desulfurase activity of NFS1, which potentiates ferroptosis and may restrict cellular proliferation. The combination of eprenetapopt with dietary serine and glycine restriction synergizes to inhibit esophageal xenograft tumor growth. These findings reframe the canonical view of eprenetapopt from a mutant-p53 reactivator to a ferroptosis inducer.


Figures

Fig. 1.
Fig. 1.. Multiomics strategy to determine the MoA of eprenetapopt.
(A) Schematic diagram showing a strategy to determine the MoA of eprenetapopt. (B) Heatmap of sensitivity to eprenetapopt analog (APR-017). Cancer lineages are ordered by sensitivity determined by delta median, area under the curve (AUC) of compound activity. Percentages denote the frequency of TP53 mutations in each lineage. CNS, central nervous system; PNS, peripheral nervous system. (C) Schematic showing the workflow for the CRISPRko and CRISPRa screens in OACM5.1 cells. (D) MAGeCK scores (negative indicating dropout and positive indicating “enrichment”) from CRISPR screens, plotted in order of magnitude. (E) Cellular metabolic activity measured by alamarBlue as a surrogate readout for cell viability following 72-hour exposure with eprenetapopt at indicated doses in cells transduced with individual sgRNA targeting identified hits. Heatmap represents the change in GI50 (dose where 50% growth inhibition is achieved) relative to control. (F) Fisher’s transformed z-scored Pearson correlation strength of gene dependency from the DepMap database with eprenetapopt analog (APR-017) sensitivity data from CTRPv2, plotted in order of magnitude. (G) Comparison of CRISPR screens and DepMap gene dependency data shows overlay of glutamate-cysteine ligase units (GCLC and GCLM). Plot is representing the rank of top hits (ordered by dropout in CRISPRko, by enrichment in CRISPRa, and by positive correlations in DepMap). Dashed lines indicate overlap of top 50 ranked genes. (H) Changes in polar metabolites determined by untargeted liquid chromatography–mass spectrometry (LC-MS) metabolomics and (I) proteins determined by label-free quantitative proteomics in OACM5.1 cells following treatment with 50 μM eprenetapopt for 12 hours compared to vehicle. Dotted lines indicate significance cutoffs {P < 0.05, |log2[fold change (FC)]| > 0.5}. Two-tailed unpaired t test (H and I). Error bars = SEM. (D) n = 2 for CRISPRko, n = 1 for CRISPRa, (E) n = 3 to 4, (H) n = 6, and (I) n = 4. See also fig. S1.
Fig. 2.
Fig. 2.. Eprenetapopt and mito-1C metabolism.
(A) Schematic diagram illustrating the connections between de novo GSH synthesis and mito-1C metabolism. THF, tetrahydrofolate; GSH, reduced GSH; MQ-Cys, MQ-conjugated cysteine; MQ-GSH; MQ-conjugated GSH. (B) Cellular metabolic activity measured by alamarBlue as a surrogate readout for cell viability compared to complete medium (CM) following 72 hours of serine, glycine, or SG deprivation and glycine deprivation rescued with 1 mM GSH monoethyl ester (GSH) in OACM5.1 cells. (C) Relative cell number following treatment with 10 μM eprenetapopt ± 1 mM glycine supplementation for 4 days. + indicates glycine in RPMI 1640, and ++ indicates supplementation with additional 1 mM glycine. (D) Top: Growth curves and overall survival (time to reach a tumor volume of ≥1400 mm3) of nonobese diabetic–severe combined immunodeficient interleukin-2RγKO (NSG) mice inoculated with FLO-1 LM tumors treated with eprenetapopt (EPR; 100 mg/kg, daily) or vehicle on either normal or SG-free diets for 35 days. Bottom: Representative bioluminescence images illustrating the metastatic burden in mice after 35 days of treatment. (E) Growth curves of esophageal adenocarcinoma PDXs in NSG mice treated with eprenetapopt (100 mg/kg, daily) or vehicle on either normal or SG-free diet for 21 days. (F) Fractional labeling of de novo GSH synthesis intermediates from 13C2-cystine following 12-hour exposure to 50 μM eprenetapopt compared to vehicle in OACM5.1 cells. Two-tailed t test (B and C), one-way analysis of variance (ANOVA) with Tukey’s multiple comparisons test (D and E), and log-rank (Mantel-Cox) test (D). *P < 0.05, **P < 0.01, and ***P < 0.001. NS, not significant. Error bars = SEM. (A) n = 1, (B and F) n = 3, (C) n = 5, (D) n = 8, and (E) n = 4 to 5. See also fg. S2.
Fig. 3.
Fig. 3.. Eprenetapopt triggers ferroptosis.
(A) Percentage (%) of dead cells [as determined by % PI+ cells] and percentage of cell confluency following treatment for 24 hours with 50 μM eprenetapopt with or without 50 μM zVAD-FMK (pan-caspase inhibitor), 12.5 μM Fer-1 (lipophilic antioxidant), 6.25 μM CPX (iron chelator), or 2.5 mM NAC (cysteine supplement) in H1299 (left) and FLO-1 cells (right). (B) Representative merged phase and red channel images of results from (A) acquired on IncuCyte. (C) Percentage of cell death determined by PI uptake following 24-hour treatment with 50 μM eprenetapopt in H1299 cells at indicated cell densities. (D) Immunoblot of Bax, Bak, Bid, Casp3, and Casp7 illustrating the efficiency of CRISPR editing in MC38 cells. (E) Left: Cell death in MC38 wild-type (WT) and apoptosis-deficient (Apop KO) cells following 24-hour treatment with 50 μM eprenetapopt or 12.5 μM STS. Right: Cellular metabolic activity measured by alamarBlue as a surrogate readout for cell viability following 72-hour exposure with eprenetapopt at indicated doses in wild-type and apoptosis-deficient MC38 cells. Two-way t test (A and E). *P < 0.05, **P < 0.01, and ****P < 0.0001. (A) n = 2 to 3, (D) n = 2, representative blots shown, and (E) n = 3. See also fig. S3 and movie S1.
Fig. 4.
Fig. 4.. Eprenetapopt inhibits NFS1 cysteine desulfurase activity.
(A) Schematic diagram summarizing the role of NFS1 cysteine desulfurase and important iron-sulfur cluster containing enzymes (TCA, tricarboxylic acid; ETC, electron transport chain; POLε, DNA polymerase epsilon). mAco, mitochondrial aconitase; cAco, cytosolic aconitase. (B) Fisher’s transformed z-scored Pearson correlation strength of NFS1 gene dependency and the compound activity of the 481 CTRPv2 compounds. (C) Heatmap (top) and bar chart (bottom) demonstrating cell viability following 72-hour eprenetapopt and elesclomol (ELE) cotreatment in OACM5.1 cells. (D) In-gel aconitase assay and Coomassie stain (C. stain) (for protein loading) in OACM5.1 cells following treatment with 50 μM eprenetapopt for indicated times. (E) Cell-free NFS1 cysteine desulfurase assay at indicated doses of MQ and cysteine following 1-hour incubation measured by the release of hydrogen sulfide (H2S) by dithiothreitol (DTT) coupled to N,N-dimethyl-p-phenylenediamine (DMPD) hydrochloride to produce methylene blue. (F) Top: Two micromolars of purified NFS1 was incubated with indicated concentrations of MQ, and reaction was started with 35S-cysteine for 1 hour at 30°C, followed by separation on 12% nonreducing SDS–polyacrylamide gel electrophoresis (PAGE). Bottom: ImageJ quantification of the resulting bands. (G) Top: NFS1 cysteine desulfurase activity in human embryonic kidney 293T (293T) cells following 24-hour exposure with MQ at indicated doses measured by the release of H2S mediated by DTT and NFS1 cofactor pyridoxal 5′-phosphate. Bottom: Aconitase activity following 24-hour exposure with MQ at indicated doses in 293T cells. (H) Schematic diagram summarizing the MoA of eprenetapopt. Two-way unpaired t test (C and G), **P < 0.01, ***P < 0.001, and ****P < 0.0001. Error bars = SEM. (C, E, and G) n = 3. (D) n = 2, representative gel shown, and (F) n = 1.

References

    1. Haupt S., Caramia F., Herschtal A., Soussi T., Lozano G., Chen H., Liang H., Speed T. P., Haupt Y., Identification of cancer sex-disparity in the functional integrity of p53 and its X chromosome network. Nat. Commun. 10, 5385 (2019). - PMC - PubMed
    1. Bykov V. J. N., Eriksson S. E., Bianchi J., Wiman K. G., Targeting mutant p53 for efficient cancer therapy. Nat. Rev. Cancer 18, 89–102 (2018). - PubMed
    1. Cluzeau T., Sebert M., Rahmé R., Cuzzubbo S., Lehmann-Che J., Madelaine I., Peterlin P., Bève B., Attalah H., Chermat F., Miekoutima E., Rauzy O. B., Recher C., Stamatoullas A., Willems L., Raffoux E., Berthon C., Quesnel B., Loschi M., Carpentier A. F., Sallman D. A., Komrokji R., Walter-Petrich A., Chevret S., Ades L., Fenaux P., Eprenetapopt plus azacitidine in TP53-mutated myelodysplastic syndromes and acute myeloid leukemia: A phase II study by the Groupe Francophone des Myelodysplasies (GFM). J. Clin. Oncol. 39, 1575–1583 (2021). - PMC - PubMed
    1. Sallman D. A., DeZern A. E., Garcia-Manero G., Steensma D. P., Roboz G. J., Sekeres M. A., Cluzeau T., Sweet K. L., McLemore A., McGraw K. L., Puskas J., Zhang L., Yao J., Mo Q., Nardelli L., al Ali N. H., Padron E., Korbel G., Attar E. C., Kantarjian H. M., Lancet J. E., Fenaux P., List A. F., Komrokji R. S., Eprenetapopt (APR-246) and azacitidine in TP53-mutant myelodysplastic syndromes. J. Clin. Oncol. 39, 1584–1594 (2021). - PMC - PubMed
    1. Lambert J. M., Gorzov P., Veprintsev D. B., Söderqvist M., Segerbäck D., Bergman J., Fersht A. R., Hainaut P., Wiman K. G., Bykov V. J. N., PRIMA-1 reactivates mutant p53 by covalent binding to the core domain. Cancer Cell 15, 376–388 (2009). - PubMed