. 2022 Sep 20;119(38):e2210604119.
doi: 10.1073/pnas.2210604119. Epub 2022 Sep 14.

Using phylogenetics to infer HIV-1 transmission direction between known transmission pairs

Affiliations

Using phylogenetics to infer HIV-1 transmission direction between known transmission pairs

Christian Julian Villabona-Arenas et al. Proc Natl Acad Sci U S A. .

Abstract

Inferring the transmission direction between linked individuals living with HIV provides unparalleled power to understand the epidemiology that determines transmission. Phylogenetic ancestral-state reconstruction approaches infer the transmission direction by identifying the individual in whom the most recent common ancestor of the virus populations originated. While these methods vary in accuracy, it is unclear why. To evaluate the performance of phylogenetic ancestral-state reconstruction to determine the transmission direction of HIV-1 infection, we inferred the transmission direction for 112 transmission pairs where transmission direction and detailed additional information were available. We then fit a statistical model to evaluate the extent to which epidemiological, sampling, genetic, and phylogenetic factors influenced the outcome of the inference. Finally, we repeated the analysis under real-life conditions with only routinely available data. We found that whether ancestral-state reconstruction correctly infers the transmission direction depends principally on the phylogeny's topology. For example, under real-life conditions, the probability of identifying the correct transmission direction increases from 32%-when a monophyletic-monophyletic or paraphyletic-polyphyletic tree topology is observed and when the tip closest to the root does not agree with the state at the root-to 93% when a paraphyletic-monophyletic topology is observed and when the tip closest to the root agrees with the root state. Our results suggest that documenting larger differences in relative intrahost diversity increases our confidence in the transmission direction inference of linked pairs for population-level studies of HIV. These findings provide a practical starting point to determine our confidence in transmission direction inference from ancestral-state reconstruction.

Keywords: HIV-1 epidemiology; Lasso regression; ancestral-state reconstruction; phylogenetic tree topology; who acquires infection from whom.


Conflict of interest statement

The authors declare no competing interest.

Figures

Fig. 1.
Fig. 1.
Phylogenetic covariates. Illustration of the different metrics that are used to define the covariates from the phylogenetic information class. The topology classes are PP, PM, and MM. The identity of the most basal tip is the individual with the tip that minimizes the number of internal nodes along the paths between the root and the tips (the alternative definition for inside the square corresponds to the agreement of the individual with the most basal tip with the individual with the higher probability at the root). The minimum root to tip distance is the shortest path from the root to the tips of an individual (calculated for each partner). Phylogenetic diversity indicates using the unique evolutionary history measure that is the sum of the branch lengths that are not shared across the subtree of an individual and that give rise to every single tip of the individual (calculated for each partner), as described in the documentation of the R package Caper (31). The shortest patristic distance is the shortest path connecting a tip from both individuals.
Fig. 2.
Fig. 2.
Ancestral-state reconstruction. The probability for each transmission pair, i, that the transmitting partner is correctly identified using ML ancestral-state reconstruction. Observations are colored by the topology class. Observations with pi > 0.5, pi > 0.6, and pi > 0.95 indicate that the inferred transmission direction was consistent with the known transmission history for the binary model, the ordinal model with relaxed threshold, and the ordinal model with conservative threshold, respectively. For the ordinal models, the outcome can be equivocal (0.4 < pi < 0.6 for the relaxed threshold, 0.05 < pi < 0.95 for the conservative threshold). The outcome is inconsistent if not consistent or equivocal.
Fig. 3.
Fig. 3.
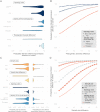
Model results. (A) AUC and 95% CIs of the models. The model name indicates the information’s class included in the model (i.e., epidemiological, genetic, sample, or phylogenetic). The size of each circle shows the number of covariates in the model after Lasso regression. The green color underscores the high-ranked models with equivalent discriminatory power. (B) The subset of covariates included in each model after Lasso regression colored by information class. The number of covariates in boxes from B corresponds to the size of the model in A. The green-colored boxes underscore high-ranked models with equivalent discriminatory power. The thick green box indicates the best-fit model. Gray-colored boxes emphasize models for which variable selection returned either a null model or a model without covariates from all the classes. (C and D) The same as in A and B but using only covariates that are routinely available and where the definition of the covariates did not consider the known direction of transmission. *Three covariates excluded in C and D.
Fig. 4.
Fig. 4.
The probability that the inferred transmission direction is correct. (A) One-way sensitivity analysis for the binary model (consistent or inconsistent) best-fit model P, where a single covariate is fixed and all other covariates are varied over their ranges as observed in the data. (B) Multiway analysis with the same model in A, but each covariate value combination is plotted separately. (C and D) The same as A and B, respectively, but corresponding to the ordinal (consistent, inconsistent, equivocal with relaxed threshold) best-fit model SP.

References

    1. Volz E. M., Frost S. D. W., Inferring the source of transmission with phylogenetic data. PLoS Comput. Biol. 9, e1003397 (2013). - PMC - PubMed
    1. Robert A., et al. , Determinants of transmission risk during the late stage of the West African Ebola epidemic. Am. J. Epidemiol. 188, 1319–1327 (2019). - PMC - PubMed
    1. Faye O., et al. , Chains of transmission and control of Ebola virus disease in Conakry, Guinea, in 2014: An observational study. Lancet Infect. Dis. 15, 320–326 (2015). - PMC - PubMed
    1. Lalor M. K., et al. , Recent household transmission of tuberculosis in England, 2010-2012: Retrospective national cohort study combining epidemiological and molecular strain typing data. BMC Med. 15, 105 (2017). - PMC - PubMed
    1. Rockett R. J., et al. , Revealing COVID-19 transmission in Australia by SARS-CoV-2 genome sequencing and agent-based modeling. Nat. Med. 26, 1398–1404 (2020). - PubMed

Publication types