. 2022 Nov 1;222(3):iyac138.
doi: 10.1093/genetics/iyac138.

Complex genetics cause and constrain fungal persistence in different parts of the mammalian body

Affiliations

Complex genetics cause and constrain fungal persistence in different parts of the mammalian body

Martin N Mullis et al. Genetics. .

Abstract

Determining how genetic polymorphisms enable certain fungi to persist in mammalian hosts can improve understanding of opportunistic fungal pathogenesis, a source of substantial human morbidity and mortality. We examined the genetic basis of fungal persistence in mice using a cross between a clinical isolate and the lab reference strain of the budding yeast Saccharomyces cerevisiae. Employing chromosomally encoded DNA barcodes, we tracked the relative abundances of 822 genotyped, haploid segregants in multiple organs over time and performed linkage mapping of their persistence in hosts. Detected loci showed a mix of general and antagonistically pleiotropic effects across organs. General loci showed similar effects across all organs, while antagonistically pleiotropic loci showed contrasting effects in the brain vs the kidneys, liver, and spleen. Persistence in an organ required both generally beneficial alleles and organ-appropriate pleiotropic alleles. This genetic architecture resulted in many segregants persisting in the brain or in nonbrain organs, but few segregants persisting in all organs. These results show complex combinations of genetic polymorphisms collectively cause and constrain fungal persistence in different parts of the mammalian body.

Keywords: antagonistic pleiotropy; complex traits; fungal pathogens; host–pathogen; mammal–fungus interactions; mice; mouse–fungus interactions; yeast.


Figures

Fig. 1.
Fig. 1.
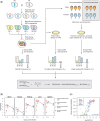
Experimental infections of mice using a pool of barcoded, haploid segregants. a) The workflow and general design of the experiment. Haploid BY and 3S strains were crossed, the resulting diploid was sporulated, and tetrads were dissected to generate a panel of 822 recombinant haploid progeny. These strains were then barcoded with unique 20-mer nucleotide sequences (barcodes) and pooled together (T0). The initial pool generated at T0 was used to infect mice by tail vein injection and simultaneously plated in triplicate onto control plates containing rich medium. At 3 time points postinfection, organ samples were also collected from infected mice and plated. After 2 days of growth, DNA was extracted from the yeast and sequenced to measure relative barcode abundance of each strain. DNA was also extracted from the T0 sample to measure barcode frequencies in the initial pool. For each strain, the change in normalized barcode frequency relative to T0 after correcting for on-plate growth was used to calculate persistence. b) CFU recovered from each organ sample across time points. Each panel shows the samples from a different organ. Color of each point corresponds to the sex and immunological state of the mouse from which the sample was recovered. Mean log10(CFU) over time is shown as a black line. c) Broad-sense heritability (H2) of each organ sample as a function of the CFU recovered from that sample. The color of each sample corresponds to organ type.
Fig. 2.
Fig. 2.
Organ type is the main driver of variation in persistence across samples. a) Heatmap showing persistence of strains (x-axis) across organ samples (y-axis). Samples are clustered by organ type and segregants. b) All pairwise comparisons of segregant persistence phenotypes between organs. Here, each segregant phenotype in an organ represents its average measurement across all samples with heritable differences in persistence. c) Comparison of segregants’ aggregate phenotypes in the brain and nonbrain samples.
Fig. 3.
Fig. 3.
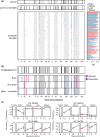
Identification of loci associated with persistence in the host in organ samples. a) Consolidated loci in the plate controls (top), consolidated loci across all organ samples (middle), and individual loci detected in each organ sample (bottom) shown in descending order from greatest to least number of loci detected. Corresponding broad-sense heritability (H2) measurements for each sample are shown to the right of each individual sample. Samples are colored by organ type. b) Loci detected in genome-wide scans using aggregate data across samples (top), followed by loci detected using mean segregant phenotypes in brain and nonbrain samples, as well as the difference in mean phenotype between brain and nonbrain samples (bottom). Pink loci have effects of the same sign in both brain and nonbrain samples, even if the effect was only significant in the brain or nonbrain samples (general). Blue loci have effects with opposite signs in brain and nonbrain samples (pleiotropic). * indicates 2 linked, but distinguishable, loci on chromosome XII. c) The effects of loci detected in whole-genome scans using aggregate data are shown. Effects were calculated as the mean persistence of strains with the 3S allele at the focal locus minus the mean persistence of strains with the BY allele after correction for on-plate growth. The effect of each locus after correcting for on-plate growth is also shown.
Fig. 4.
Fig. 4.
Identified loci show a mixture of general effects and antagonistic pleiotropy. a) The effect sizes of loci detected using aggregate phenotype data in the brain and nonbrain organs are shown on the x- and y-axes, respectively. Positive effect sizes mean that strains carrying the 3S allele were enriched in the samples while negative values mean that strains carrying the BY allele were enriched. Loci are colored by whether the same allele is beneficial in both brain and nonbrain samples (pink; general effects) or not (blue; antagonistic pleiotropy). Specific examples highlighted in panels (b)–(d). b) A locus with a general effect on persistence within the host. Brain (left) and nonbrain (right) phenotypes are plotted as a function of strain genotype at this locus. Positional information for the locus is denoted by bold text above the example. c) An antagonistically pleiotropic locus at which the BY allele is beneficial in the brain (left) and detrimental in other organs (right). d) An antagonistically pleiotropic locus at which the 3S allele is beneficial in the brain (left) and detrimental in other organs (right).
Fig. 5.
Fig. 5.
General and antagonistically pleiotropic loci collectively influence strain persistence in the host. a) Violin plots showing the mean strain phenotypes in the brain samples (left) and nonbrain samples (right) as a function of the number of generally beneficial alleles present in a segregant. Thresholds for strains considered to have a high or low number of general persistence alleles are represented by colored backgrounds. b) Violin plots showing the mean strain phenotypes in the brain (left) and nonbrain samples (right) as a function of the number of antagonistically pleiotropic brain alleles present in a strain. Thresholds for strains considered to have a higher or low number of alleles favoring persistence in the brain over other organs are represented by colored backgrounds. c) Plot showing mean change in enrichment in the brain samples over time relative to T1 measurements (bold lines) for strains that have a high or low number of generally beneficial alleles as well as a high or low number of alleles favoring persistence in the brain over other organs (according to thresholding in panels a and b). Error bars show the standard error about the mean enrichment of strains at 5 days postinfection. Faint lines show the enrichment over time of bootstrapped data (1,000 replicates). d) Plot showing mean enrichment in the nonbrain samples over time relative to day 1 measurements (bold lines) for strains that have a high or low number of generally beneficial alleles as well as a high or low number of alleles favoring persistence in the brain over other organs (according to thresholding in panels a and b). Error bars show the standard error about the mean enrichment of strains at 5 days postinfection. Faint lines show the enrichment over time of bootstrapped data (1,000 replicates).

Similar articles

Cited by

References

    1. Almeida F, Rodrigues ML, Coelho C.. The still underestimated problem of fungal diseases worldwide. Front Microbiol. 2019;10(214):214. doi:10.3389/fmicb.2019.00214. - DOI - PMC - PubMed
    1. Bayly JC, Douglas LM, Pretorius IS, Bauer FF, Dranginis AM.. Characteristics of Flo11-dependent flocculation in Saccharomyces cerevisiae. FEMS Yeast Res. 2005;5(12):1151–1156. doi:10.1016/j.femsyr.2005.05.004. - DOI - PubMed
    1. Bercusson A, de Boer L, Armstrong-James D.. Endosomal sensing of fungi: current understanding and emerging concepts. Med Mycol. 2017;55(1):10–15. doi:10.1093/mmy/myw072. - DOI - PubMed
    1. Bloom JS, Boocock J, Treusch S, Sadhu MJ, Day L, Oates-Barker H, Kruglyak L.. Rare variants contribute disproportionately to quantitative trait variation in yeast. eLife. 2019;8:e49212. doi:10.7554/eLife.49212. - DOI - PMC - PubMed
    1. Bloom JS, Ehrenreich IM, Loo WT, Lite T-LV, Kruglyak L.. Finding the sources of missing heritability in a yeast cross. Nature. 2013;494(7436):234–237. doi:10.1038/nature11867. - DOI - PMC - PubMed

Publication types