. 2022 Sep 29;185(20):3720-3738.e13.
doi: 10.1016/j.cell.2022.08.018. Epub 2022 Sep 13.

mTOR-regulated mitochondrial metabolism limits mycobacterium-induced cytotoxicity

Affiliations

mTOR-regulated mitochondrial metabolism limits mycobacterium-induced cytotoxicity

Antonio J Pagán et al. Cell. .

Abstract

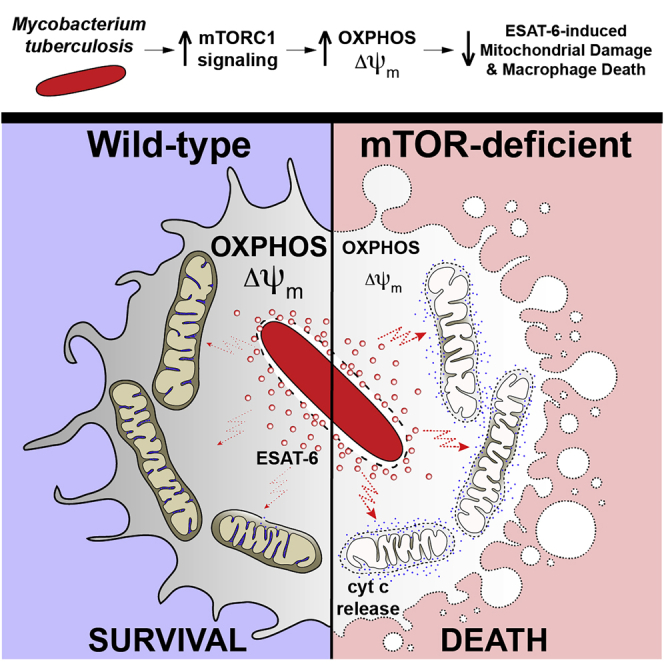
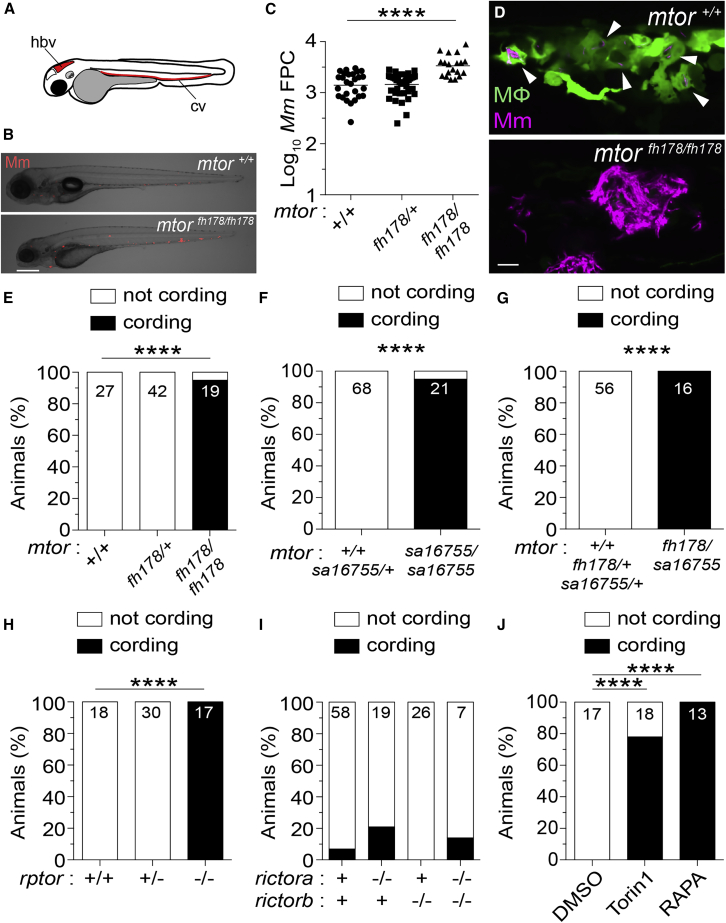
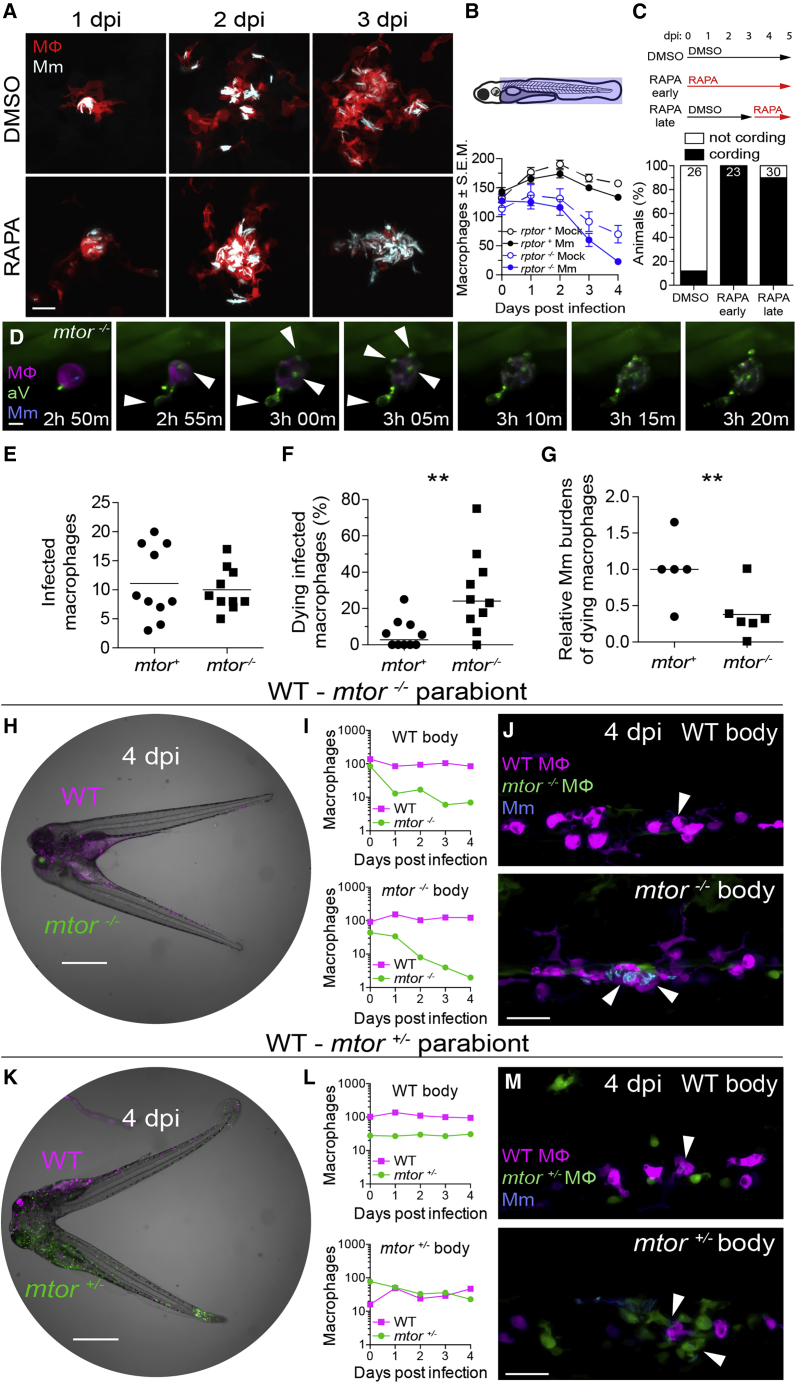
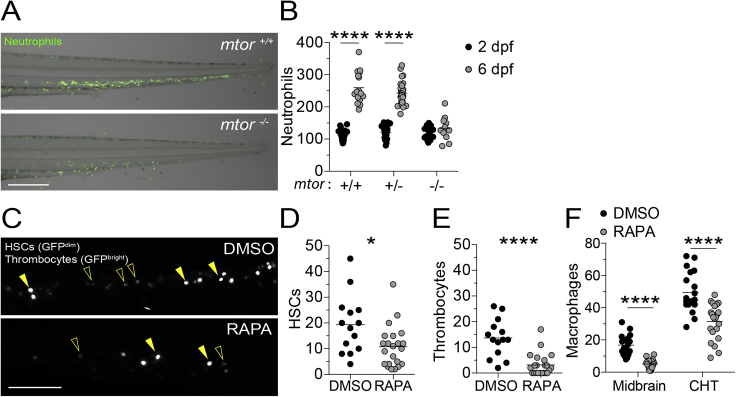
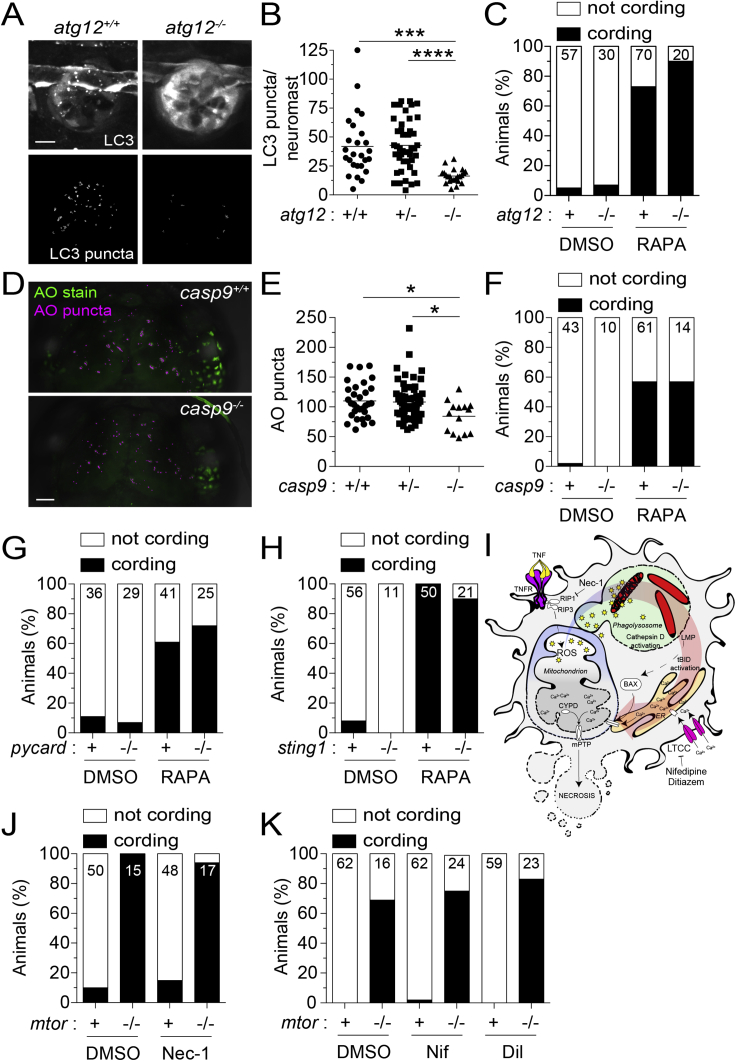
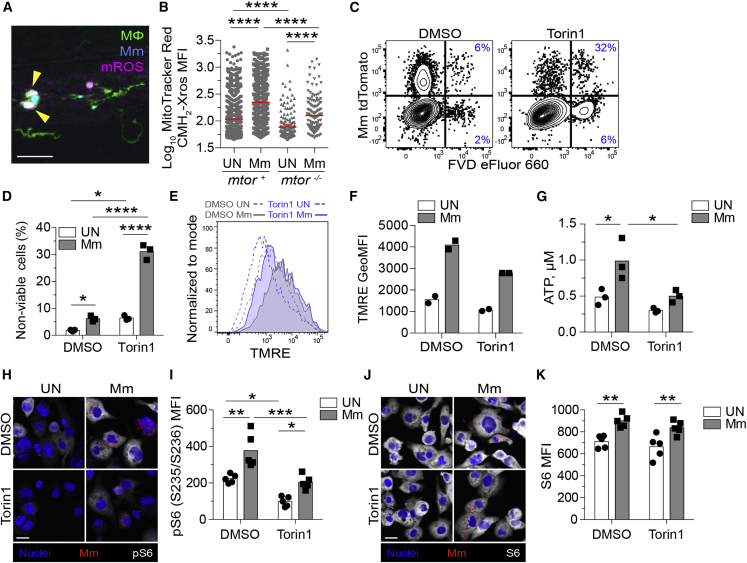
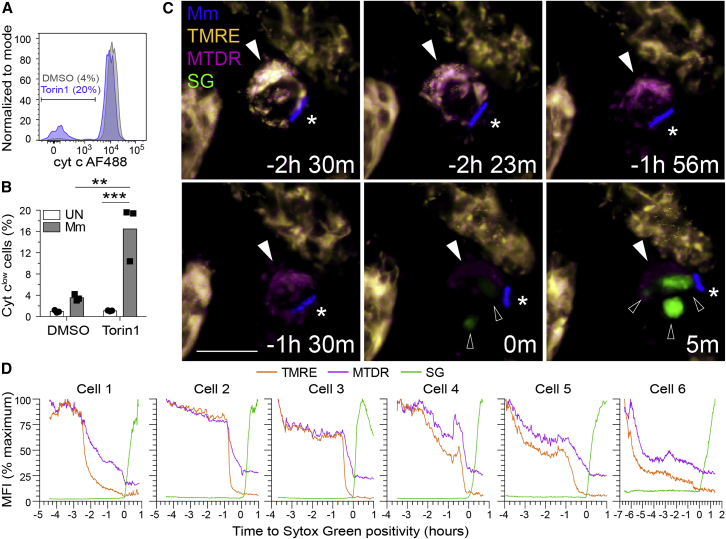
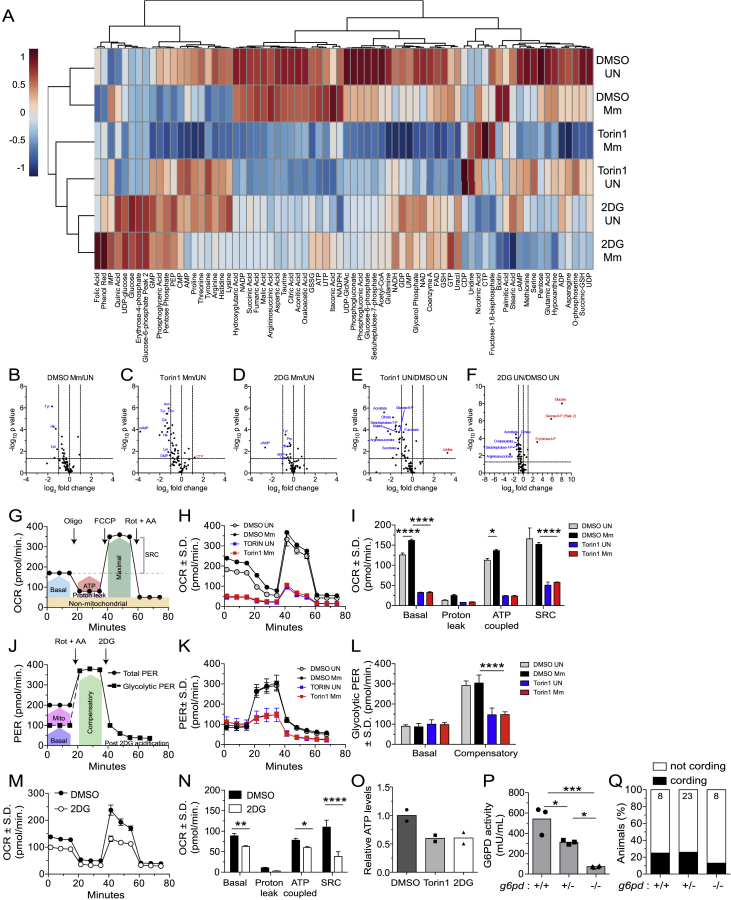
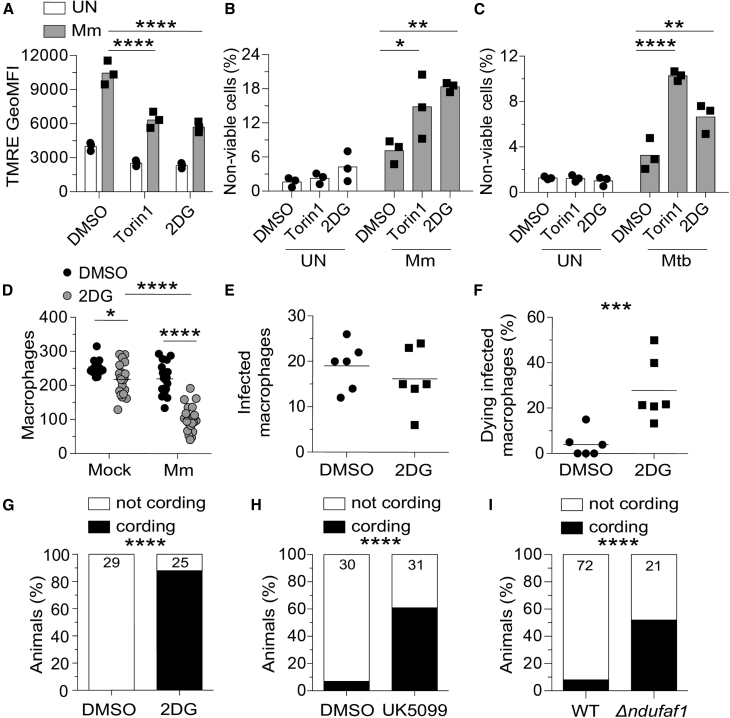
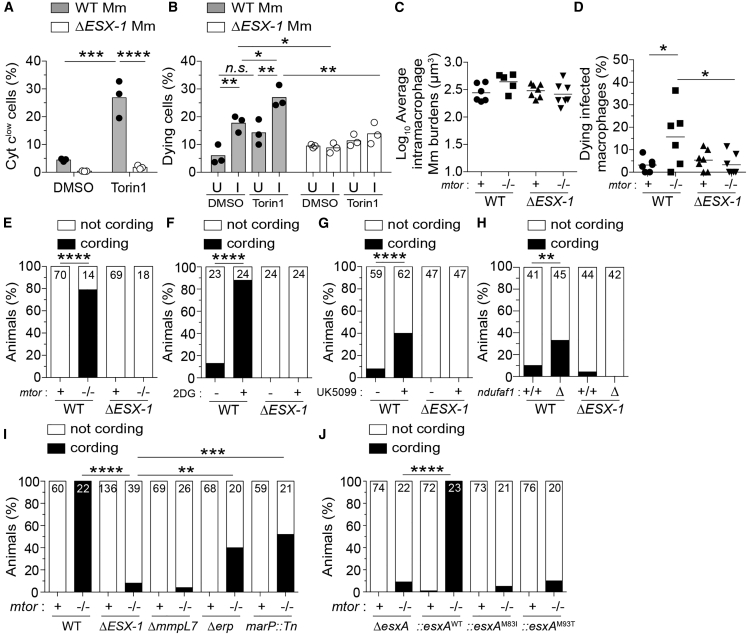
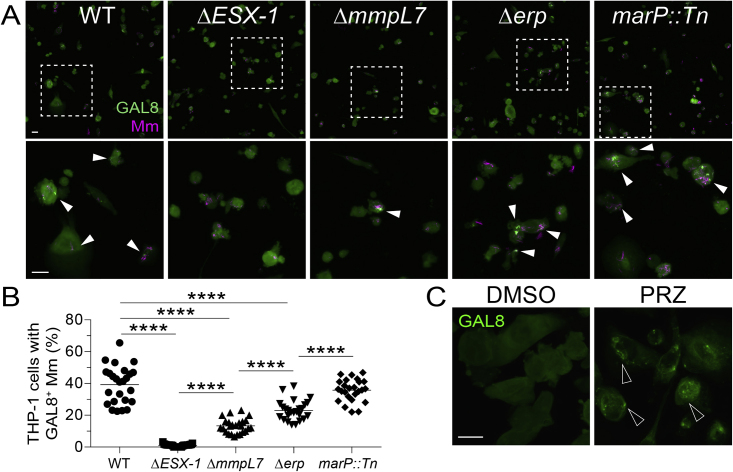
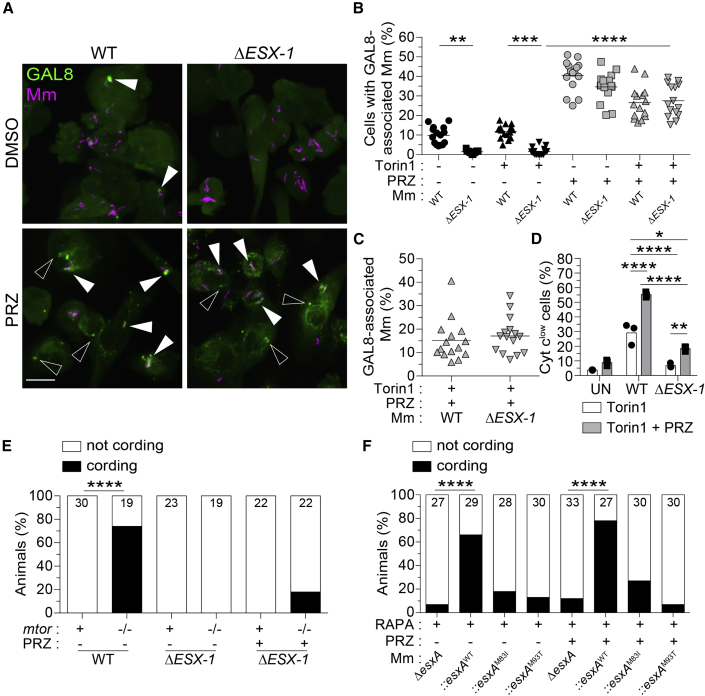
Necrosis of macrophages in the granuloma, the hallmark immunological structure of tuberculosis, is a major pathogenic event that increases host susceptibility. Through a zebrafish forward genetic screen, we identified the mTOR kinase, a master regulator of metabolism, as an early host resistance factor in tuberculosis. We found that mTOR complex 1 protects macrophages from mycobacterium-induced death by enabling infection-induced increases in mitochondrial energy metabolism fueled by glycolysis. These metabolic adaptations are required to prevent mitochondrial damage and death caused by the secreted mycobacterial virulence determinant ESAT-6. Thus, the host can effectively counter this early critical mycobacterial virulence mechanism simply by regulating energy metabolism, thereby allowing pathogen-specific immune mechanisms time to develop. Our findings may explain why Mycobacterium tuberculosis, albeit humanity's most lethal pathogen, is successful in only a minority of infected individuals.

Keywords: ESAT-6 mitotoxicity; Mycobacterium marinum; Mycobacterium tuberculosis; granuloma necrosis; mTOR; macrophage death; mitochondrial metabolism; oxidative phosphorylation; tuberculosis; zebrafish TB model.


Conflict of interest statement

Declaration of interests L.R. and E.L.P. are advisory board members for Cell. E.L.P. is a scientific advisory board member of ImmunoMet and a founder of Rheos Medicines. For the purpose of open access, the authors have applied for a CC BY public copyright license to any Author Accepted Manuscript version arising from this submission. This work is licensed under a Creative Commons Attribution 4.0 International License.

Figures

None
Graphical abstract
Figure 1
Figure 1
mTORC1-deficient zebrafish are hypersusceptible to Mm infection (A) Hindbrain ventricle (hbv) and caudal vein (cv) injection routes used in this study. Larvae were infected with ∼150 Mm expressing tdTomato (B), (C), and (E–J) or tdKatushka2 (D) fluorescent proteins via the caudal vein 2 days post-fertilization (dpf). (B) Overlaid micrographs of widefield mycobacterial fluorescence (Mm, red) and bright field in mtorfh178/fh178 or WT siblings (mtor+/+) 4 days post-infection (dpi). (C) Quantification of bacterial fluorescence (fluorescent pixel counts [FPCs]) in animals from mtorfh178/+ incross 4 dpi. Symbols represent individual animals. Horizontal lines indicate mean values. (D) Confocal micrograph optical sections of mtorfh178/fh178 and a WT sibling expressing Tg(mpeg1:YFP) 4 dpi, showing a granuloma in the WT animal and mycobacterial cording in the mtorfh178/fh178 animal. Mm (magenta) and macrophages (green) are shown. Arrowheads indicate intracellular Mm. (E–J) Mycobacterial cording in animals from (E) mtorfh178/+ incross, (F) mtorsa16755/+ incross, (G) mtorfh178/+ × mtorsa16755/+ cross, and (H) rptorsa11537/+ incross at 4 dpi, and (I) rictorasa15967/+; rictorbsa18403/+ double heterozygote incross and (J) WT animals treated with torin1 (400 nM), rapamycin (400 nM), or 0.5% DMSO (vehicle control) 5 dpi. (E–J) Numbers within columns indicate animals per group. Scale bars: 300 μm in (B) and 25 μm in (D). Statistical analyses, (C) one-way ANOVA with Tukey’s post-test and (E–J) Fisher’s exact test. Data are representative of two or more independent experiments.
Figure 2
Figure 2
mTOR deficiency impairs macrophage development and survival and sensitizes infected macrophages to mycobacterium-induced cytotoxicity Larvae were infected with Mm expressing BFP2 (A), (E), and (I–N), mWasabi (C and D), or tdKatushka2 (F–H) fluorescent proteins via the hindbrain ventricle (A) or the caudal vein (B–N) 2 dpf. (A) Serial confocal micrographs of granulomas in Tg(mfap4:tdTomato-CAAX) zebrafish treated with rapamycin or DMSO. Mm (cyan), macrophages (red). (B) (Top) Macrophage counting region (shaded light blue). (Bottom) Numbers of macrophages in Mm- and mock-infected Raptor mutants and siblings expressing Tg(mpeg1:tdTomato). Symbols indicate mean values for each group. Error bars show SEM. (C) (Top) Duration of rapamycin and DMSO treatments. (Bottom) Mycobacterial cording 5 dpi. (D) Time-lapse confocal micrographs of a dying infected macrophage in an mtorsa16755/sa16755; Tg(mfap4:tdTomato-CAAX); Tg(ubb:secA5-YFP) animal 2 dpi. Mm (blue), secreted annexin V-YFP (green), macrophage (magenta), annexin V+ blebs (arrowheads). See Video S1. (E–G) 6-h time-lapse confocal microscopy of mtorfh178/fh178 and mTOR-sufficient siblings expressing Tg(mpeg1:YFP) 2 dpi. See Video S2. (E) Absolute numbers of infected macrophages per field. (F) Percentage of dying infected macrophages per field. (G) Relative mycobacterial burdens in dying macrophages of mtor−/− and mTOR-sufficient fish. Bacterial volumes were normalized to values obtained from dying cells in mTOR-sufficient controls for each imaging run. (H) Widefield micrograph of parabiotic zebrafish comprised of conjoined WT Tg(mpeg1:tdTomato) and mtorfh178/fh178; Tg(mpeg1:YFP) embryos 4 dpi. (I) Absolute numbers of macrophages in the WT body (top) and mtor−/− body (bottom) of WT-mtor−/− parabiont. (J) Maximum intensity projections of infections in the WT body (top) and mtor−/− body (bottom) of a WT-mtor−/− parabiont 4 dpi. (K) Widefield micrograph of WT Tg(mpeg1:tdTomato) and mtorfh178/+; Tg(mpeg1:YFP) parabiont 4 dpi. (L) Absolute numbers of macrophages in the WT body (top) and mtor+/− body (bottom) of WT-mtor+/− parabiont. (M) Maximum intensity projections of infections in the WT body (top) and mtor+/− body (bottom) of a WT-mtor+/− parabiont 4 dpi. Scale bars: 25 μm in (A), 10 μm in (D), 400 μm in (H) and (K), and 50 μm in (J) and (M). Horizontal lines indicate mean (E) and (G) or median (F) values. Statistical analyses, (E–G) two-tailed, unpaired Student’s t test. Time lapse data were pooled from five (E and F) or three (G) independent experiments. See also Figures S1 and S2.
Figure S1
Figure S1
mTOR deficiency impairs hematopoiesis in zebrafish, related to Figure 2 (A) Overlaid widefield fluorescence and bright-field micrographs of an mtorfh178/fh178 animal and wild-type sibling expressing the neutrophil-specific fluorescent reporter Tg(lysC:EGFP) 6 dpf (Hall et al., 2007). (B) Numbers of neutrophils in the caudal hematopoietic tissue (CHT) of animals from mtorfh178/+; Tg(lysC:EGFP) incross 2 and 6 dpf. (C–F) Zebrafish embryos were manually dechorionated and treated with 400 nM rapamycin or 0.5% DMSO on 1 dpf to block primitive and intermediate waves of hematopoiesis (Clements and Traver, 2013). (C) Confocal micrographs of the CHT of Tg(cd41:GFP) zebrafish at 2 dpf. Hematopoietic stem cells (HSCs, open arrowheads) and thrombocytes, nucleated counterparts of platelets in non-mammalian vertebrates, (filled arrowheads) were identified by low versus high level expression of cd41:GFP, respectively (Lin et al., 2005; Ma et al., 2011). (D) Numbers of HSCs in the CHT of 2 dpf animals. (E) Numbers of thrombocytes in the CHT of 2 dpf animals. (F) Numbers of macrophages in the midbrain and CHT of Tg(mpeg1:YFP) zebrafish 2 dpf. Scale bars: 300 μm in (A) and 100 μm in (C). (B and D–F) Symbols represent individual animals. Horizontal lines indicate means. Statistical analyses, (B) two-way ANOVA with Tukey’s post-test and (D–F) unpaired Student’s t test.
Figure S2
Figure S2
Inhibition of autophagic cell death, mitochondrial apoptosis, or TNF-associated necrosis does not prevent mycobacterium-induced macrophage death in mTOR-deficient animals, related to Figures 2 and 3 (A) Confocal micrographs of LC3 aggregation in neuromasts, clusters of mechanosensory cells of the fish lateral line, from atg12sa42684 incross fish expressing Tg(CMV:lc3b-GFP) 5 dpf. GFP fluorescence (top) and surface-rendered puncta (bottom) are shown. Scale bar, 10 μm. (B) Number of LC3 puncta per neuromast. (C) Cording in rapamycin- or DMSO-treated atg12sa42684 incross fish 5 dpi. (D) Confocal micrographs of acridine orange (AO) staining (green) and surface-rendered puncta (magenta) in the midbrain of casp9sa11164 incross fish 3 dpf. Scale bars, 50 μm. (E) Number of AO puncta in the midbrain. (F) Cording in rapamycin- or DMSO-treated casp9sa11164 incross fish 5 dpi. (G) Cording in rapamycin- and DMSO-treated pycardw216/w216 (Asc-deficient) animals and siblings 4 dpi. (H) Cording in rapamycin- and DMSO-treated sting1sa35634 (Sting-deficient) animals and WT siblings 5 dpi. (I) Necrosis pathway induced by mycobacterial infection plus excess TNF and pharmacological interventions tested. (J and K) Mycobacterial cording in mtorfh178/+ incross fish treated with (H) necrostatin-1, (I) nifedipine (5 μM), diltiazem (10 μM), or 0.5% DMSO 4 dpi. Symbols represent individual (B) neuromasts or (E) animals. (B and E) Horizontal lines indicate mean values. (C, F–H, J, and K) Numbers within columns indicate animals per group. (B and E) One-way ANOVA with Tukey’s post-test.
Figure 3
Figure 3
mTOR deficiency impairs basal and mycobacterium-stimulated mitochondrial metabolism in macrophages (A and B) mtorfh178/fh178 and mTOR-sufficient siblings expressing Tg(mpeg1:YFP) were infected intravenously with Mm expressing BFP2 on 2 dpf and injected intravenously with MitoTracker Red CMH2-Xros 1 day later. (A) Confocal micrograph illustrating mROS detection in an infected animal. Macrophages (green), Mm (blue), mROS (magenta), mROS-producing infected cells (arrowheads). Scale bar, 20 μm. (B) MitoTracker Red CMH2-Xros mean fluorescence intensity (MFI) in infected and uninfected macrophages of mtor−/− animals and siblings at 1 dpi. Symbols represent individual macrophages. Horizontal lines indicate mean values. (C–K) THP-1 macrophages were treated with torin1 or DMSO and infected with (C, D, G, and H–K) tdTomato- or (E and F) mWasabi-expressing Mm at a multiplicity of infection (MOI) of 1 (C–F) or 3 (G and H–K). (C) Flow cytometry plots of cell viability 2 dpi. Percentages of non-viable cells (FVD eFluor 660+) in the infected and uninfected subpopulations are shown. (D) Quantification of non-viable cells. Symbols represent values from individual wells. Bars indicate mean values. (E) Flow cytometry histograms of TMRE fluorescence 1 dpi. (F) TMRE geometric mean fluorescence intensities (GeoMFIs) 1 dpi. Symbols represent values from individual wells. Bars indicate mean values. (G) ATP concentration per well containing 106 THP-1 macrophages 1 dpi. (H–K) 1 dpi THP-1 macrophage cultures infected with tdTomato-expressing Mm (MOI = 2) were treated with torin1 or DMSO for 4 h in serum-free media.Confocal micrographs depicting Hoechst-stained nuclei (blue), Mm (red), and (H) phospho-S6S235/S236 or (J) total S6 staining (white). Scale bars, 20 μm. (I and K) Mean fluorescent intensity (MFI) of (I) phospho-S6S235/S236 and (K) total S6 staining in uninfected and infected cells. Bars indicate group means. Symbols depict average MFI per field. Statistical analyses, (B) one-way or (D), (G), (I), and (K) two-way ANOVA with Tukey’s post-test. (A), (B), and (H–K) Data are representative of two experiments. See also Figure S2.
Figure 4
Figure 4
mTOR deficiency promotes mycobacterium-induced, mitochondrially mediated cell death (A and B) THP-1 macrophages were infected with (A and B) tdTomato- or (C and D) BFP-expressing Mm at MOI = 3. (A) Flow cytometry histograms of cytochrome c (cyt c) fluorescence in infected viable cells (FVD eFluor 660) 7 h post-infection (hpi). Gate indicates cells that have released cyt c. (B) Quantification of cyt clow cells 7 hpi. (C and D) Torin1-treated THP-1 macrophages were labeled with TMRE and MitoTracker Deep Red prior to imaging in the presence of Sytox Green 32 hpi. See Video S3 and Figure S2. (C) Confocal micrographs of a dying infected macrophage (filled arrowhead) surrounded by surviving uninfected macrophages. Mm (asterisk), Sytox Green (open arrowheads). Scale bars, 10 μm. (D) MFI of TMRE, MitoTracker Deep Red, and Sytox Green staining of dying infected macrophages over time. Key time-lapse frames for cell 1 are shown in (C). Statistical analyses, (B) two-way ANOVA with Tukey’s post-test.
Figure S3
Figure S3
mTOR inhibition impairs glycolysis and mitochondrial metabolism, related to Figure 5 (A) Metabolite profiles of uninfected and Mm-infected THP-1 macrophages 1 dpi (MOI = 1). Cell were treated with torin1 (400 nM), 2DG (5 mM), or 0.5% DMSO for 1.5 days prior to harvest. Heat map scale indicates relative log2 expression levels. See also Table S1. (B–F) Volcano plots of differences in metabolite abundances induced by the indicated treatments. Dashed lines indicate fold-change and p value cutoffs. (G) Diagram of mitochondrial oxygen consumption rate (OCR) assay. (H) OCR kinetics of torin1 or DMSO-treated THP-1 macrophages 1 dpi (Mm, MOI = 4). (I) Modular analysis of mitochondrial OCR. (J) Diagram of glycolytic proton efflux rate (PER) assay. (K) PER kinetics of torin1 or DMSO-treated THP-1 macrophages 1 dpi (Mm, MOI = 4). (L) Basal and compensatory glycolytic PER. (M) OCR kinetics of uninfected THP-1 macrophages treated with 2DG or DMSO for 1.5 days. (N) Modular analysis of mitochondrial OCR. (O) Relative ATP levels in THP-1 macrophage cultures 1.5 days after treatment. (P) Glucose-6-phosphate dehydrogenase (G6PD) activity in 5 dpf animals from g6pdsa24272/+ incross. (Q) Cording in animals from g6pdsa24272/+ incross 5 dpi. Symbols represent (B–F) individual metabolites, (H, K, and M) mean values, (O) individual wells, or (P) individual animals. (I, L, and N–P) Bars indicate mean values. (H, I, and K–N) Error bars depict standard deviation. (G and J) Arrows indicate the time of compound injection. Abbreviations: rotenone plus antimycin A (Rot + AA), 2DG, oligomycin (Oligo), carbonyl cyanide 4-(trifluoromethoxy)phenylhydrazone (FCCP), compensatory glycolysis (Comp), spare respiratory capacity (SRC). Statistical significance, (B–F) unpaired Students’ t test, one-way ANOVA with (I, L, and N) Sidak or (P) Tukey’s post-tests.
Figure 5
Figure 5
Glycolysis inhibition impairs mitochondrial metabolism and sensitizes infected macrophages to mycobacterium-induced cytotoxicity (A–C) THP-1 macrophages treated with torin1 (400 nM), 2-deoxy-D-glucose (2DG, 5 mM), or DMSO were infected with Mm expressing (A) BFP2, (B) tdTomato, or (C) Mtb expressing tdTomato (MOI = 1). (A) TMRE GeoMFI 1 dpi. (B and C) Percentage of non-viable cells (FVD eFluor 660+) 1 dpi. (D–I) Zebrafish were infected with ∼150 fluorescent Mm via the caudal vein. (D) 5 dpi macrophage numbers in the body of mock- or Mm-infected Tg(mpeg1:YFP) zebrafish fish treated with 50 mM 2DG or 0.5% DMSO. (E and F) 6-h time-lapse confocal microscopy of Tg(mpeg1:YFP) 3 dpi. (E) Absolute numbers of infected macrophages per field. (F) Percentage of dying infected macrophages per field. See Video S3. (G) Cording in wild-type (WT) animals treated with 2DG or DMSO 5 dpi. (H) Cording in WT animals treated with UK5099 (10 μM) or 0.5% DMSO 5 dpi. (I) Cording in ndufaf1 G0 crispants and WT siblings 5 dpi. Symbols represent values from individual (A–C) and (K) wells or (D–F) animals. (A–C) Bars and (D–F) horizontal lines indicate mean values. (G–I) Numbers within columns indicate animals per group. Statistical analyses, one-way ANOVA with (A–C) Sidak, (D) Tukey post-tests, (E and F) unpaired Student’s t test, or (G–I) Fisher’s exact test. (E and F). Time-lapse data were pooled from two independent experiments. Data are representative of (A), (G), and (H), two independent experiments. See also Figure S3.
Figure 6
Figure 6
Deficiencies in mTOR, glycolysis, and OXPHOS sensitize macrophages to mycobacterial ESAT-6-dependent cytotoxicity (A) Cytochrome c release 7 hpi in THP-1 macrophages infected with BFP2-expressing WT or ΔESX-1 Mm at MOI = 3. (B) Percentage of dying cells (Sytox Green+) during 4-h time-lapse at 1 dpi with tdTomato-expressing WT or ΔESX-1 Mm at MOI = 1. Values from uninfected (U) and infected (I) cells from the same fields are shown. See Video S4. (C–J) Zebrafish were infected with dose-matched inocula of tdTomato-expressing Mm of the indicated strains via the caudal vein. (C) Intramacrophage Mm burdens at the beginning of 6-h time-lapse confocal microscopy of mtorfh178/fh178 and mtor-sufficient siblings expressing Tg(mpeg1:YFP) 2 dpi. See Video S5. (D) Percentage of dying infected macrophages in same experiment shown in (C). See Video S5. (E) Cording in mtorfh178/fh178 animals and mtor-sufficient siblings 4 dpi. (F and G) Cording in WT zebrafish treated with 2DG, UK5099, or DMSO 5 dpi. (H) Cording in ndufaf1 G0 crispants and WT siblings 5 dpi. (I) Cording in mtorsa16755/sa16755 animals and mtor-sufficient siblings 4 dpi. See also Figure S3. (J) Cording in mtorfh178/fh178 animals and mtor-sufficient siblings 4 dpi with ΔesxA Mm complemented with WT or point mutant Mtb esxA. Symbols represent values from individual (A) wells, (B) imaging fields, or (C) animals. (A and B) Bars and (C and D) horizontal lines indicate mean values. (E–J) Numbers within columns indicate animals per group. Statistical analyses, (A–D) one-way ANOVA with Sidak’s post-test or (E–J) Fisher’s exact test. (B, E, and H) Data are representative of two experiments. Zebrafish time-lapse data were pooled from four experiments. See also Figure S4.
Figure S4
Figure S4
Damage of phagosomal/lysosomal compartments by ESX-1-competent mycobacteria and the drug prazosin, related to Figures 6 and 7 (A) Confocal micrographs of galectin-8 (GAL8) immunofluorescence (green) and Mm fluorescence (magenta) in THP-1 macrophages infected with the indicated Mm strains (MOI = 1) 1 dpi. The ΔmmpL7 Mm strain is defective in PDIM transport to the myco-membrane. Bottom panels show area enclosed in dashed squares on top panels. Arrowheads indicate foci of GAL8-associated Mm. Scale bars, 25 μm. (B) Percentage of macrophages with foci of GAL8-associated Mm. Symbols represent values from individual imaging fields. Horizontal bars indicate mean values. One-way ANOVA with Tukey’s post-test. (C) Confocal micrographs of GAL8 immunofluorescence 7 h after treatment with prazosin (PRZ, 20 μM) or 0.5% DMSO. Arrowheads indicate GAL8 puncta. Scale bars, 20 μm.
Figure 7
Figure 7
ESAT-6 mediates mitochondrial damage in mTOR-deficient macrophages downstream of its involvement in phagosomal permeabilization (A–E) Torin1- and DMSO-treated THP-1 macrophages were infected with tdTomato-expressing WT or ΔESX-1 Mm at MOI = 3 and treated with prazosin (PRZ, 20 μM) for 7 h. See also Figure S4. (A) Confocal micrographs of galectin-8 (GAL8) immunofluorescence (green) and Mm fluorescence (magenta) in THP-1 macrophages 7 hpi. GAL8 foci associated with Mm (filled arrowheads) or not associated with Mm (open arrowheads) are shown. Scale bar, 20 μm. (B) Percentage of macrophages with GAL8-associated Mm foci. (C) Percentage of Mm volume associated with GAL8 foci 7 hpi. (D) Percentage of cells that have released cytochrome c 7 hpi. (E) mtorsa16755/sa16755 fish and mtor-sufficient siblings were infected with ∼90 fluorescent Mm via the hindbrain ventricle on 2 dpf. On 1 and 2 dpi, animals were injected with ∼3 nL of 300 μM PRZ or 1% DMSO into the hbv. Graph indicates the percentage of animals with cording 3 dpi. (F) Wild-type fish treated with 400 nM rapamycin were infected with ∼180 tdTomato-expressing ΔesxA Mm complemented with WT or point mutant Mtb esxA via the hbv on 2 dpf. Animals were injected with PRZ or DMSO as indicated on (E). Graph indicates the percentage of animals with cording 3 dpi. Symbols represent values from individual (B and C) imaging fields or (D) individual wells. (B and C) Horizontal lines and (D) bars indicate mean values. (E and F) Numbers within columns indicate animals per group. Statistical analyses, (B and D) one-way ANOVA with Sidak’s post-test or (E and F) Fisher’s exact test. See also Figure S4.

References

    1. Amaral E.P., Costa D.L., Namasivayam S., Riteau N., Kamenyeva O., Mittereder L., Mayer-Barber K.D., Andrade B.B., Sher A. A major role for ferroptosis in Mycobacterium tuberculosis-induced cell death and tissue necrosis. J. Exp. Med. 2019;216:556–570. doi: 10.1084/jem.20181776. - DOI - PMC - PubMed
    1. Armstrong J.A., Hart P.D. Response of cultured macrophages to Mycobacterium tuberculosis, with observations on fusion of lysosomes with phagosomes. J. Exp. Med. 1971;134:713–740. doi: 10.1084/jem.134.3.713. - DOI - PMC - PubMed
    1. Augenstreich J., Arbues A., Simeone R., Haanappel E., Wegener A., Sayes F., Le Chevalier F., Chalut C., Malaga W., Guilhot C., et al. ESX-1 and phthiocerol dimycocerosates of Mycobacterium tuberculosis act in concert to cause phagosomal rupture and host cell apoptosis. Cell. Microbiol. 2017;19:e12726. doi: 10.1111/cmi.12726. - DOI - PubMed
    1. Bao Y., Wang L., Sun J. A small protein but with diverse roles: a review of EsxA in mycobacterium-host interaction. Cells. 2021;10:1645. doi: 10.3390/cells10071645. - DOI - PMC - PubMed
    1. Barker L.P., George K.M., Falkow S., Small P.L. Differential trafficking of live and dead Mycobacterium marinum organisms in macrophages. Infect. Immun. 1997;65:1497–1504. doi: 10.1128/iai.65.4.1497-1504.1997. - DOI - PMC - PubMed

Publication types

Substances