. 2022 Sep 14;5(12):e202201501.
doi: 10.26508/lsa.202201501.

Mesenchymal stem cells derived from patients with premature aging syndromes display hallmarks of physiological aging

Affiliations

Mesenchymal stem cells derived from patients with premature aging syndromes display hallmarks of physiological aging

Jean Philippe Trani et al. Life Sci Alliance. .

Abstract

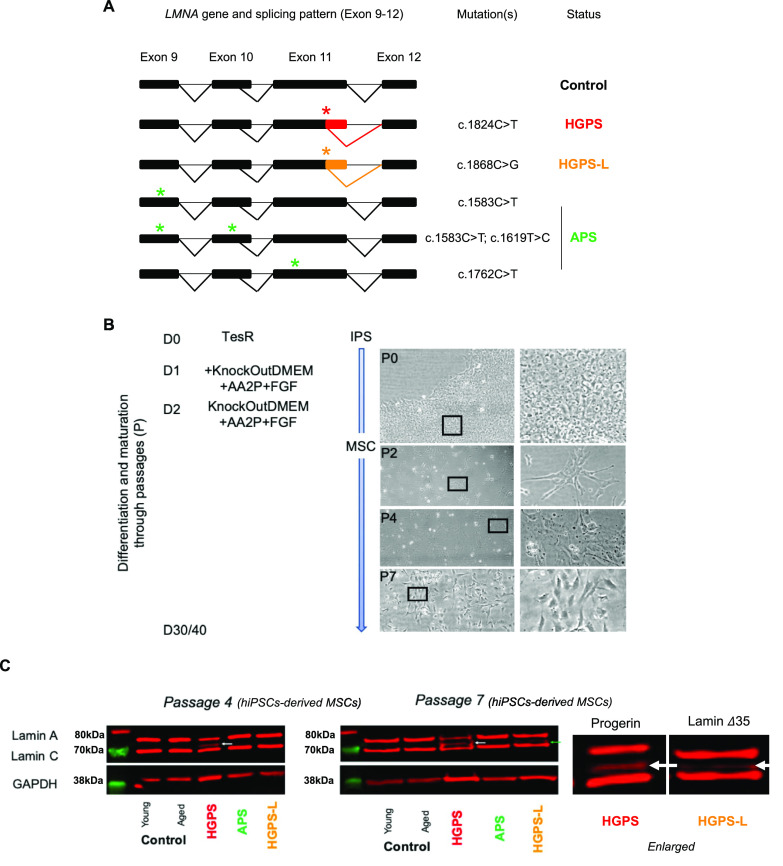
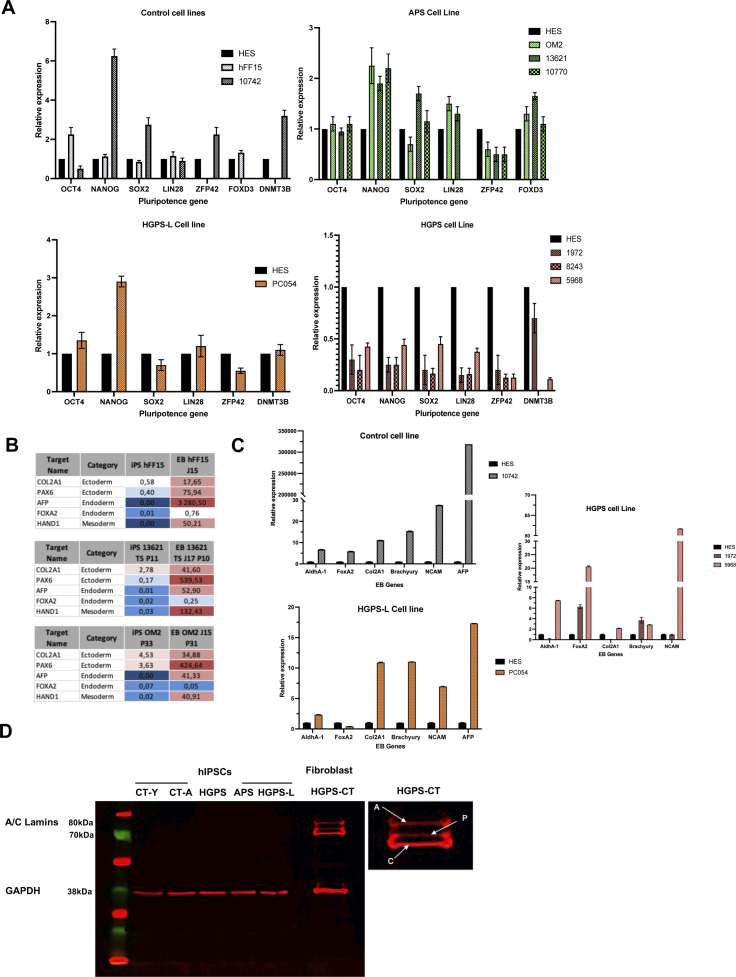
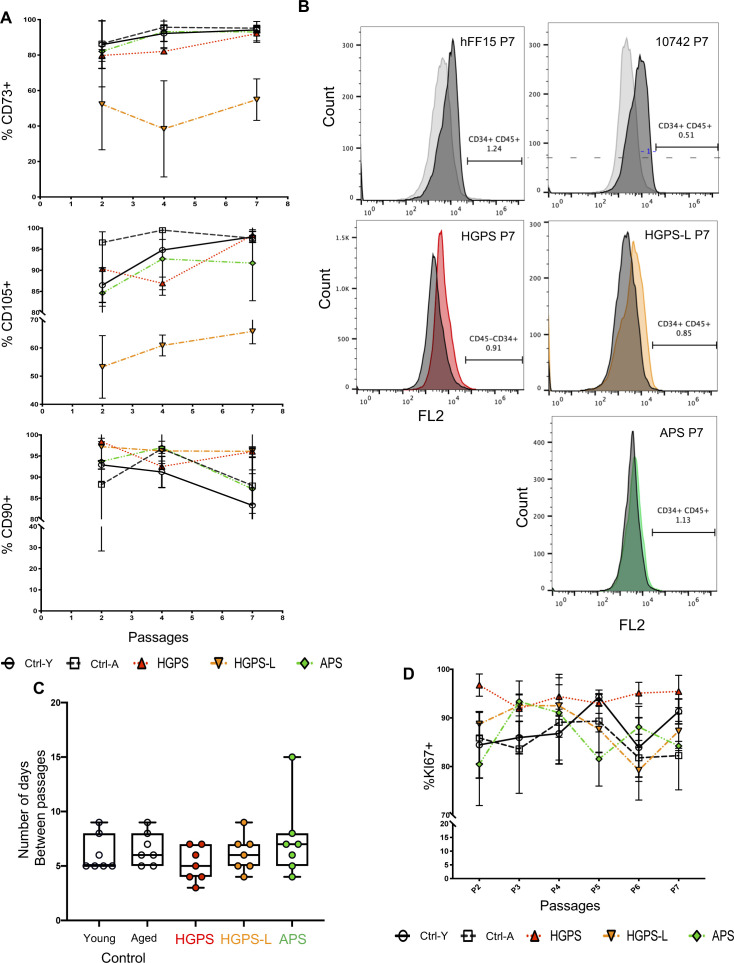
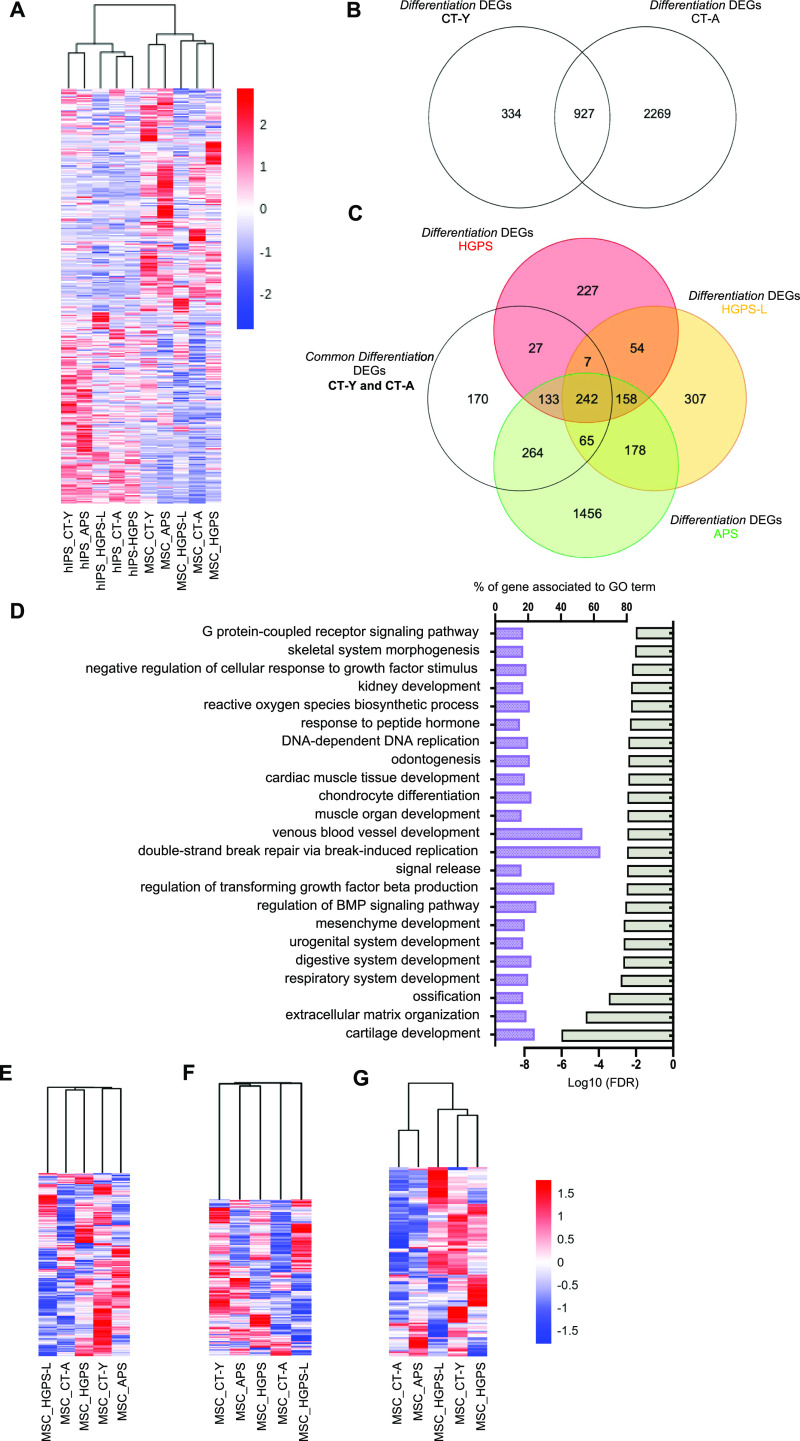
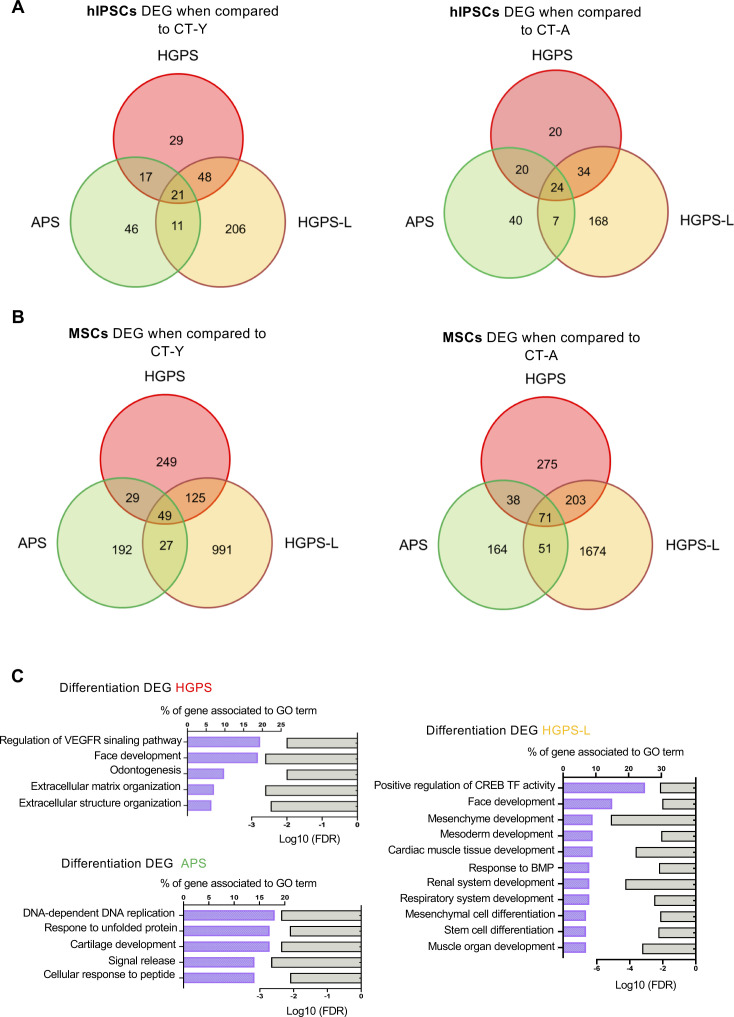
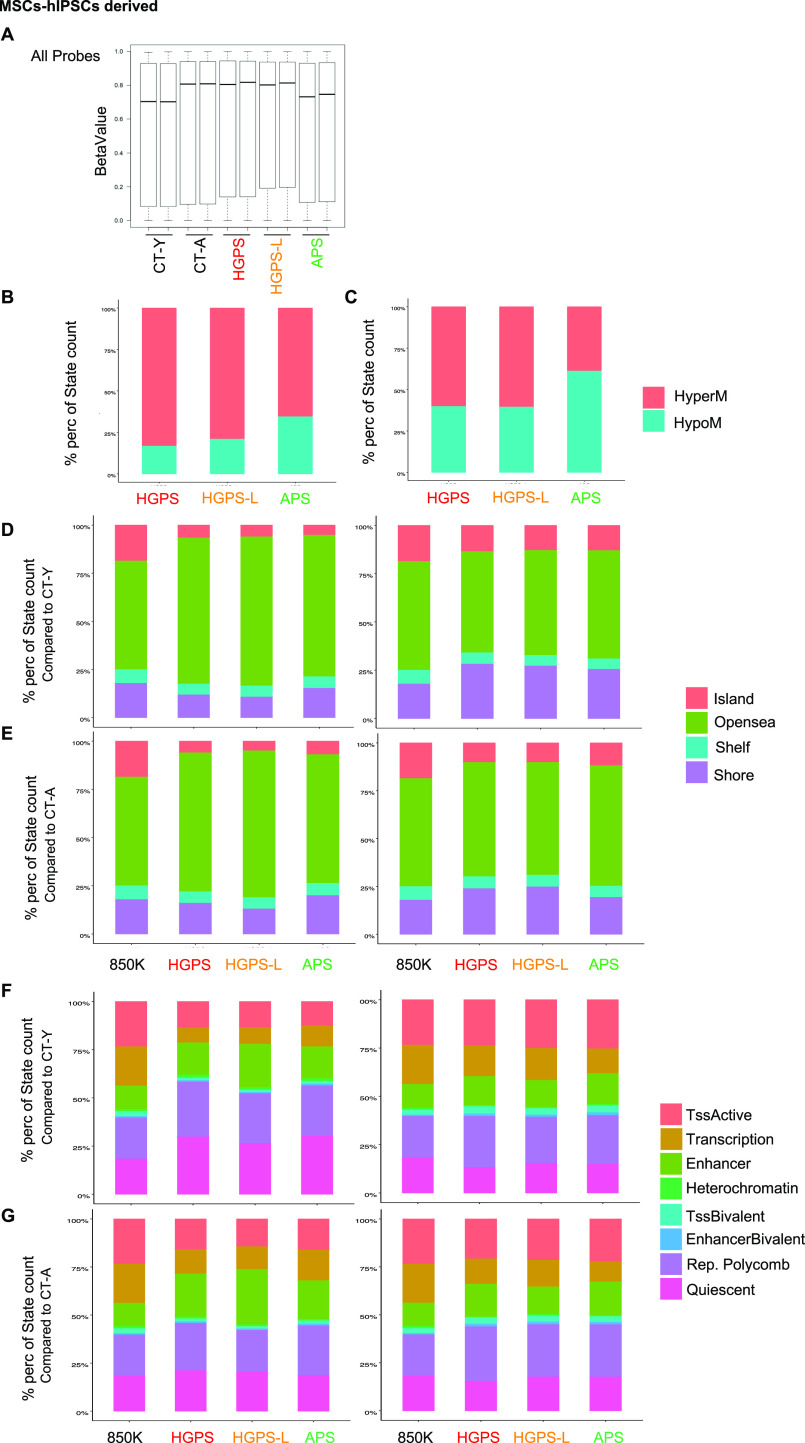
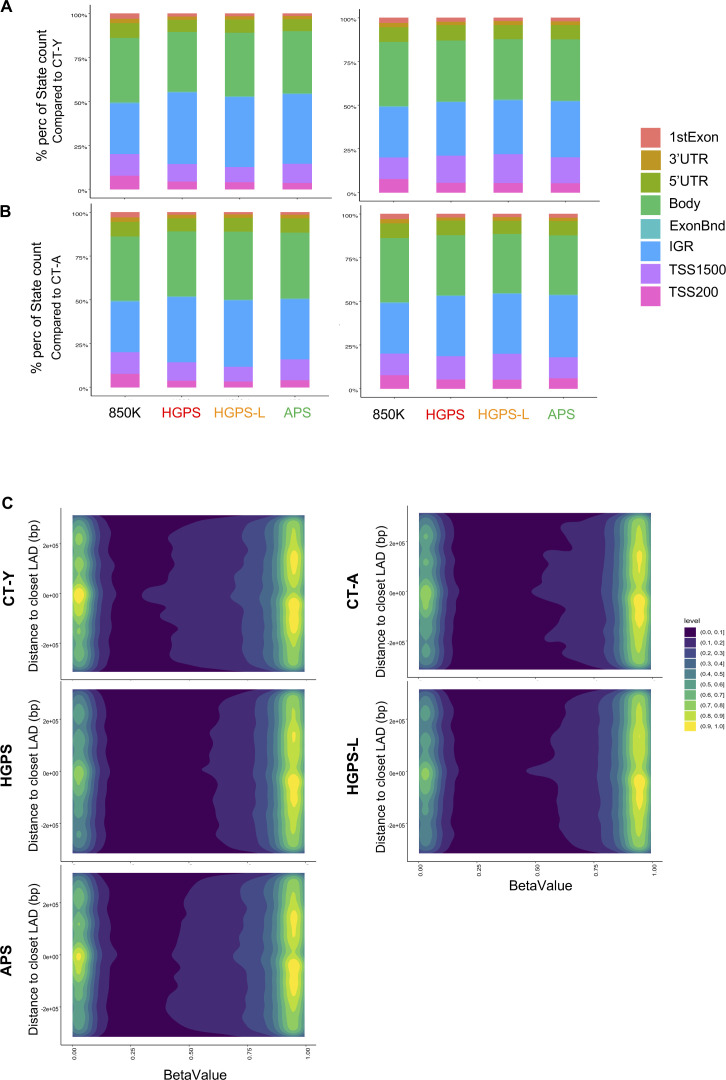
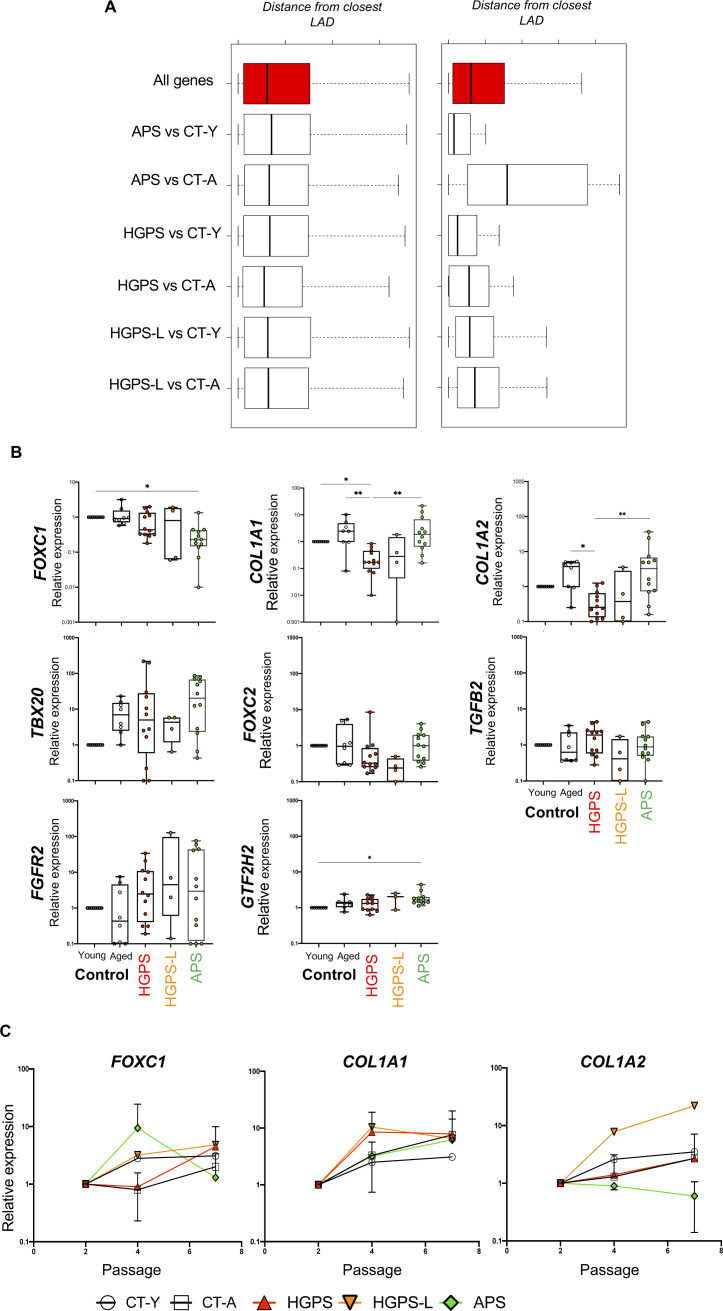
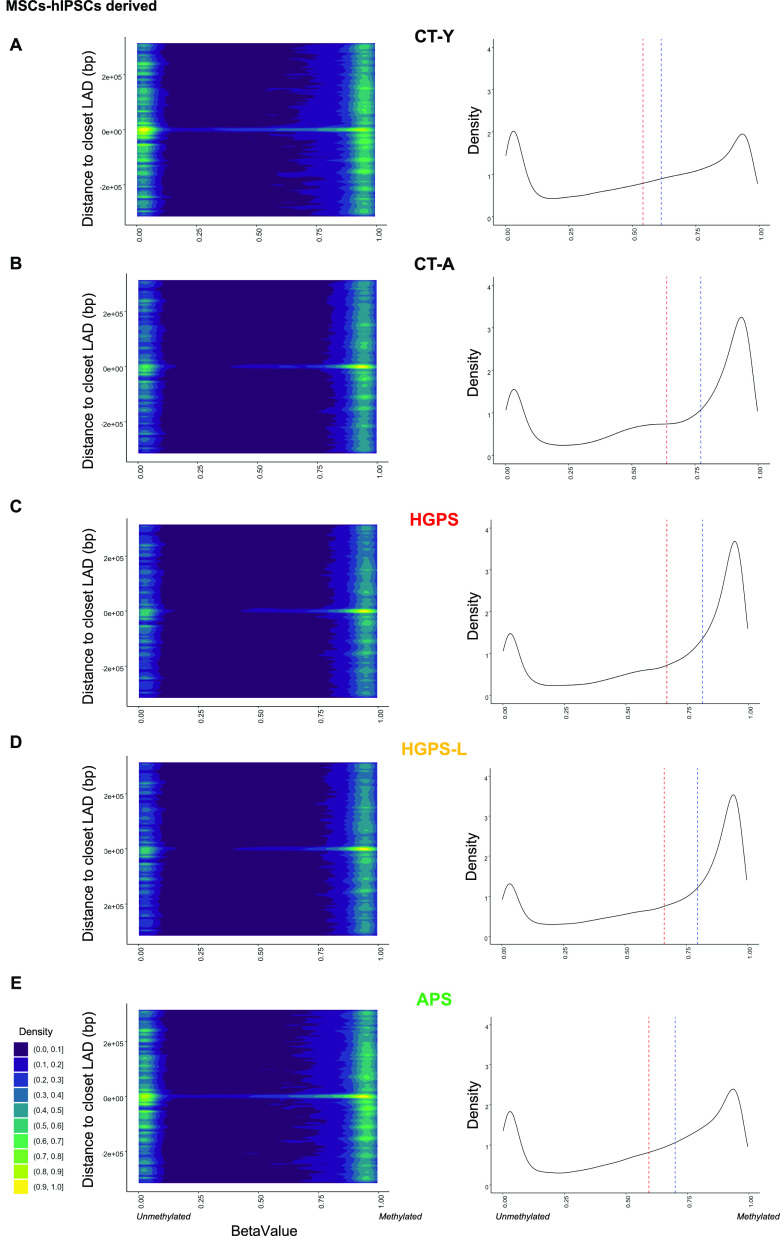
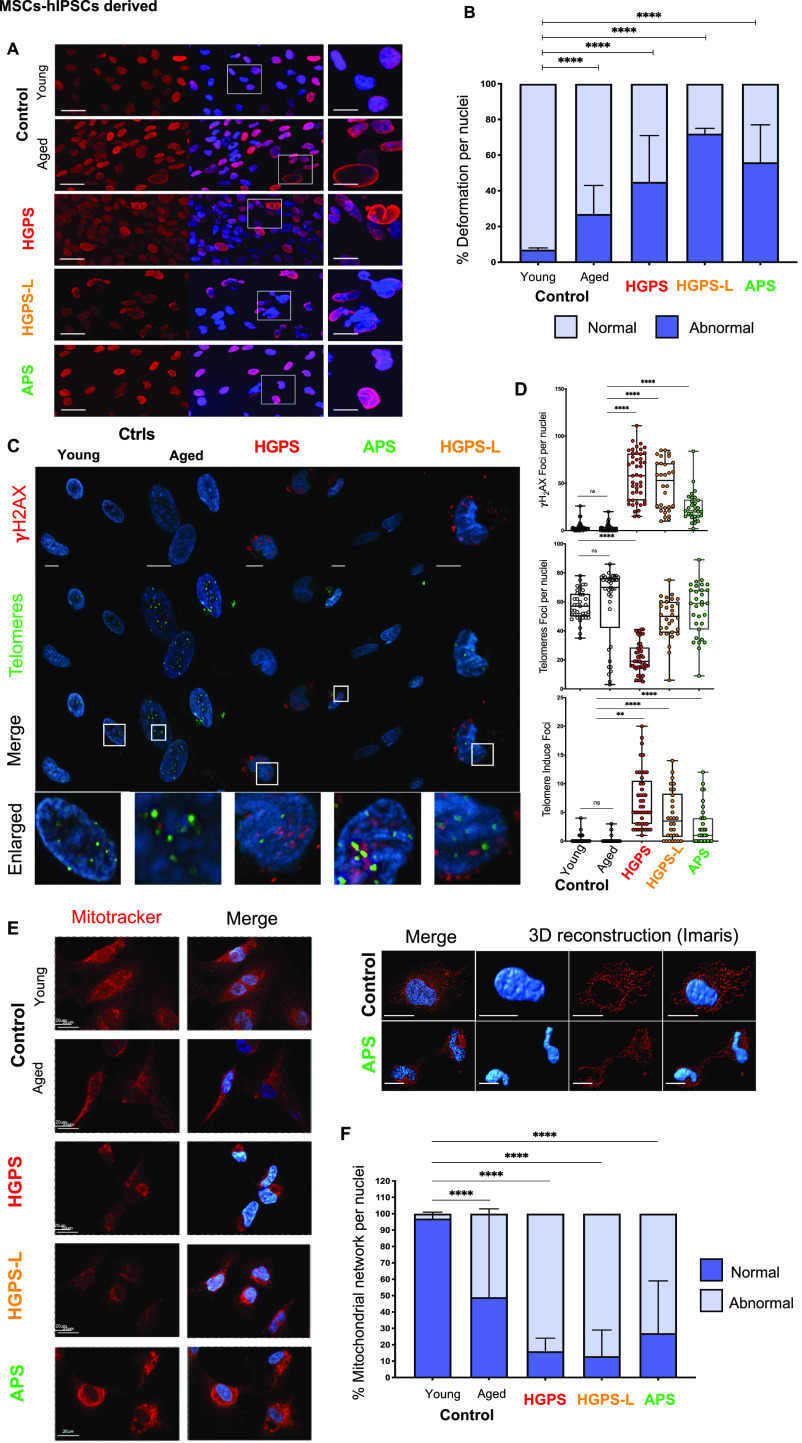
Progeroid syndromes are rare genetic diseases with most of autosomal dominant transmission, the prevalence of which is less than 1/10,000,000. These syndromes caused by mutations in the <i>LMNA</i> gene encoding A-type lamins belong to a group of disorders called laminopathies. Lamins are implicated in the architecture and function of the nucleus and chromatin. Patients affected with progeroid laminopathies display accelerated aging of mesenchymal stem cells (MSCs)-derived tissues associated with nuclear morphological abnormalities. To identify pathways altered in progeroid patients' MSCs, we used induced pluripotent stem cells (hiPSCs) from patients affected with classical Hutchinson-Gilford progeria syndrome (HGPS, c.1824C>T-p.G608G), HGPS-like syndrome (HGPS-L; c.1868C>G-p.T623S) associated with farnesylated prelamin A accumulation, or atypical progeroid syndromes (APS; homozygous c.1583C> T-p.T528M; heterozygous c.1762T>C-p.C588R; compound heterozygous c.1583C>T and c.1619T>C-p.T528M and p.M540T) without progerin accumulation. By comparative analysis of the transcriptome and methylome of hiPSC-derived MSCs, we found that patient's MSCs display specific DNA methylation patterns and modulated transcription at early stages of differentiation. We further explored selected biological processes deregulated in the presence of <i>LMNA</i> variants and confirmed alterations of age-related pathways during MSC differentiation. In particular, we report the presence of an altered mitochondrial pattern; an increased response to double-strand DNA damage; and telomere erosion in HGPS, HGPS-L, and APS MSCs, suggesting converging pathways, independent of progerin accumulation, but a distinct DNA methylation profile in HGPS and HGPS-L compared with APS cells.


Conflict of interest statement

The authors declare that they have no conflict of interest.

Figures

Figure 1.
Figure 1.. hiPSCs-derived mesenchymal stem cells (MSCs) from patients with premature aging syndrome (recapitulate the cellular features observed in primary cells).
(A) Schematic representation of different splicing patterns described for the LMNA gene and position of LMNA gene variants in Hutchinson–Gilford progeria syndrome (HGPS) (1,972, 8,243 and 5,968), HGPS-L (PC054) and atypical progeroid syndrome (OM2, 13,621, and 10,770) cells, leading to the production of pathogenic A-type lamin isoforms. (B) MSCs differentiation strategy. After dissociation with accutase, hiPSCs were plated on fibronectin-coated plates in the presence of ROCK inhibitor (thiazovivin). Cells are grown in TeSR, which is progressively removed upon differentiation and replaced with knockout-DMEM supplemented with ascorbic acid and FGF2. TeSR medium is removed at day 2, and cells are grown in knockout-DMEM supplemented with ascorbic acid and FGF2 until they reached 80% of confluency with medium replacement every 2 d. For the different passages, cells were dissociated with trypsin and plated in the same conditions. (C) Immunoblotting of A-type lamins proteins in whole-cell extracts of hiPSC-derived mesenchymal stem cells derived from young and aged healthy donors (CT-Y, CT-A); patients affected with either HGPS, atypical progeroid syndrome, or HGPS-L. MSCs were extracted at the fourth and seventh passage post-differentiation (left or right panels; respectively). Progerin is detectable in HGPS cells (∆50 intermediate band between lamins A and C). Antibodies also detect the ∆35 isoform produced in HGPS-like cells as indicated by a white arrow and presented in the blots and their enlarged adjacent version for progerin (HGPS, passage 4) and ∆35 isoform (HGPS-L, passage 7); respectively.
Figure S1.
Figure S1.. Characterization of induced pluripotent stem cells.
(A) Relative expression of endogenous pluripotency genes. Measurements of pluripotency gene expression are performed for each hiPSC line against a human ES cells control, and we show the results from each clone used in this study, organized by LMNA mutations. The genes chosen were OCT4, NANOG, LIN28, SOX2, ZFP42, and DNMT3B. Mean ± SD are shown. (B, C) Expression of pluripotency and differentiation markers for validation of the ability of hiPSC to form the three embryonic layers (ectoderm, mesoderm, and endoderm). hFF15, OM2, and 13,621 cell lines were given and assessed by a provider (iSTEM). (B) We report the scorecards from their validation (B). Briefly, up-regulation (red) is considered when values are x > 1.5 and down-regulation x < −1.5; respectively. Intermediate values (Blue) are considered comparable. (C) Differentiation of other cell lines were tested by RT-qPCRs (C) using the following candidates (AldhA-1, FOXA2, COL2A1, Brachyury, NCAM, and AFP). Mean ± SD are shown. (D) Western blot for detection of A-type lamins in whole-cell extracts from hiPSCs clones derived from a young healthy donor (CT-Y), aged healthy donor (CT-A), patient affected with Hutchinson–Gilford progeria syndrome (HGPS), atypical progeroid syndrome, and progeria-like (HGPS-L). Whole-protein extract obtained from fibroblasts of a HGPS patient were used as positive control (HGPS-CT). Detail of the different A-type lamin isoforms is shown. “A” point to the band corresponding to lamin A; “C” points to the band corresponding to lamin C and “P,” to progerin.
Figure S2.
Figure S2.. Characterization of hiPSC-derived mesenchymal stem cells (MSCs).
(A) The percentage of MSCs was determined at different time points by flow cytometry by detection of CD73 (ecto 5′ nucleotidase), CD90 (Thy1), CD105 (Endoglin). (B) Representative flow cytometry analysis across samples to validate the absence of hematopoietic cell lineage markers CD34 and CD45. (C) After the first differentiation step, cells at 80% confluence were divided and expanded. The time between each passage is indicated. Cells were collected at P7, 40 d after differentiation for Hutchinson–Gilford progeria syndrome cells and 47 d for cells from the aged healthy donor. (D) The percentage of proliferating cells was monitored by flow cytometry at each passage using Ki67 staining. We observed a similar proliferation rate between the different conditions. Between each passage, measurements were made at three time points: 12, 24 and 48 h.
Figure 2.
Figure 2.. Transcriptome analysis of hiPSCs and differentiated mesenchymal stem cells (MSCs) from individuals carrying LMNA mutations.
(A) Heatmap representing the transcriptome of hiPSCs and hiPSCs-derived MSCs from progeroid patients. Analysis was performed in triplicate for most samples (CT-Y; CT-A; Hutchinson–Gilford progeria syndrome [HGPS] and atypical progeroid syndrome [APS]) and quadruplicate for HGPS-L cells. Unsupervised hierarchical clustering separates hiPSCs from MSCs. (B) Venn diagram between control individuals (CT-Y; CT-A). List of the differentially expressed genes during differentiation (dDEGs) were generated by comparing the transcriptome of hiPSCs to MSCs to their respective controls. We report 334 and 2269 dDEGs restricted to either control (CT-Y, CT-A; respectively) and 927 dDEGs shared between both controls. (C) Venn diagram of the overlap between dDEGs generated by comparing transcriptome of hiPSCs to MSCs in each pathological condition (HGPS, HGPS-L, and APS) and the dDEGs shared in controls (found in B). (D) Biological processes (BP) associated with dDEGs and common to all laminopathies determined using Gene Ontology (GO). dDEGs were determined as reported in respective panels (CT-Y versus pathology). Bar plots are shown with GO terms and associated percentage of genes along with the P-value adjusted FDR. (E, F, G) Unsupervised hierarchical clustering heatmap for mitochondrial (E), DNA damages (F) and telomeric (G) genes in MSCs. Analysis was performed in triplicate for most samples (CT-Y; CT-A; HGPS and APS) and quadruplicate for HGPS-L cells.
Figure S3.
Figure S3.. Analysis of differentially expressed genes (DEGs) during the differentiation of hIPSCs into MSCs.
(A) Venn diagram representing the clustering of DEGs in the different pathologies compared with CT-Y (left) and CT-A (right) in hiPSCs cell lines. DEGs lists were generated by comparing the transcriptome from pathological hiPSCs to hiPSCs from either control. We report 21 and 24 DEGs shared between comparison (CT-Y and CT-A, respectively). (B) Venn diagram showing the clustering of DEGs in the different pathologies compared with CT-Y (left) and CT-A (right) in MSCs differentiated from hIPSCs cell lines. Lists of DEGs lists were generated by comparing the transcriptome of pathological MSCs to MSCs from either control. We report 49 and 71 DEGs shared between comparison (CT-Y, CT-A; respectively). (C) Representative deregulated biological processes in each condition, determined using Gene Ontology (GO). Histogram bars are presented with GO terms and the percentage of associated genes, as well as the adjusted P-value of the FDR.
Figure 3.
Figure 3.. Analysis of global methylation in hiPSC-derived mesenchymal stem cell (MSC).
(A) Median of methylation Beta values for all CpG probes in the different conditions. Median is represented by the black bar. (B, C) Stacked barplots representing the distribution of differentially methylated probes in patient cells (MSCs) compared with healthy young (B) and aged (C) donor cells (Padj < 0.05 and abs(Δβ) > 0.2). (D) Stacked barplots representing the distribution of hypermethylated (left) and hypomethylated (right) probes relative to CpG islands, shores (2 kb flanking CpG islands), shelves (2 kb extending from shores), or open seas (isolated CpG in the rest of the genome) in patients compared with young donor cells (CT-Y; Padj < 0.05 and abs(Δβ) > 0.2). (E) Stacked barplots representing the distribution of hypermethylated (left) and hypomethylated (right) probes relative to CpG islands, shores (2 kb flanking CpG islands), shelves (2 kb extending from shores), or open seas (isolated CpG in the rest of the genome) in patients compared with aged donor cells (CT-A; Padj < 0.05 and abs(Δβ) > 0.2). (F) Stacked barplots representing the distribution of hypermethylated (left) and hypomethylated (right) probes analyzed for REMC (Roadmap Epigenomics Mapping Consortium) features for adipose-derived MSC cultured cells (E025), in patients compared with young donor cells (CT-Y). Features with similar characteristics were pooled for better visualization on the plot. (P-value < 0.05 and abs(Δβ) > 0.2). (G) Stacked barplots representing the distribution of hypermethylated (left) and hypomethylated (right) probes analyzed for REMC (Roadmap Epigenomics Mapping Consortium) features for adipose-derived MSC cultured cells (E025), in patients compared with aged donor cells (CT-A). Features with similar characteristics were pooled for better visualization on the plot. (P-value < 0.05 and abs(Δβ) > 0.2). In all stacked barplots presented (D, E, F, G), we report the distribution given by the whole EPIC Array (850k probes, Illumina).
Figure S4.
Figure S4.. Analysis of global methylation in mesenchymal stem cells and DNA methylation regarding lamin-associated domains.
(A) Stacked barplots representing the distribution of hypermethylated (left) and hypomethylated (right) probes corresponding to genes first exon, 3′ UTR, 5′UTR, gene bodies, exon boundaries, internal genomic regions (IGR), probes located 1,500 bp from transcription start sites (TSS1500) or 200 bp from transcription start sites (TSS200) pathologies compared with young donor cells (Padj < 0.05 and abs (Δβ) > 0.2). (B) Stacked barplots representing the distribution of hypermethylated (left) and hypomethylated (right) probes corresponding to genes first exon, 3′ UTR, 5′UTR, gene bodies, Exon boundaries, Internal genomic regions (IGR), probes located 1,500 bp from transcription start sites (TSS1500) or 200 bp from transcription start sites (TSS200) pathologies compared with aged donor cells (Padj < 0.05 and abs (Δβ) > 0.2). (C) 2D density of probes located ±315 kb of LADs (GSM1313397), excluding probes located at LADs (n = 86,006 probes remaining). Probe density is represented by a color scale where yellow represents the highest density. Methylation levels are reported by their associated β-value where 0 report unmethylated probes; 1 fully methylated. We report a higher density of unmethylated probes at the boarder of LADs in CT-Y and atypical progeroid syndrome hiPSC-derived mesenchymal stem cells as seen by a yellow signal at 0 on both axes in their 2D density plot panels.
Figure S5.
Figure S5.. Distribution and relative gene expression of selected genes in laminopathies during differenciation.
(A) Median distance to nearest LAD for indicated differentially expressed gene (from mesenchymal stem cells [MSCs]) relative to all genes. (B) Relative gene expression in MSCs derived from hiPSCs of patients with LMNA mutations at P7 of the selected genes according to their involvement in biological pathways. Expression of selected genes is normalized to housekeeping genes (HKG; PPIA, HPRT, GAPDH) and control (young). For each condition, we report the average of biological and technical duplicates (Hutchinson–Gilford progeria syndrome [HGPS], n = 12; HGPS-L, n = 4; atypical progeroid syndrome, n = 12 data point). Kruskal–Wallis test P-value * < 0.05; ** < 0.005; *** < 0.0005; **** < 0.0001. (C) Relative gene expression in MSCs derived from hiPSCs of patients with LMNA mutations throughout passages 2 to 7. Expression of selected genes (FOXC1, COL1A1, and COL1A2) is normalized to housekeeping genes (HKG; PPIA, HPRT, and GAPDH) and respective expression at P2 within conditions (expression set at 1 across samples at P2). For each condition, we report the average of three independent differentiations per biological samples (HGPS, n = 9; HGPS-L, n = 3; atypical progeroid syndrome, n = 9).
Figure 4.
Figure 4.. DNA methylation regarding lamin-associated domains in hiPSC-derived mesenchymal stem cells.
2D density plots of distances to closest LAD and associated probe methylation (left panels) and density plot of betavalue (methylation) of probes located within LADs (right panels). (A, B, C, D, E) We report results from the young control (CT-Y, A); aged control (CT-A, B), progeria (Hutchinson–Gilford progeria syndrome, C), progeria-like (Hutchinson–Gilford progeria syndrome-L, D), and atypical progeroid (atypical progeroid syndrome, E) samples; respectively. For 2D density plots, we report all probes located within ±315 kb of LADs (n = 167,848 probes) that successfully passed the QC threshold (GSM1313397). Probes located within LADs are associated to 0. Probe density is represented by a color scale where yellow represents the highest density. Methylation levels are reported by their associated betavalue where 0 report unmethylated probes; 1 fully methylated. For density plot located in LADs (n = 81,842 probes), dashed red line indicates mean methylation; dashed blue line indicates median methylation. We report a higher density of unmethylated probes at LADs in CT-Y and atypical progeroid syndrome hiPSC-derived mesenchymal stem cells as seen by a yellow signal at 0 on both axis in their 2D density plot panels (left panels) and further confirmed by a lower median axis (blue dashed lines) in the density plot at LAD (right panels).
Figure 5.
Figure 5.. hiPSC-derived mesenchymal stem cells (MSCs) from patients with premature aging syndromes display hallmarks of aging.
(A) Representative Z-stack after confocal microscopy showing the distribution of lamins A/C (red) in the nucleus of hiPSC-derived MSCs (controls, Hutchinson–Gilford progeria syndrome [HGPS], HGPS-L, and atypical progeroid syndrome) at passage 7. Cells were immunostained using anti-lamin A/C antibodies and were counterstained with DAPI. Bars correspond to 30 μm (left panels) and 10 μm (right panel, enlargement) scales; respectively. (B) Quantification of nuclear abnormalities in hiPSC-derived MSCs. Experiments were carried in triplicates; 100 nuclei were counted per condition. The percentage of nuclear abnormalities observed was plotted. Mean ± SD are reported. Tukey’s multiple comparisons test P-value * < 0.05; ** < 0.005; *** < 0.0005; **** < 0.0001. (C) Immunostaining of γH2AX foci in the different hiPSC-derived MSCs at P7 (upper panel). Telomeres were visualized using a telomeric PNA FISH probe. Telomere-induced foci (TIFs) were evidenced by overlays between γH2AX staining and telomeric signals. (D) For each assay, we report the number of telomeric foci, γH2AX foci along with TIFs. Experiments were carried out in duplicate with a minimum of 50 nuclei counted by condition. Mean ± SEM are reported. Significant differences are shown using the Holm-Sidak’s multiple comparisons test P-value * < 0.05; ** < 0.005; *** < 0.0005; **** < 0.0001. (E) Mitochondrial network in MSCs. Staining was performed using mitotracker and counterstained with DAPI. (F) Quantification of cells with normal or abnormal mitochondrial patterns. Experiments were carried out either in triplicate (CT-Y, CT-A, and HGPS-L) with 100 nuclei counted per replicate (n > 300 nuclei per condition) or across biological triplicate (HGPS, atypical progeroid syndrome) with 100 nuclei counted per individual (n > 300). We report the percentage of nuclear abnormalities observed by immunofluorescence at P7; mean ± SD. Significant differences are shown using Tukey’s multiple comparisons test P-value * < 0.05; ** < 0.005; *** < 0.0005; **** < 0.0001.

Similar articles

Cited by

References

    1. Steele-Stallard HB, Pinton L, Sarcar S, Ozdemir T, Maffioletti SM, Zammit PS, Tedesco FS (2018) Modeling skeletal muscle laminopathies using human induced pluripotent stem cells carrying pathogenic LMNA mutations. Front Physiol 9: 1332. 10.3389/fphys.2018.01332 - DOI - PMC - PubMed
    1. Kang S-M, Yoon M-H, Park B-J (2018) Laminopathies; Mutations on single gene and various human genetic diseases. BMB Rep 51: 327–337. 10.5483/bmbrep.2018.51.7.113 - DOI - PMC - PubMed
    1. Petillo R, D’Ambrosio P, Torella A, Taglia A, Picillo E, Testori A, Ergoli M, Nigro G, Piluso G, Nigro V, et al. (2015) Novel mutations in LMNA A/C gene and associated phenotypes. Acta Myol 34: 116–119. - PMC - PubMed
    1. Earle AJ, Kirby TJ, Fedorchak GR, Isermann P, Patel J, Iruvanti S, Moore SA, Bonne G, Wallrath LL, Lammerding J (2020) Mutant lamins cause nuclear envelope rupture and DNA damage in skeletal muscle cells. Nat Mater 19: 464–473. 10.1038/s41563-019-0563-5 - DOI - PMC - PubMed
    1. Merideth MA, Gordon LB, Clauss S, Sachdev V, Smith ACM, Perry MB, Brewer CC, Zalewski C, Kim HJ, Solomon B, et al. (2008) Phenotype and course of Hutchinson-Gilford progeria syndrome. N Engl J Med 358: 592–604. 10.1056/nejmoa0706898 - DOI - PMC - PubMed

Publication types

Associated data