. 2022 Sep;10(9):e004219.
doi: 10.1136/jitc-2021-004219.

Tumor-associated macrophage-specific CD155 contributes to M2-phenotype transition, immunosuppression, and tumor progression in colorectal cancer

Affiliations

Tumor-associated macrophage-specific CD155 contributes to M2-phenotype transition, immunosuppression, and tumor progression in colorectal cancer

Xudong Zhu et al. J Immunother Cancer. 2022 Sep.

Abstract

Background: Onco-immunogenic molecule CD155 is overexpressed in various tumor microenvironments (TME) including in colorectal cancer (CRC). Tumor-associated macrophages (TAMs) are the most abundant immune cells in CRC TME and play a vital role in CRC progression and metastasis. Most studies have focused on investigating the role of CRC cell-specific CD155 on CRC progression, while the contribution of TAMs-specific CD155 is still unknown. Here, we sought to investigate the expression pattern of CD155 in CRC TAMs and its role in tumor immunity and progression.

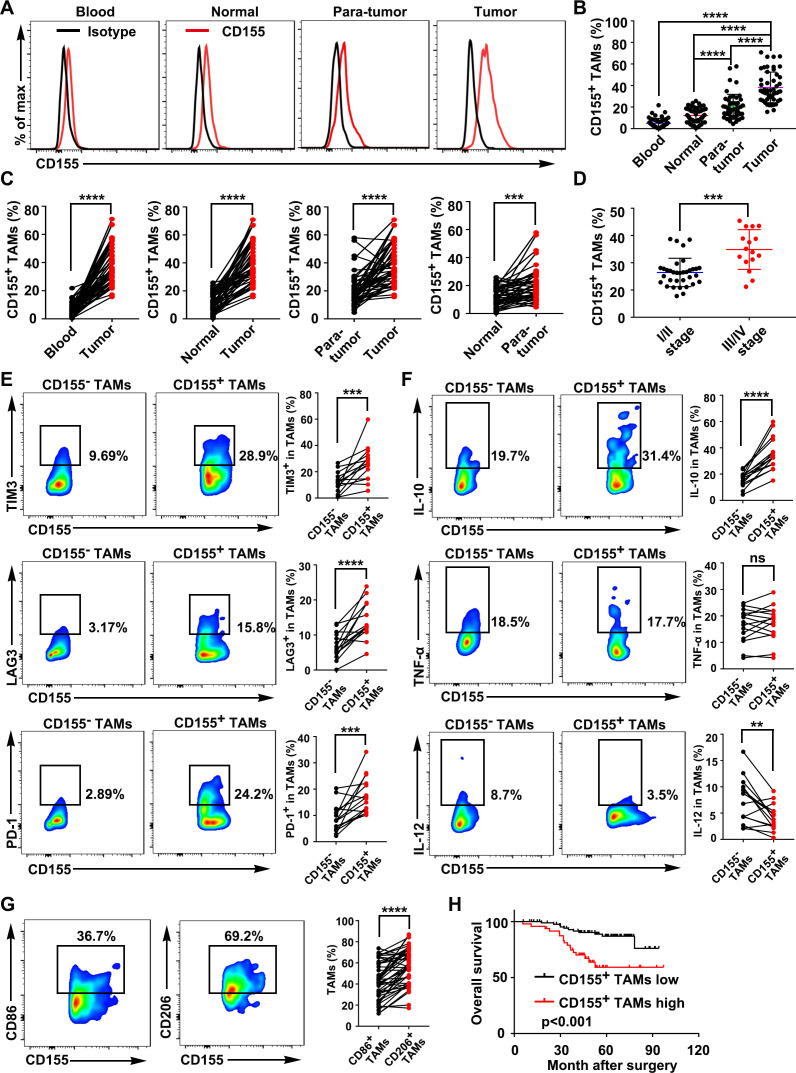
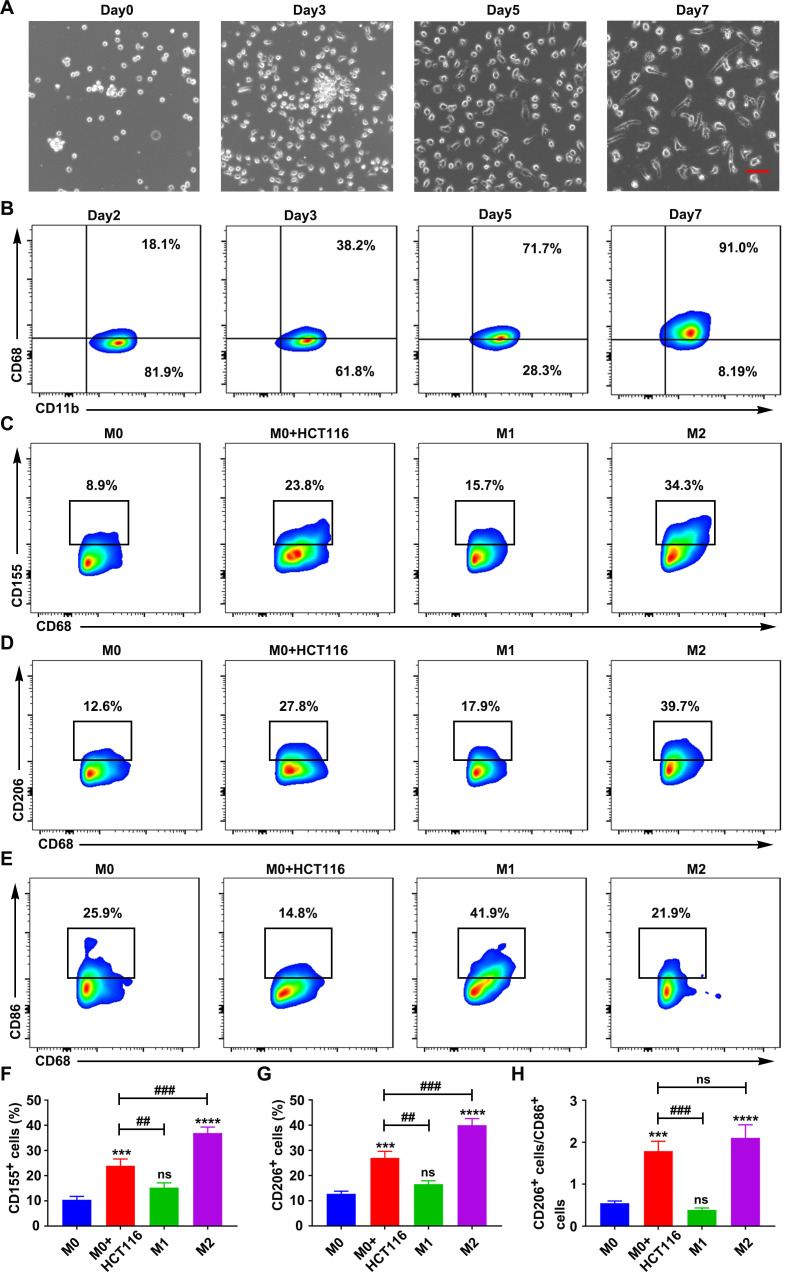
Methods: CD155 expression patterns in CRC TAMs and macrophages in paratumor or adjacent normal tissue were analyzed in 50 patients with CRC using flow cytometry and in 141 patients with CRC using immunohistochemistry. The correlation of CD155 expression level in TAMs with M1 and M2 phenotypic transition was analyzed. The role of macrophage-specific CD155 in CRC progression and tumor immune response was investigated in vitro and in vivo. We further analyzed the effect of CRC cells on the regulation of CD155 expression in macrophages.

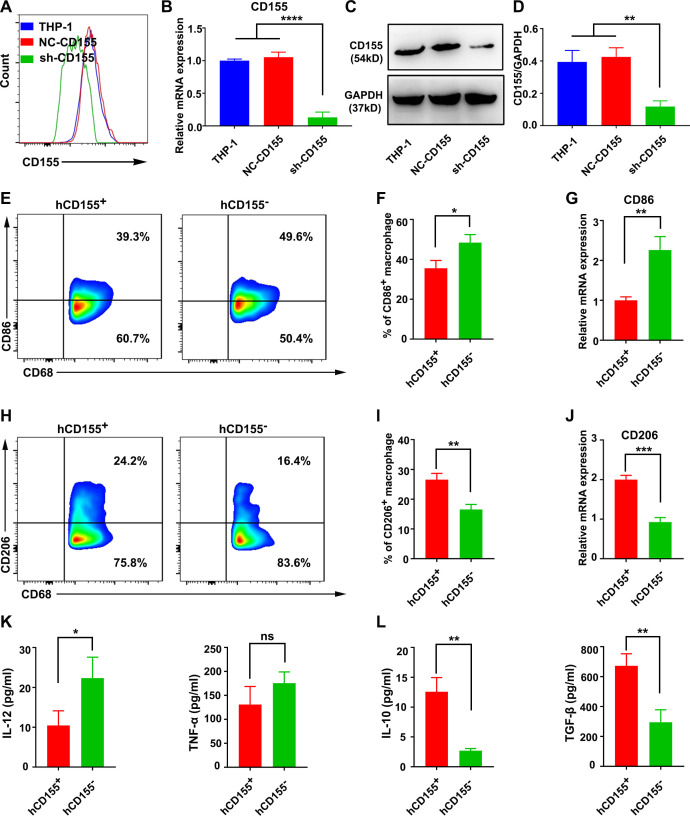
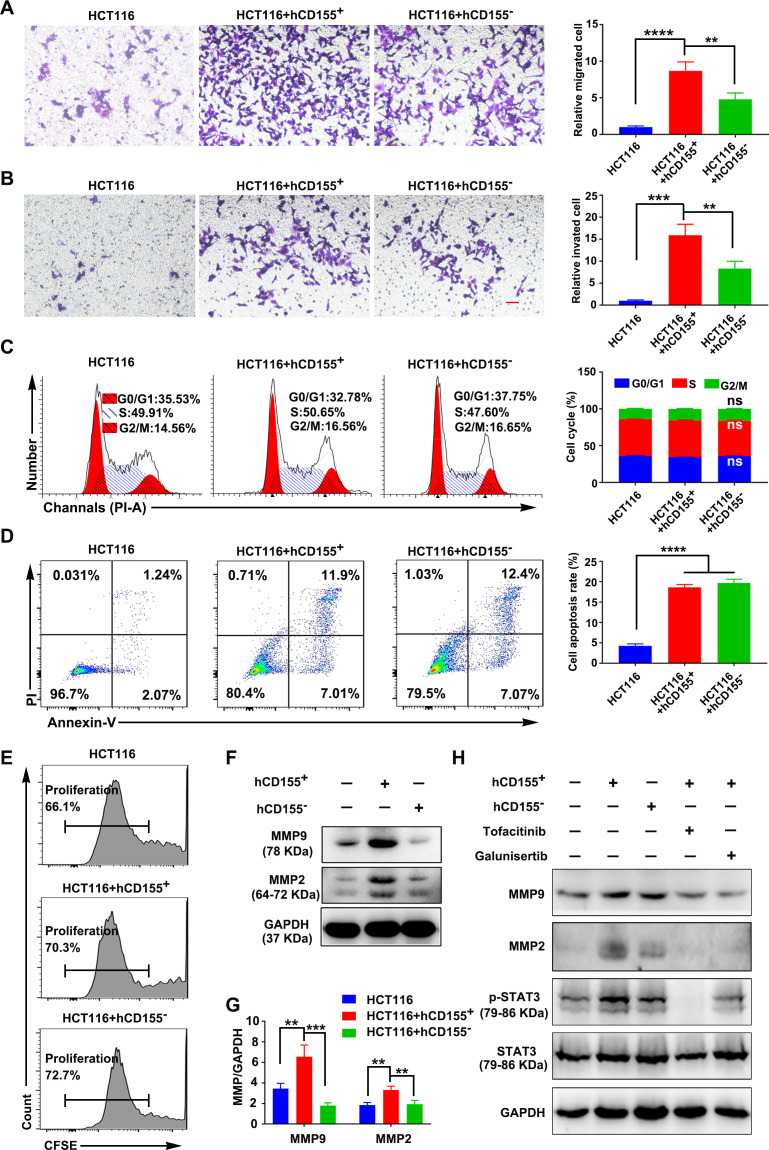
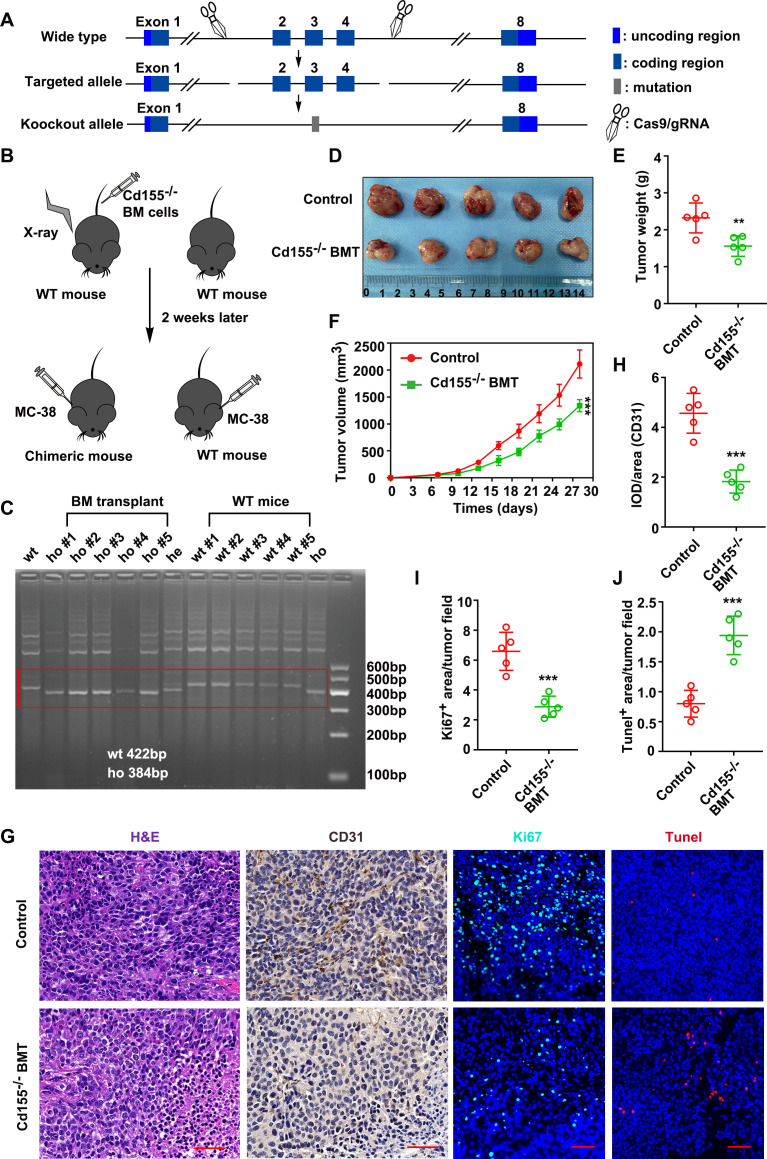
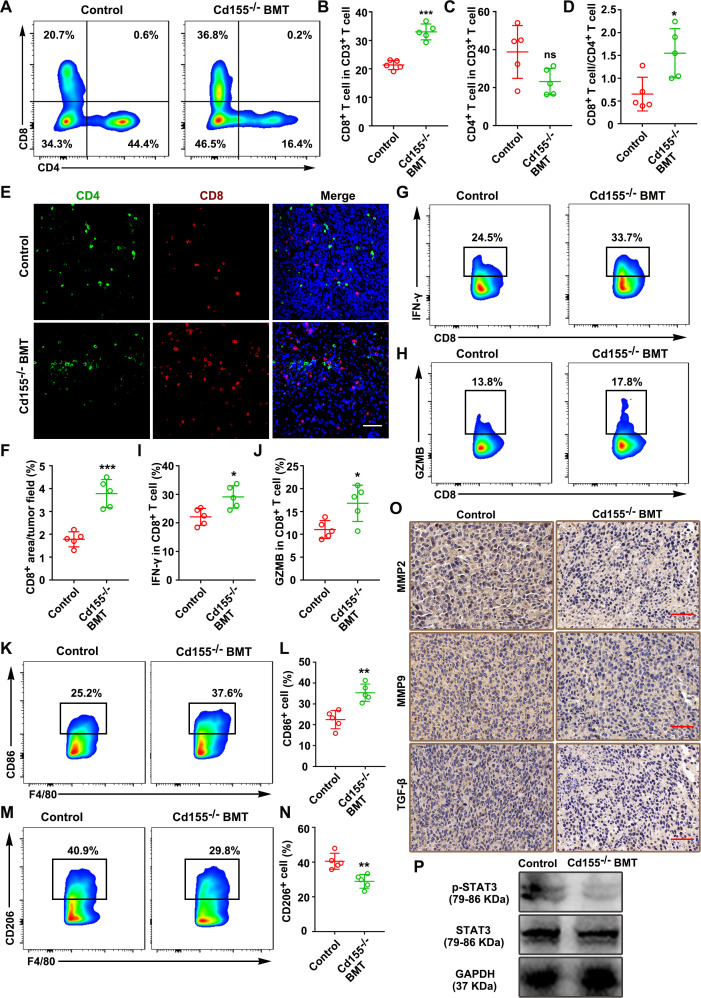
Results: CRC TAMs from clinical samples showed robustly higher expression of CD155 than macrophages from paratumor and adjacent normal tissues. The CD155 expression level was higher in TAMs of CRC at III/IV stages compared with the I/II stages and was negatively associated with the survival of patients with CRC. CD155+ TAMs showed an M2 phenotype and higher expression of interleukin (IL)-10 and transforming growth factor (TGF)-β. CD155+ macrophages promoted CRC cell migration, invasion, and tumor growth supporting the findings from the clinical tissue analysis. This effect was mainly regulated by TGF-β-induced STAT3 activation-mediated release of matrix metalloproteinases (MMP)2 and MMP9 in CRC cells. CD155-⁄- bone marrow transplantation in wild-type mice, as well as CD155- macrophages treatment, promoted the antitumor immune response in the mice ectopic CRC model. Additionally, CRC cells released IL-4 to trigger CD155 expression in macrophages indicating the regulatory role of CRC cells in the development of CD155+ TAMs.

Conclusions: These findings indicated that CD155+ TAMs are responsible for the M2-phenotype transition, immunosuppression, and tumor progression in CRC. The specific localization of CD155+ TAMs in CRC tissue could turn into a potential therapeutic target for CRC treatment.

Keywords: immunity; tumor escape; tumor microenvironment.


Conflict of interest statement

Competing interests: None declared.

Figures

Figure 1
Figure 1
CD155+ TAMs were predominant in CRC tissue and showed an M2 macrophage phenotype. (A) Representative FACS images showed the expression patterns of CD155 on macrophages from the paired blood samples, normal tissues, paratumor tissues, and tumor tissues of patients with CRC (gated on CD68+ cells). (B) Quantitative analysis of CD155+ macrophages from the FACS analysis (n=50). (C) Percentage of CD155+ macrophages presented in paired blood samples and tumors, paired normal tissues and tumors, paired paratumor tissues and tumor tissues, and paired normal tissues and paratumor tissues of patients with CRC (n=50). (D) Percentage of CD155+ TAMs in CRC tissue of patients with tumor stages I/II and III/IV. (E) Expression pattern of TIM-3, LAG-3, and PD-1 on CD155– and CD155+ TAMs presented in CRC tissues (n=15). (F) Expression pattern of IL-10, TNF-α, and IL-12 in CD155– and CD155+ TAMs presented in CRC tissues (n=15). (G) Expression pattern of the M1 phenotype marker CD86 and the M2 phenotype marker CD206 in CD155+ TAMs (n=50). (H) Kaplan-Meier analysis of overall survival according to low and high CD155 expression in 141 patients with CRC. Data were presented as mean±SD. A significant difference between the groups, **p<0.01, ***p<0.001, and ****p<0.0001. CRC, colorectal cancer; FACS, fluorescence activated cell sorter; IL, interleukin; LAG-3, lymphocyte-activation gene 3; ns, no significant difference; PD-1, programmed cell death protein-1; TAM, tumor-associated macrophages; TIM-3, T-cell immunoglobulin and mucin domain 3; TNF, tumor necrosis factor.
Figure 2
Figure 2
CD155 level in macrophages determined phenotypic transition and function. Expression pattern of CD155 in THP-1 cells, NC-CD155 transfected THP-1 (hCD155+), and sh-CD155 transfected THP-1 (hCD155–) cells analyzed by FACS (A), RT-qPCR (B), and Western blot analysis (C and D). (E–G) CD86 expression patterns in LPS+IFN-γ-treated hCD155+ and hCD155– macrophages. (H–J) CD206 expression patterns in IL-4+IL-13-treated hCD155+ and hCD155– macrophages (gated on CD68+ cells). (K) IL-12 and TNF-α protein expression patterns in LPS/IFN-γ-treated hCD155+ and hCD155– macrophages. (L) IL-10 and TGF-β protein expression patterns in IL-4/IL-13-treated hCD155+ and hCD155– macrophages. Data were presented as mean±SD, n=3. A significant difference between the groups, *p<0.05, **p<0.01, ***p<0.001, ****p<0.0001. FACS, fluorescence activated cell sorter; IL, interleukin; IFN, interferon; LPS, lipopolysaccharide; mRNA, messenger RNA; ns, no significant difference; RT-qPCR, real time quantitative PCR; TGF, transforming growth factor; TNF, tumor necrosis factor.
Figure 3
Figure 3
CD155+ macrophages (THP-1-derived) enhanced the migration and invasion of human CRC cells. The migration (A), invasion (B), cell cycle status (C), apoptosis (D), and proliferation rate (E) of CRC cells (HTC116) during co-cultured with hCD155+ or hCD155– macrophages. Scale bar: 100 µm. (F and G) MMPs expression in CRC cells during co-cultured with hCD155+ or hCD155– macrophages. (H) Expression pattern of MMPs and pSTAT3/STAT3 in CRC cells during co-cultured with hCD155+ or hCD155– macrophages with or without inhibition of STAT3 or TGF-β signaling. Data were presented as mean±SD, n=3. A significant difference between the groups, **p<0.01, ***p<0.001, and ****p<0.0001. ns, no significant difference. Tofacitinib (2.5 µM): JAK/STAT3 signaling inhibitor, galunisertib (10 µM): TGF-β signaling inhibitor. CRC, colorectal cancer; MMP, matrix metalloproteinases; TGF, transforming growth factor.
Figure 4
Figure 4
CD155 level in human macrophages regulated CD8+ T-cell proliferation and function. (A and B) The proliferation rate of CD8+ T cells during co-cultured with hCD155+ or hCD155– macrophages. Expression pattern of IFN-γ (C and D), and GZMB (E and F), in CD8+ T cells during co-cultured with hCD155+ or hCD155– macrophages (gated on CD8+ cells). (G and H) Apoptosis rate of CD8+ T cells during co-cultured with hCD155+ or hCD155– macrophages. Data were presented as mean±SD, n=3. A significant difference between the groups, *p<0.05, **p<0.01, and ****p<0.0001. GZMB, granzyme B; IFN, interferon; ns, no significant difference.
Figure 5
Figure 5
CRC cells triggered CD155 expression in human macrophages. (A) Microscopic images of differentiating macrophages from human PBMC-derived monocytes. Scale bar: 50 µm. (B) CD68 expression pattern during macrophagic differentiation of monocytes. CD155 expression (C), CD206 expression (D), and CD86 expression (E), in macrophages during co-cultured with CRC cells, M1 (LPS+IFN-γ-treated) and M2 (IL-4+IL-13-treated) polarization (gated on CD68+ cells). (F–H) Statistical analysis of CD155 expression, CD206 expression, and the ratio of CD206 to CD86 in macrophages during co-cultured with CRC cells, M1 (LPS+IFN-γ-treated) and M2 (IL-4+IL-13-treated) polarization. Data were presented as mean±SD, n=3. A significant difference between the groups, ##p<0.01 and ###p<0.001, and compared with M0 group ***p<0.001 and ****p<0.0001. CRC, colorectal cancer; IFN, interferon; IL, interleukin; LPS, lipopolysaccharide; ns, no significant difference; PBMC, peripheral blood mononuclear cell.
Figure 6
Figure 6
CD155–⁄– BMT inhibited tumor growth in the mouse ectopic CRC model. (A) Schematic illustration of CD155 knockout. (B) Cd155–⁄– BM cells were transplanted into irradiated wild-type mice to populate a BM with CD155 null monocytes. (C) Mouse blood genotypes were verified by agarose gel electrophoresis. (D) Macroscopic images of tumor tissues from wide type and CD155–⁄– BMT groups. Quantitative analysis of tumor weight (E), and tumor volume (F). (G) Representative microscopic images of tumor tissue sections showed tumor morphology (H&E staining), blood vessels (CD31 IHC), cell proliferation (Ki-67 IHC), and apoptosis (TUNEL). Scale bar: 50 µm. (H–J) Quantitation of blood vessels, proliferation rate, and apoptosis rate in tumor tissue sections. Data were presented as mean±SD, n=5. A significant difference between the groups, **p<0.01 and ***p<0.001. BM, bone marrow; BMT, bone marrow transplantation; CRC, colorectal cancer; IHC, immunohistochemistry; WT, wild-type.
Figure 7
Figure 7
CD155–⁄– BMT promoted the antitumor immune response in the mouse ectopic CRC model. Number of CD8+ and CD4+ T cells (A–C), and CD8+/CD4+ T-cell ratio (D), in mouse tumor tissues examined by flow cytometry (gated on CD3+ cells). (E and F) Representative immunofluorescence images of CD4 and CD8 expressing cells in tumor tissues. Scale bar: 50 µm. (G–J) Expression pattern of IFN-γ and GZMB in CD8+ T cells of tumor tissue. CD86 (K and L) and CD206 expression patterns (M and N) of TAMs in tumor tissues (gated on F4/80+ cells). (O) Representative microscopic images of MMP2 (IHC), MMP9 (IHC), and TGF-β (IHC) in tumor tissues. Scale bar: 50 µm. (P) Expression pattern of pSTAT3/STAT3 in tumor tissues. Data were presented as mean±SD, n=5. A significant difference between the groups, *p<0.05, **p<0.01, and ***p<0.001. BMT, bone marrow transplantation; CRC, colorectal cancer; GZMB, granzyme B; IFN, interferon; IHC, immunohistochemistry; MMP, matrix metalloproteinases; ns, no significant difference; TAM, tumor-associated macrophages.

References

    1. Sung H, Ferlay J, Siegel RL, et al. . Global cancer statistics 2020: GLOBOCAN estimates of incidence and mortality worldwide for 36 cancers in 185 countries. CA Cancer J Clin 2021;71:209–49. 10.3322/caac.21660 - DOI - PubMed
    1. Arnold M, Sierra MS, Laversanne M, et al. . Global patterns and trends in colorectal cancer incidence and mortality. Gut 2017;66:683–91. 10.1136/gutjnl-2015-310912 - DOI - PubMed
    1. Brenner H, Kloor M, Pox CP. Colorectal cancer. The Lancet 2014;383:1490–502. 10.1016/S0140-6736(13)61649-9 - DOI - PubMed
    1. Belli C, Trapani D, Viale G, et al. . Targeting the microenvironment in solid tumors. Cancer Treat Rev 2018;65:22–32. 10.1016/j.ctrv.2018.02.004 - DOI - PubMed
    1. Mu Q, Najafi M. Modulation of the tumor microenvironment (Tme) by melatonin. Eur J Pharmacol 2021;907:174365. 10.1016/j.ejphar.2021.174365 - DOI - PubMed

Publication types