. 2022 Sep 14;13(1):5396.
doi: 10.1038/s41467-022-32917-6.

Understanding Braess' Paradox in power grids

Affiliations

Understanding Braess' Paradox in power grids

Benjamin Schäfer et al. Nat Commun. .

Abstract

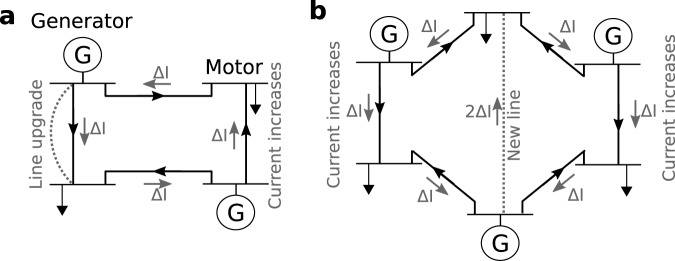
The ongoing energy transition requires power grid extensions to connect renewable generators to consumers and to transfer power among distant areas. The process of grid extension requires a large investment of resources and is supposed to make grid operation more robust. Yet, counter-intuitively, increasing the capacity of existing lines or adding new lines may also reduce the overall system performance and even promote blackouts due to Braess' paradox. Braess' paradox was theoretically modeled but not yet proven in realistically scaled power grids. Here, we present an experimental setup demonstrating Braess' paradox in an AC power grid and show how it constrains ongoing large-scale grid extension projects. We present a topological theory that reveals the key mechanism and predicts Braessian grid extensions from the network structure. These results offer a theoretical method to understand and practical guidelines in support of preventing unsuitable infrastructures and the systemic planning of grid extensions.


Conflict of interest statement

The authors declare no competing interests.

Figures

Fig. 1
Fig. 1. Schematic of Braess’ paradox emerging from upgrading or from adding transmission lines.
a Line upgrade in a four-node setup with two generators (G) and two loads, connected by a total of four lines. Original flows are indicated by black arrows and additional flows due to a line upgrade (dashed gray line) are marked by gray arrows and ΔI. The current increases on one line, although that line is not upgraded. b Additional line in a six-node setup with three generators (G) and three loads causes increased current on two lines (right and left, labeled in gray). See Supplementary Note 4 for an additional discussion.
Fig. 2
Fig. 2. Braess’ paradox in laboratory-scale AC grids.
Here, Braess’ paradox is observable as an increase of flow on the most highly loaded line due to upgrading a transmission line in the network. a Schematic of the experimental setup demonstrating Braess’ paradox with two generators (G) and two motors (M). The reactance X4 of line 4 is reduced, effectively upgrading the line. b The current amplitude I2 and I3 on lines 2 and 3 (as examples of lines where the additional flow is aligned and anti-aligned to the original flow) as a function of the negative reactance −X4 of the upgraded line 4. While the current on line 3 decreases, line 2 carries an increasing load: Braess’ paradox occurs. Dots with error bars and shaded regions indicate average currents and their standard deviation based on measurement and estimation uncertainties. Solid lines indicate our theoretical predictions based on power-flow computations, see Methods. c Synchronous generators, driven by asynchronous motors, power the laboratory grid. Each node within the laboratory grid is either a synchronous machine or a virtual-synchronous machine (VISMA). d Line properties, i.e., resistances R and reactances X are freely tunable via switches in the laboratory grid. See Supplementary Note 1 for more details on the experimental setup and uncertainty estimation.
Fig. 3
Fig. 3. Predicting Braessian edges through topological features.
a Upgrading edge (2, 3) induces a cycle flow that is anti-aligned with the flow on the most highly loaded line, thus reducing its load. Hence, Braess’ paradox does not occur. b Upgrading edge (3, 4) induces a cycle flow that does align with the flow on the most highly loaded line, thereby increasing its load. Hence, Braess’ paradox occurs. c In any given network, we systematically search for the shortest rerouting path across the maximum flow that includes the edge of interest. If the flow across that edge is aligned with the rerouting path, we predict the edge to be Braessian, see refs. , and Supplementary Note 3 for details. d The predictor is successfully applied in four network topologies: two-dimensional square lattices, Voronoi tesselations, the IEEE 300 bus test case, and random power grid models generated using ref. , using homogeneous, i.e., unweighted lines. We generate 200 generator and consumer distributions for each case. This analysis has very little (about 3−11%) false predictions and about 72−89% of Braessian line extensions are correctly identified. The remaining links have undefined alignment such that the predictor is not applicable for these. Edges with susceptibility smaller than 10−4 are excluded from this analysis because upgrading them has too little impact on the maximum flow. See Supplements for details on the implementation of the predictor.
Fig. 4
Fig. 4. Expansion plans in real power grids cause non-local overloads of the grid.
a A simulation of the German power grid is performed using a full-scale market where the color code shows the current relative to the thermal limit current: Yellow indicates high loads, while orange or red indicates an overload, see Methods for details on the simulation model. b Zoom on the North-western part of the German power grid in its base load case. c Including an AC expansion (blue oval) causes higher loadings (orange oval). The color code of the lines denotes the increase in load. Some lines are now close to their overload condition. d Including a long-range DC line (blue oval), again causes some lines to be close to their overload condition (orange oval). e, f We compare the proportional loading (actual loading divided by max load) of the most highly loaded lines before and after enhancing existing lines in both the AC (e) and the DC (f) extension scenario. The horizontal red lines indicate the transition to the overloaded state. In and Pn give the maximal current or power as designed for normal operation, i.e., any current I > In or power P > Pn signals an overload. Maps were created using the Quantum GIS Project and the Mapping Toolbox in MATLAB.
Fig. 5
Fig. 5. (N + 1)-extensions may induce overloads.
a We systematically consider all (N + 1)-extensions and plot the relative change in current in a normalized histogram. b We display the absolute current Ie(+a) on one line e when each line a in the network is enhanced one by one in a normalized histogram. While most current changes are small (a), the new current Ie(+a) might surpass the current threshold Ieth of the line (b). Data derived from the market model as in Fig. 4 and considering all single line extensions provide the (N + 1)-criterion.

References

    1. Obama, B. H. Presidential policy directive 21: critical infrastructure security and resilience. the White House (12 February 2013).
    1. Shaukat N, et al. A survey on consumers empowerment, communication technologies, and renewable generation penetration within smart grid. Renew. Sustain. Energy Rev. 2018;81:1453–1475.
    1. Lepoutre, J., Perez, Y. & Petit, M. In The European Dimension of Germany’s Energy Transition (eds Purkus, A., Gawel, E., Lehmann, P. & Strunz, S.) Part IV, 509–525 (Springer, 2019).
    1. Robinius M, et al. Linking the power and transport sectors-part 1: the principle of sector coupling. Energies. 2017;10:956.
    1. Brown T, Schlachtberger D, Kies A, Schramm S, Greiner M. Synergies of sector coupling and transmission reinforcement in a cost-optimised, highly renewable European energy system. Energy. 2018;160:720–739.