Clinical Trial
. 2022 Sep 14;13(1):5378.
doi: 10.1038/s41467-022-33080-8.

A pilot study of neoadjuvant combination of anti-PD-1 camrelizumab and VEGFR2 inhibitor apatinib for locally advanced resectable oral squamous cell carcinoma

Affiliations
Clinical Trial

A pilot study of neoadjuvant combination of anti-PD-1 camrelizumab and VEGFR2 inhibitor apatinib for locally advanced resectable oral squamous cell carcinoma

Wu-Tong Ju et al. Nat Commun. .

Abstract

Novel neoadjuvant therapy regimens are warranted for oral squamous cell carcinoma (OSCC). In this phase I trial (NCT04393506), 20 patients with locally advanced resectable OSCC receive three cycles of camrelizumab (200 mg, q2w) and apatinib (250 mg, once daily) before surgery. The primary endpoints are safety and major pathological response (MPR, defined as ≤10% residual viable tumour cells). Secondary endpoints include 2-year survival rate and local recurrence rate (not reported due to inadequate follow-up). Exploratory endpoints are the relationships between PD-L1 combined positive score (CPS, defined as the number of PD-L1-stained cells divided by the total number of viable tumour cells, multiplied by 100) and other immunological and genomic biomarkers and response. Neoadjuvant treatment is well-tolerated, and the MPR rate is 40% (8/20), meeting the primary endpoint. All five patients with CPS ˃10 achieve MPR. Post-hoc analysis show 18-month locoregional recurrence and survival rates of 10.5% (95% CI: 0%-24.3%) and 95% (95% CI: 85.4%-100.0%), respectively. Patients achieving MPR show more CD4+ T-cell infiltration than those without MPR (P = 0.02), and decreased CD31 and ɑ-SMA expression levels are observed after neoadjuvant therapy. In conclusion, neoadjuvant camrelizumab and apatinib is safe and yields a promising MPR rate for OSCC.


Conflict of interest statement

J.X., S.C. and Y.B. are employees of the company 3D Medicines Inc. The remaining authors declare that they have no competing interests.

Figures

Fig. 1
Fig. 1. Trial flowchart.
21 patients were enrolled in this trial; 20 patients received neoadjuvant therapy and surgery; among them, 18 patients received adjuvant therapy.
Fig. 2
Fig. 2. Efficacy of neoadjuvant therapy.
A Residual viable tumour cell (RVT) ratio, combined positive score (CPS), and radiographic partial response (PR) in 20 patients. The percentage of RVT was evaluated on resected tumour slides after surgery. The CPS was defined as the total number of programmed cell death-ligand 1-stained cells (including tumour cells, tumour-associated lymphocytes, and macrophages) divided by the total number of viable tumour cells plus 100. Radiographic response according to RECIST 1.1 criteria was performed on the basis of imaging examinations before and after neoadjuvant therapy (green triangles for the MPR group [n = 8], black triangles for the non-MPR group [n = 12]). B In the patient who achieved pathological complete response, images of the oral tongue (left) and magnetic resonance imaging (right) before (upper) and after (lower) neoadjuvant therapy are shown. Source data are provided as a Source Data file.
Fig. 3
Fig. 3. Genetic and tumour-infiltrating lymphocyte analyses.
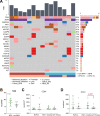
A Mutations as assessed by next-generation sequencing of baseline primary tumour samples. A column represents a patient. The percentages listed on the right represent the proportion of samples harbouring a mutation in the gene listed on the left. Bottom bars show pathological response (MPR [n = 8] or non-MPR [n = 7]) and combined positive score (˃10 [n = 5] or ≤10 [n = 10]) distribution. B Comparison of TMB in baseline tumour samples between the MPR and non-MPR groups (green dots for the MPR group [n = 7], grey dots for the non-MPR group [n = 8]). Quantitative graphs of the infiltration density of CD8+ (C) and CD4+ (D) T cells in tumour samples before and after neoadjuvant therapy (green dots for the MPR group [n = 8], grey dots for the non-MPR group [n = 12]). The significance of the differences between before and after neoadjuvant therapy was tested using a two-sided Wilcoxon signed-rank test; for differences between the MPR and non-MPR groups, the significance was tested using a two-sided Mann‒Whitney test. Bars represent the mean with SD. Source data are provided as a Source Data file.
Fig. 4
Fig. 4. Features of the hyperprogressive disease.
In patient No. 14, who showed hyperprogressive disease: radiographic and H&E staining images before (A) and after (B) neoadjuvant therapy. C Multiplex immunofluorescence images of the tumour site before and after neoadjuvant therapy. Primary antibodies targeting CD163, CD68, PD-1, CD8, PD-L1, and Pan-CK were used. Nuclei acids were stained with DAPI. D Comparison of fluorescence intensity for CD8+ and CD163+ cells. After staining, slides were scanned, and multilayer images were used for quantitative image analysis. The quantities of various cell populations were expressed as the number of stained cells per square millimetre in all nucleated cells. Due to limited tumour tissue obtained by biopsy, immunofluorescence experiments were performed without repetition. Source data are provided as a Source Data file.
Fig. 5
Fig. 5. Anti-angiogenesis evaluation.
A Representative immunofluorescence staining images of before and after neoadjuvant therapy tumour sections (Case No. 7, green for CD31, red for α-SMA, blue for DAPI). B Fluorescence intensity of CD31 and α-SMA expression before and after neoadjuvant therapy tumour tissues in all 20 patients. Whiskers represent min to max. Bounds of boxes represent 25th and 75th percentiles, centres represent medians, whiskers represent min to max. The significance for differences between before- and after neoadjuvant therapy was tested using a two-sided Wilcoxon signed-rank test. C Comparison of baseline CD31 and α-SMA fluorescence intensity between the MPR and non-MPR groups (n = 8 in the MPR group, n = 12 in the non-MPR group). The significance of the differences between the MPR and non-MPR groups was tested using a two-sided Mann‒Whitney test. Bars represent the mean with SD. Source data are provided as a Source Data file.

Similar articles

Cited by

References

    1. Johnson DE, et al. Head and neck squamous cell carcinoma. Nat. Rev. Dis. Prim. 2020;6:92. doi: 10.1038/s41572-020-00224-3. - DOI - PMC - PubMed
    1. Specenier P, Vermorken JB. Optimizing treatments for recurrent or metastatic head and neck squamous cell carcinoma. Expert Rev. Anticancer Ther. 2018;18:901–915. doi: 10.1080/14737140.2018.1493925. - DOI - PubMed
    1. Funt SA, Chapman PB. The role of neoadjuvant trials in drug development for solid tumors. Clin. Cancer Res. 2016;22:2323–2328. doi: 10.1158/1078-0432.CCR-15-1961. - DOI - PMC - PubMed
    1. Zhong LP, et al. Randomized phase III trial of induction chemotherapy with docetaxel, cisplatin, and fluorouracil followed by surgery versus up-front surgery in locally advanced resectable oral squamous cell carcinoma. J. Clin. Oncol. 2013;31:744–751. doi: 10.1200/JCO.2012.43.8820. - DOI - PMC - PubMed
    1. Bossi P, et al. Preoperative chemotherapy in advanced resectable OCSCC: long-term results of a randomized phase III trial. Ann. Oncol. 2014;25:462–466. doi: 10.1093/annonc/mdt555. - DOI - PubMed

Publication types

Associated data