. 2022 Sep 14;12(1):15427.
doi: 10.1038/s41598-022-19397-w.

Cytotoxic CD8+ T cells may be drivers of tissue destruction in Sjögren's syndrome

Affiliations

Cytotoxic CD8+ T cells may be drivers of tissue destruction in Sjögren's syndrome

Naoki Kaneko et al. Sci Rep. .

Abstract

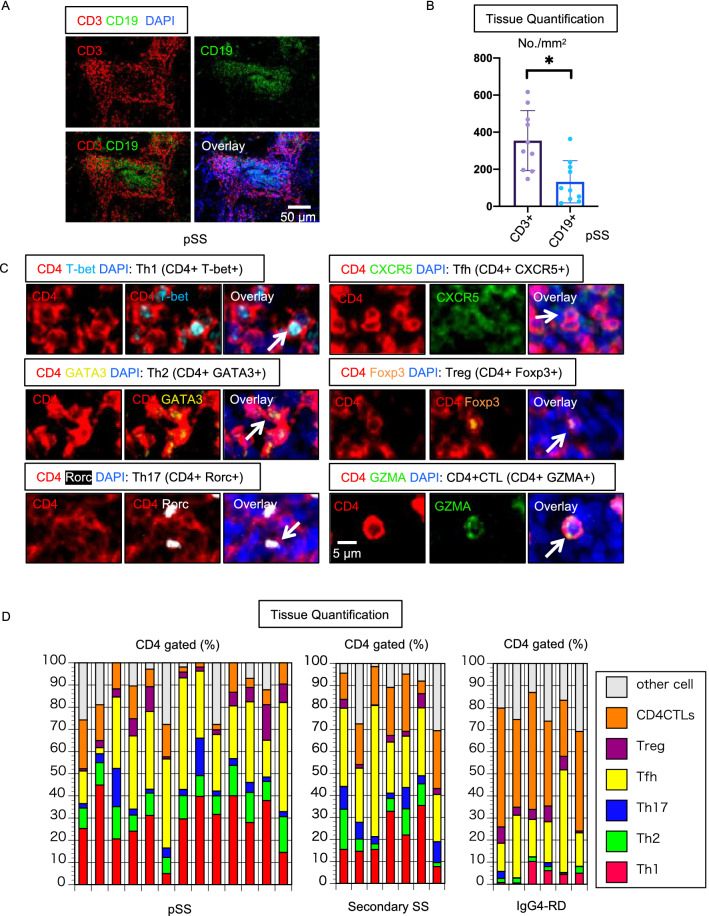
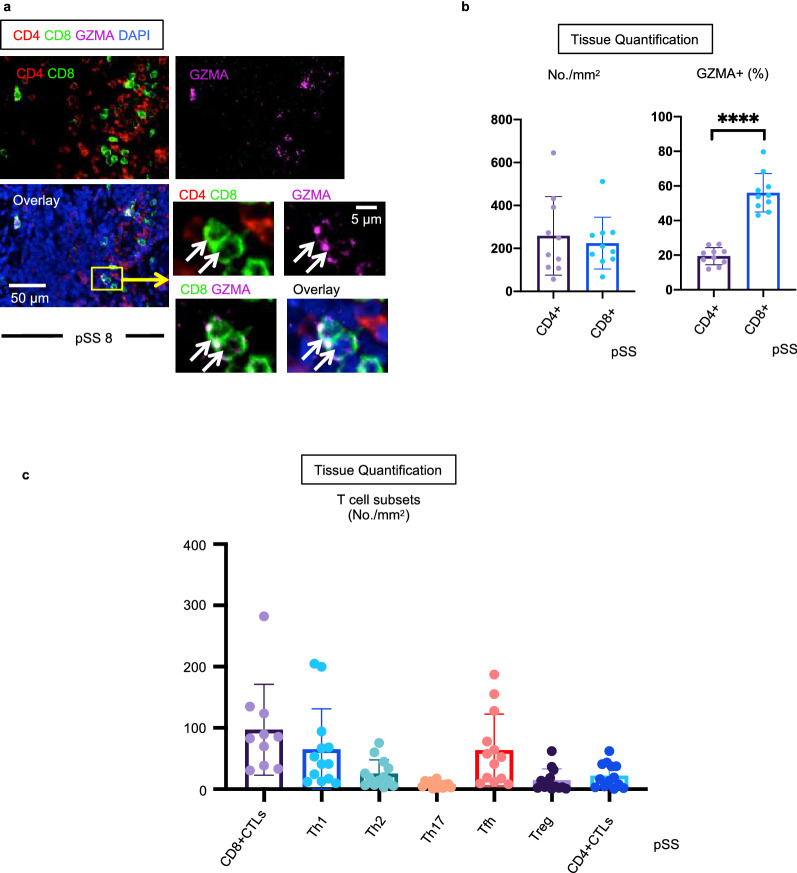
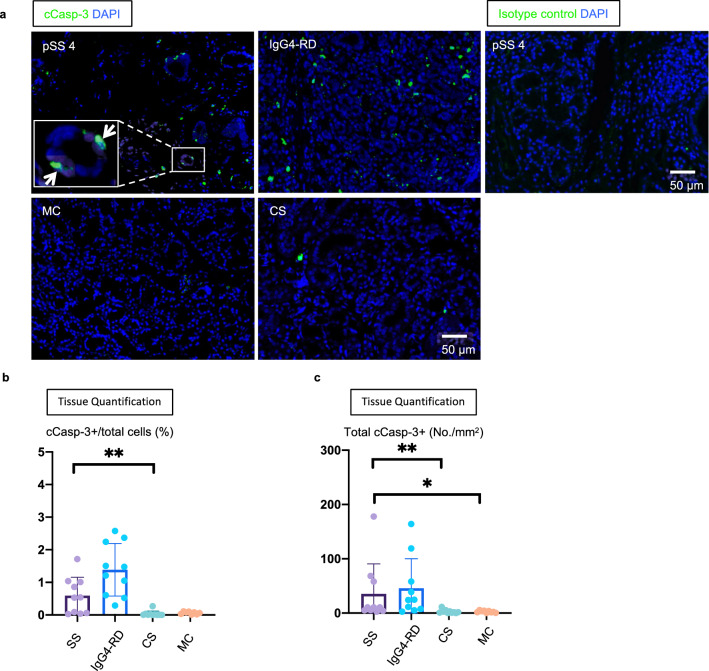
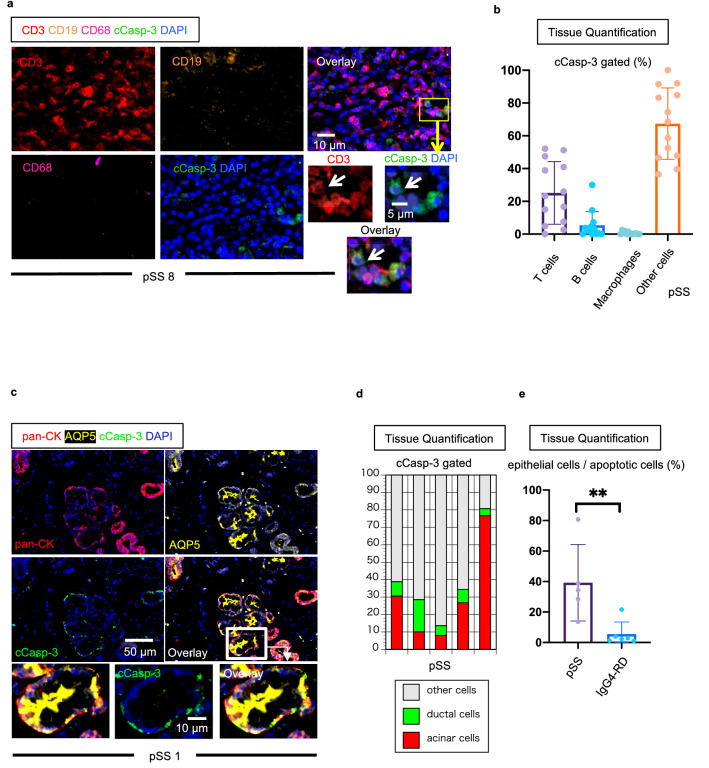
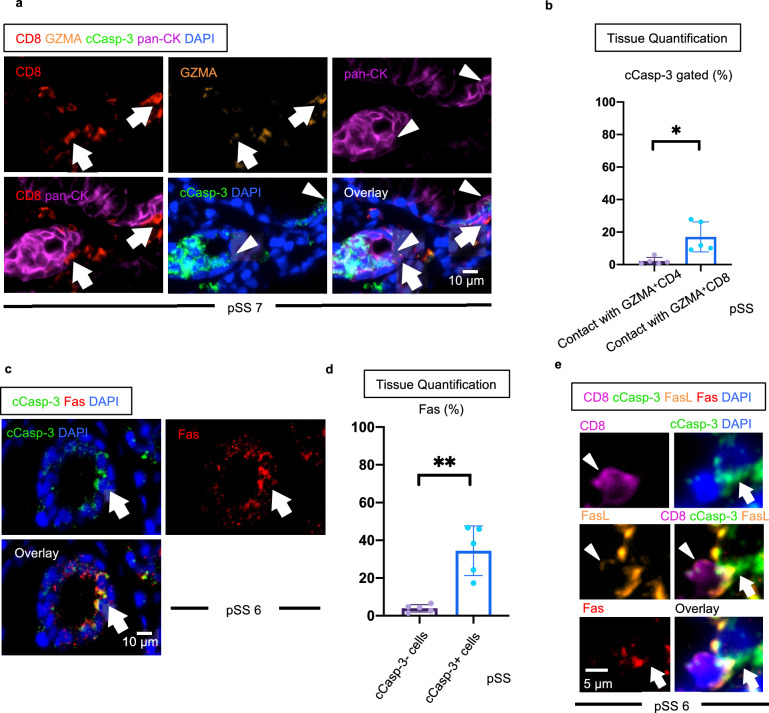
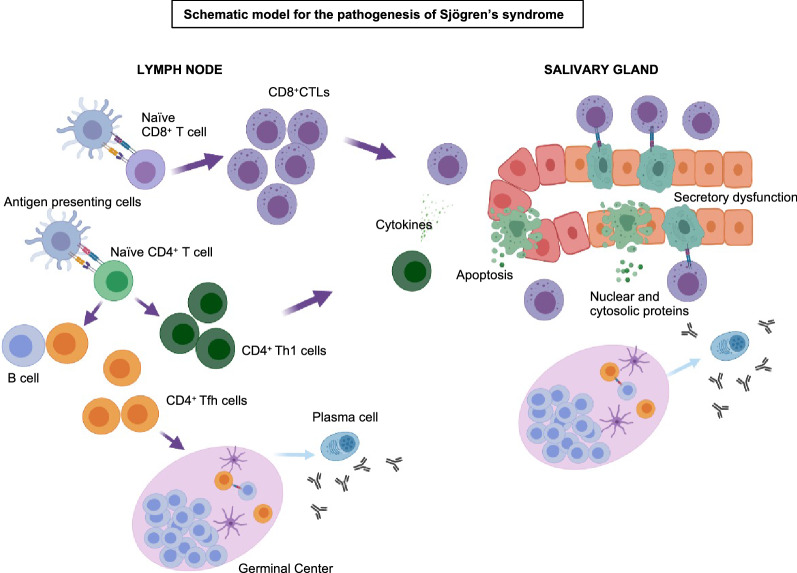
Sjögren's syndrome is a chronic autoimmune disorder whose pathogenesis is poorly understood and that lacks effective therapies. Detailed quantitative and spatial analyses of tissues affected by Sjögren's syndrome were undertaken, including the quantitation of the frequency of selected cell-cell interactions in the disease milieu. Quantitative analyses of CD4+ T cell subsets and of CD8+ T cells in the labial salivary glands from untreated patients with primary Sjögren's syndrome revealed that activated CD8+ cytotoxic T cells (CD8+CTLs) were the most prominent T cells in these infiltrates. An accumulation of apoptotic glandular epithelial cells, mainly ductal and acinar cells, was observed, consistent with the impaired salivary secretion often observed in patients with this disease. FasL expressing activated CD8+ T cells were seen to accumulate around Fas expressing apoptotic epithelial cells. Quantitative analyses of apoptotic cell types and of conjugates between cytotoxic T cells and epithelial cells undergoing apoptosis suggest that Sjögren's syndrome is primarily driven by CD8+CTL mediated execution of epithelial cells mainly represented by ductal and acinar cells.


Conflict of interest statement

The authors declare no competing interests.

Figures

Figure 1
Figure 1
The most prominent CD4T cell subsets in SS tissues are Th1 cells and Tfh cells. (a) Representative multi-color immunofluorescence image of CD3 (red), CD19 (green) and DAPI (blue) staining in a pSS lesion (patient number 2). (b) Absolute numbers of CD3+ T cells, CD19+ B cells in pSS (n = 10). Paired t test used to calculate p-value. (c) Representative multi-color staining showing each CD4+ T cell subset. [Th1: CD4+ (red) T-bet+ (light blue)] [Th2: CD4+ (red) GATA3+ (yellow)] [Th17: CD4+ (red) RORγ+ (white)] [Tfh: CD4+ (red) CXCR5+ (green)] [Treg: CD4+ (red) Foxp3+ (orange)] [CD4+ CTLs: CD4+ (red) GZMA+ (green)] (d) Relative proportions of Th1, Th2, Th17, Tfh, Treg and CD4+ CTL subsets in tissues from pSS (n = 13), secondary SS (n = 7) and IgG4-RD patients (n = 6). Error bars represent mean ± SEM. *p < 0.05.
Figure 2
Figure 2
GZMA expressing CD8+ CTLs represent the most prominent T cell population in SS. (a) Representative multicolor immunofluorescence images showing CD4 (red), CD8 (green), Granzyme A (GZMA)(purple) and DAPI (blue) staining in pSS. White arrows indicate CD8+GZMA+ cells that have infiltrated the labial gland. (b) Left panel shows absolute numbers of CD4+ T cells and CD8+ T cells in pSS (n = 10). Right panel shows % of GZMA+ in CD4+ T cells and CD8+ T cells in pSS (n = 10). Paired t test used to calculate p-value. (c) Absolute numbers of each T cell subset (n = 13) and CD8+GZMA+ T cell (n = 10) in pSS. Error bars represent mean ± SEM. ****p < 0.0001.
Figure 3
Figure 3
Apoptotic cells accumulate in tissues from SS and IgG4-RD patients. (a) Representative multi-color immunofluorescence images showing cleaved caspase-3 (cCasp-3) (green) and DAPI (blue) staining in pSS, IgG4-related disease (IgG4-RD), mucous cyst (MC) and chronic sialadenitis (CS). White arrows indicate cCasp-3 positive apoptotic cells. Right panel sowing isotype control (green) staining in pSS. (b and c) Absolute numbers (b) and proportions (c) of cCasp-3 positive apoptotic cells in pSS (n = 10), IgG4-RD (n = 10), MS (n = 8) and CS (n = 10). Multiple comparisons are controlled for by Dunn’s test. Error bars represent mean ± SEM. **p < 0.01; ***p < 0.001.
Figure 4
Figure 4
T cells, acinar cells and ductal cells account for a large proportion of apoptotic cells in tissues from SS patients. (a) Representative multi-color immunofluorescence image of CD3 (red), CD19 (orange), CD68 (purple), cCaps-3 (green) and DAPI (blue) staining in a pSS lesion. White arrows indicate apoptotic CD3+ T cells. (b) Proportions of apoptotic cells in pSS (n = 10) accounted for by T cells (red), B cells (green), Macrophages (blue) and other cells (gray). (c) Representative multi-color immunofluorescence images showing pan-CK (red), AQP5 (yellow), cCasp-3 (green) and DAPI (blue) staining in a pSS lesion. White arrows indicate a pan-CK+cCasp-3+ cell. (d) Proportions of apoptotic cells in pSS (n = 5) accounted for by acinar cells (red) (AQP5+, pan-CK+), ductal cells (green) (AQP5−, pan-CK+) and other cells (gray) (AQP5±, pan-CK−). (e) Relative proportions of cCasp-3+ cells expressing pan-CK or AQP5 or both in pSS (n = 5) and IgG4-RD (n = 6). Mann–Whitney U test used to calculate p-value. Error bars represent mean ± SEM. **p < 0.01; ***p < 0.001.
Figure 5
Figure 5
Epithelial cells expressing Fas are frequent targets of apoptosis in SS. (a) Representative multi-color immunofluorescence image showing GZMA (purple) expressing CD8+CTLs (white arrows) in close proximity to cCasp-3+ epithelial cells (arrow heads). (b) Relative proportions of cCasp-3+ cells in contact with CD4+ or CD8+ T cells. Paired t test was used to calculate p-value. (n = 5). (c) Multi-color immunofluorescence images of cCasp-3 (green), Fas (red) and DAPI (blue) staining. White arrows show cells co-expressing cCasp-3 (green) and Fas (red). (d) Relative proportions of cCasp-3−/+ cells expressing Fas (n = 5). Paired t test used to calculate p-value. (e) Multi-color immunofluorescence images show a CD8+ (purple) and FasL+ (orange) expressing cell in contact with a cCasp-3 (green) and Fas (red) expressing cell in a pSS tissue. Error bars represent mean ± SEM. **p < 0.01.
Figure 6
Figure 6
Schematic model for the pathogenesis of SS. Infiltration of tissues by Th1 CD4+ helper T cells and CD8+ T cells promotes inflammation, higher levels of Fas expression on epithelial (ductal/acinar) cells and CD8+ T cell mediated killing of acinar and ductal cell, resulting in irreversible secretory dysfunction. The antigenic targets of these CD8+ T cells are not known. The release of the contents of apoptotic cells including Ro/SS-A and La/SS-B and Tfh cells may help differentiation of B cells to plasma cells which produce antibodies to these autoantigens.

Similar articles

Cited by

References

    1. Fox RI. Sjogren's syndrome. Lancet. 2005;366:321–331. doi: 10.1016/s0140-6736(05)66990-5. - DOI - PubMed
    1. Vivino FB, et al. New treatment guidelines for Sjogren's disease. Rheum. Dis. Clin. N. Am. 2016;42:531–551. doi: 10.1016/j.rdc.2016.03.010. - DOI - PMC - PubMed
    1. Menendez A, et al. Common and specific associations of anti-SSA/Ro60 and anti-Ro52/TRIM21 antibodies in systemic lupus erythematosus. TheScientificWorldJOURNAL. 2013;2013:832789. doi: 10.1155/2013/832789. - DOI - PMC - PubMed
    1. Bowman SJ, et al. Randomized controlled trial of rituximab and cost-effectiveness analysis in treating fatigue and oral dryness in primary Sjögren's syndrome. Arthritis Rheumatol. 2017;69:1440–1450. doi: 10.1002/art.40093. - DOI - PubMed
    1. Devauchelle-Pensec V, et al. Treatment of primary Sjögren syndrome with rituximab: A randomized trial. Ann. Intern. Med. 2014;160:233–242. doi: 10.7326/m13-1085. - DOI - PubMed

Publication types

MeSH terms