. 2022 Sep 14;12(1):15479.
doi: 10.1038/s41598-022-19925-8.

The p-ERG spatial acuity in the biomedical pig under physiological conditions

Affiliations

The p-ERG spatial acuity in the biomedical pig under physiological conditions

Domenico Ventrella et al. Sci Rep. .

Abstract

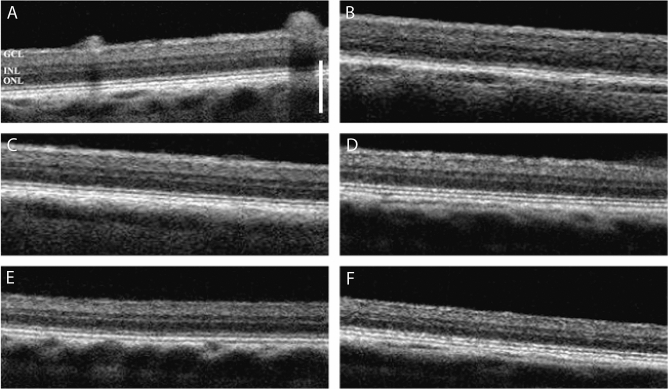
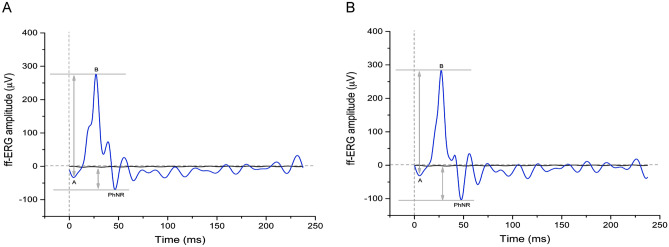
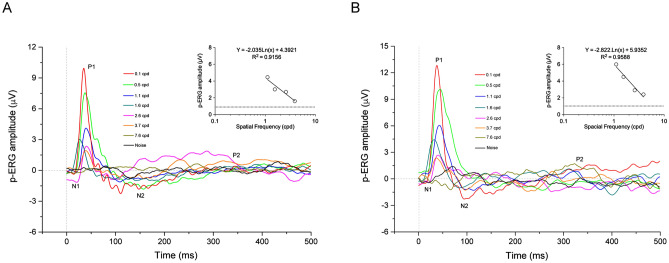
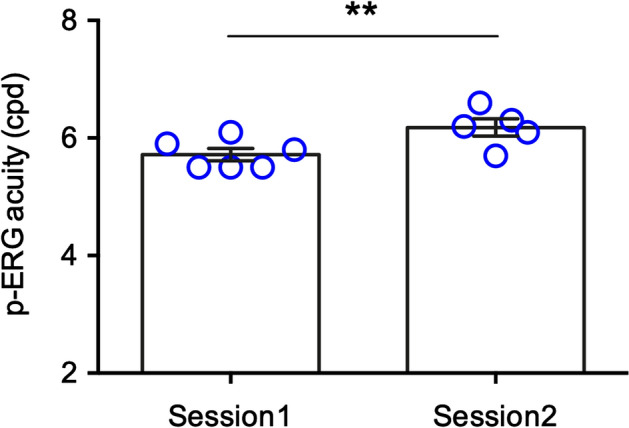
Pigs are becoming an important pre-clinical animal species for translational ophthalmology, due to similarities with humans in anatomical and physiological patterns. Different models of eye disorders have been proposed, and they are good candidates to assess biocompatibility/functionality of retinal prostheses. Electroretinography is a common tool allowing to gain information on retinal function, with several types of electroretinogram (ERG) been implemented including full field (ff-ERG), multifocal (mf-ERG) and pattern (p-ERG). p-ERG represents a valuable tool to monitor Retinal Ganglion Cells (RGCs) activity and can be used to calculate p-ERG spatial acuity. Unfortunately, scarce methodological data are available regarding recording/interpretation of p-ERG and retinal acuity in biomedical pigs yet enhancing knowledge regarding pig vision physiology will allow for more refined and responsible use of such species. Aim of this study was to record p-ERG in juvenile pigs to functionally assess visual acuity. Six female hybrid pigs underwent two p-ERG recording sessions at 16 and 19 weeks of age. Photopic ff-ERG were also recorded; optical coherence tomography (OCT) and histology were used to confirm retinal integrity. ff-ERG signals were repeatable within/across sessions. All p-ERG traces consistently displayed characterizing peaks, and the progressive decrease of amplitude in response to the increment of spatial frequency revealed the reliability of the method. Mean p-ERG spatial acuities were 5.7 ± 0.14 (16 weeks) and 6.2 ± 0.15 cpd (19 weeks). Overall, the p-ERG recordings described in the present work seem reliable and repeatable, and may represent an important tool when it comes to vision assessment in pigs.


Conflict of interest statement

The authors declare no competing interests.

Figures

Figure 1
Figure 1
Representative optical coherence tomography (OCT) scans of the right eye in each experimental pig (AF). The images show no morphological alterations of the retina. GCL, ganglion cell layer; INL, inner nuclear layer; ONL, outer nuclear layer. The structural organization of the retina is normal in all experimental animals. Scale bar, 250 µm.
Figure 2
Figure 2
Representative ff-ERG traces for the first (A) and second (B) electrophysiological sessions. The morphology of the electrophysiological responses to flashes of light is similar but not identical between the two time points. Note that the ΔA-B response slightly increases in the second session, as does the PhNR response (midline to peak). A, a-wave; B, b-wave; PhNR, photopic negative response.
Figure 3
Figure 3
Representative p-ERG traces recorded in response to stimulation with sinusoidal gratings of increasing spatial frequency during the first (A) and second (B) electrophysiological session. The analysis of the electroretinographic responses showed the progressive decrease of p-ERG amplitude (ΔN1-P1) after enhancing the spatial frequency (different colors) of visual stimuli. Insert panels depict the regression line from which retinal acuity is computed. cpd, cycles per degree.
Figure 4
Figure 4
p-ERG acuity in the experimental animals during the two recording sessions. The electrical signals recorded during the first session significantly increased in the second one suggesting a developmental maturation of the spatial resolution. **p = 0.0032; paired t-test.
Figure 5
Figure 5
Linear regression analysis showing that p-ERG occurrence is positively correlated with the amplitude of the PhNR. The Pearson’s correlation coefficient shows a positive correlation between p-ERGs (1.552 cpd) and PhNRs during the first electrophysiological session (p = 0.0379). A not significant trend was observed (p = 0.1146) during the second session. Sample size: (A) n = 6, first session; (B) n = 5, second session.

Similar articles

Cited by

References

    1. Ventrella D, et al. The biomedical piglet: Establishing reference intervals for haematology and clinical chemistry parameters of two age groups with and without iron supplementation. BMC Vet. Res. 2017;13:23. doi: 10.1186/s12917-017-0946-2. - DOI - PMC - PubMed
    1. Ventrella D, et al. Age-related 1H NMR characterization of cerebrospinal fluid in newborn and young healthy piglets. PLoS ONE. 2016;11:e0157623. doi: 10.1371/journal.pone.0157623. - DOI - PMC - PubMed
    1. Scholz T, Pharaon M, Evans GRD. Peripheral nerve anatomy for regeneration studies in pigs: Feasibility of large animal models. Ann. Plast. Surg. 2010;65:43–47. doi: 10.1097/SAP.0b013e3181bb4d13. - DOI - PubMed
    1. Elmi A, et al. 1H NMR spectroscopy characterization of porcine vitreous humor in physiological and photoreceptor degeneration conditions. Invest. Ophthalmol. Vis. Sci. 2019;60:741–747. doi: 10.1167/iovs.18-25675. - DOI - PubMed
    1. Barone F, et al. The porcine iodoacetic acid model of retinal degeneration: Morpho-functional characterization of the visual system. Exp. Eye Res. 2020;193:107979. doi: 10.1016/j.exer.2020.107979. - DOI - PubMed

Publication types

Substances