. 2022 Nov;32(11):969-981.
doi: 10.1038/s41422-022-00712-z. Epub 2022 Sep 14.

CRISPR FISHer enables high-sensitivity imaging of nonrepetitive DNA in living cells through phase separation-mediated signal amplification

Affiliations

CRISPR FISHer enables high-sensitivity imaging of nonrepetitive DNA in living cells through phase separation-mediated signal amplification

Xin-Yuan Lyu et al. Cell Res. 2022 Nov.

Erratum in

Abstract

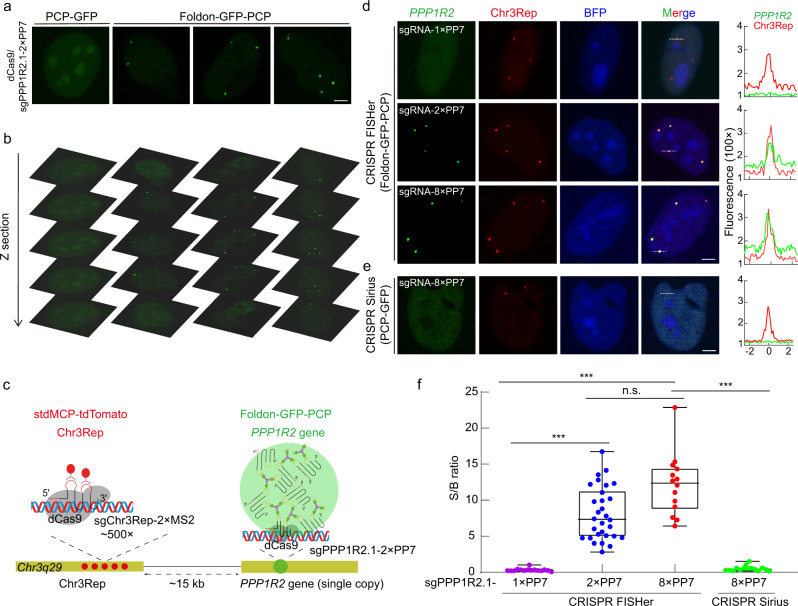
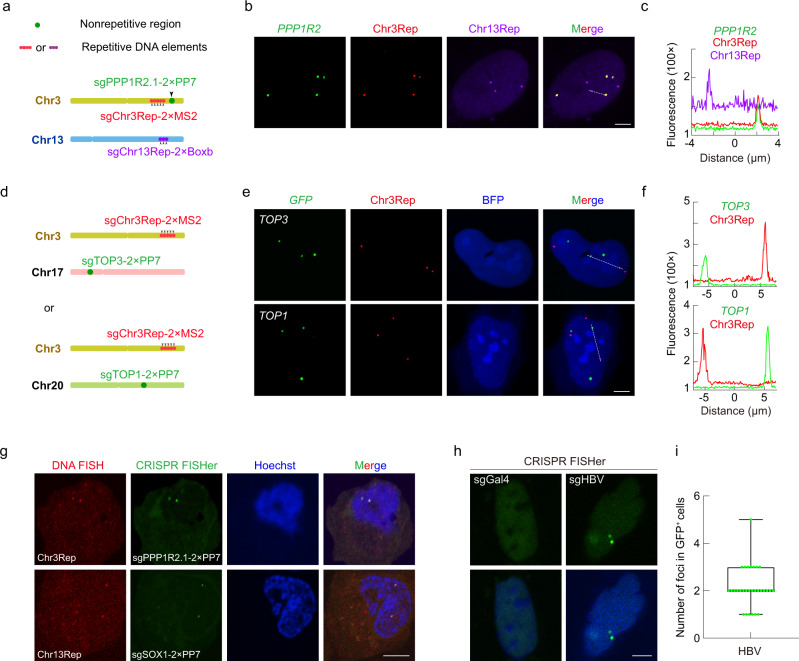
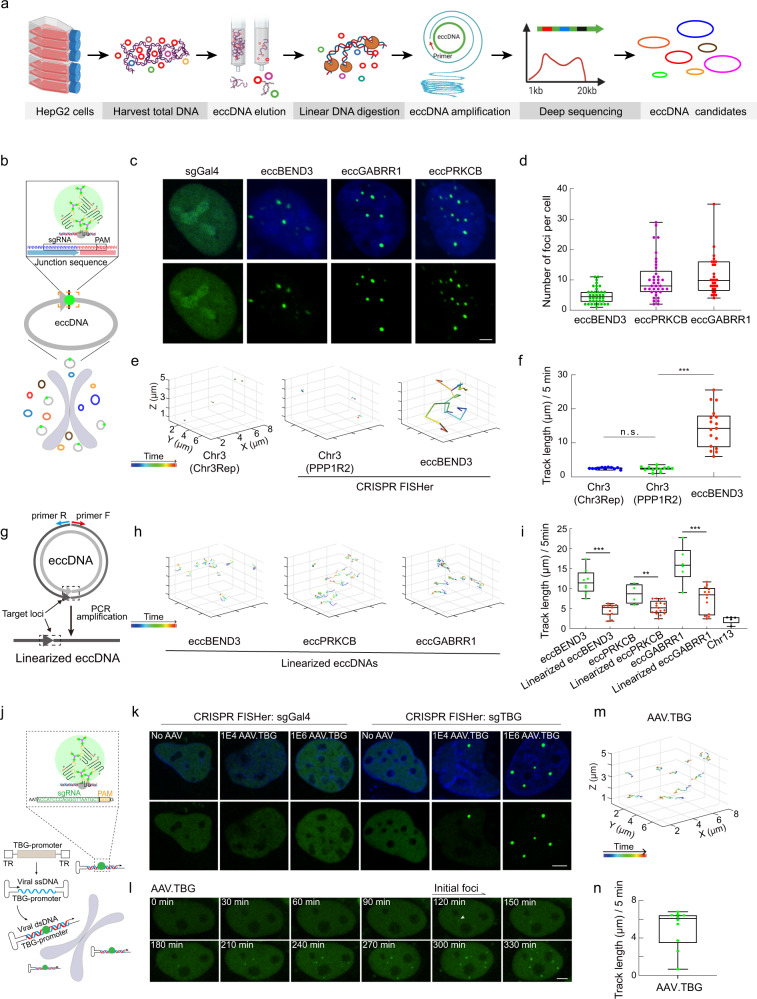
The dynamic three-dimensional structures of chromatin and extrachromosomal DNA molecules regulate fundamental cellular processes and beyond. However, the visualization of specific DNA sequences in live cells, especially nonrepetitive sequences accounting for most of the genome, is still vastly challenging. Here, we introduce a robust CRISPR-mediated fluorescence in situ hybridization amplifier (CRISPR FISHer) system, which exploits engineered sgRNA and protein trimerization domain-mediated, phase separation-based exponential assembly of fluorescent proteins in the CRISPR-targeting locus, conferring enhancements in both local brightness and signal-to-background ratio and thus achieving single sgRNA-directed visualization of native nonrepetitive DNA loci in live cells. In one application, by labeling and tracking the broken ends of chromosomal fragments, CRISPR FISHer enables real-time visualization of the entire process of chromosome breakage, separation, and subsequent intra- or inter-chromosomal ends rejoining in a single live cell. Furthermore, CRISPR FISHer allows the movement of small extrachromosomal circular DNAs (eccDNAs) and invading DNAs to be recorded, revealing substantial differences in dynamic behaviors between chromosomal and extrachromosomal loci. With the potential to track any specified self or non-self DNA sequences, CRISPR FISHer dramatically broadens the scope of live-cell imaging in biological events and for biomedical diagnoses.


Conflict of interest statement

C.-Q.S., E.-Z.S., X.-Y.L., and Y.D. are co-inventors of a patent filed by Westlake Laboratory of Life Sciences.

Figures

Fig. 1
Fig. 1. Trimeric foldon triggers the assembly of foldon-GFP-PCP protein and sgRNA with PP7 aptamers.
a, b Purified proteins PCP-GFP and foldon-GFP-PCP separated by SDS-PAGE (a) and native PAGE (b). c Representative photomicrographs for PCP-GFP and foldon-GFP-PCP each incubating with a series of sgRNAs, including normal sgRNA or sgRNA with PP7 aptamers. In this assay, the concentrations of PCP-GFP, foldon-GFP-PCP and sgRNA were 1 μM, 1 μM, and 0.5 μM, respectively. The area for each field was 1695 μm2. d GFP dots per 15,250 μm2 after immediate incubation. The concentration of PCP-GFP and foldon-GFP-PCP each was 1 μM. e Proposed assembly mode for PCP-GFP or foldon-GFP-PCP with sgRNAs and engineered sgRNA with PP7 aptamers.
Fig. 2
Fig. 2. Foldon-GFP-PCP enables robust repetitive genomic loci tracking with enhanced S/B ratio by CRISPR FISHer.
a Schematic diagram of CRISPR FISHer being recruited to the target site. Trimerized foldon-GFP-PCP was assembled at Chr3q29 locus (~500 copies, termed as Chr3Rep) targeted by dCas9-mCherry/sgChr3Rep-2×PP7 complex. b The enrichment of foldon-GFP-PCP at the Chr3Rep loci (arrows) labeled by dCas9-mCherry in live U2OS cell. Foldon-GFP-PCP foci started to occur ~4 h post transfection. The stars show nucleolar dCas9-mCherry accumulation. c Representative images showing colocalization of foldon-GFP-PCP (green) and dCas9-mCherry (red) on the Chr3Rep locus in U2OS, HeLa, and HepG2 cells. The plasmids expressing foldon-GFP-PCP, dCas9-mCherry, sgChr3Rep-2×PP7, and BFP were co-transfected. BFP was used as an indicator of the nuclei and sgRNA-2×PP7 expression. d Comparison of foldon-GFP-PCP, PCP-GFP, and dCas9-EGFP labeling of telomere loci in U2OS cells. sgGal4 is used as the negative control. The dotted lines (up) label area used to generate respective line scans (down). Middle, the spatial distribution of telomere loci. See Supplementary information, Video S1. e Comparison of S/B ratio of labeled telomere loci using foldon-GFP-PCP, PCP-GFP, and dCas9-EGFP. Data are presented as means ± SEM in e for dCas9-EGFP (2.273 ± 0.838, n = 20), PCP-GFP (2.619 ± 1.912, n = 20) and foldon-GFP-PCP (165.646 ± 36.038, n = 20). Two-tailed Student’s t-test was performed (ns nonsignificance; ***P < 0.001). f Schematic diagram of CRISPR FISHer at a telomere locus.
Fig. 3
Fig. 3. CRISPR FISHer achieves the visualization of the endogenous nonrepetitive genomic region.
a Representative images for PPP1R2 gene signal labeled by PCP-GFP or foldon-GFP-PCP. Scale bar, 5 µm. b Representative PPP1R2 loci distribution in serial Z-sections for a. c Schematic diagram of dual-color CRISPR imaging for loci PPP1R2 (GFP) and Chr3Rep (tdTomato). d, e Comparison of foldon-GFP-PCP and PCP-GFP labeling of single-copy gene PPP1R2. sgPPP1R2.1-1×PP7, sgPPP1R2.1-2×PP7 or sgPPP1R2.1-8×PP7 was used for targeting the PPP1R2 gene (green); sgChr3Rep-2×MS2 was used for labeling Chr3Rep loci (red, internal control). The dotted lines (left) mark area for producing line scans (right). Scale bar, 5 µm. f Comparison of S/B ratio of labeled PPP1R2 loci using CRISPR FISHer (foldon-GFP-PCP) and CRISPR Sirius (PCP-GFP). Two-tailed Student’s t-test was performed (ns nonsignificance; ***P < 0.001).
Fig. 4
Fig. 4. CRISPR FISHer allows for visualization of the endogenous nonrepetitive genomic region and exogenous HBV diagnosis in live cells.
a, b Three-color CRISPR imaging of loci for PPP1R2 gene (green), Chr3Rep (red), and Chr13Rep (purple) in U2OS cells. Schematic diagram of target loci on Chr3 and Chr13 (a). Representative in situ imaging for PPP1R2 gene (green, foldon-GFP-PCP), Chr3Rep (red, stdMCP-tdTomato), and Chr13Rep (purple, N22-Halo) (b). Scale bar, 5 µm. Also see Supplementary information, Video S2. c Line trace showing the dotted line-marked area in b. d, e Visualization of single-copy gene TOP3 or TOP1 by CRISPR FISHer in U2OS cells. Schematic diagram of target loci on Chr3 and Chr17 or Chr20 (d). Representative images for TOP3 or TOP1 gene (green, foldon-GFP-PCP) and Chr3Rep (red, stdMCP-tdTomato, internal control) (e). Scale bar, 5 µm. f The line scan showing the dotted line-marked area in e. g DNA FISH and CRISPR FISHer foci pairs. Alexa Fluor 568 DNA FISH probe labeled Chr3Rep and Chr13Rep loci; CRISPR FISHer labeled PPP1R2 and SOX1 loci. Scale bar, 5 µm. h, i The visualization of HBV by CRISPR FISHer in live Hep3B cells. Representative HBV signal in Hep3B cells (h). sgGal4 is used as the negative control. Scale bar, 5 µm. The number of HBV loci in Hep3B cells (n = 30) (i).
Fig. 5
Fig. 5. Simultaneous imaging of multiple CRISPR target loci tracks real-time dynamics of DNA DSB-induced chromosomal dissociation and subsequent intra- and interchromosomal rejoining in live cells.
a Schematic diagram of intrachromosomal separation and rejoining through labeling both sides of the cutting site. Chr3Rep and PPP1R2 gene on Chr3 were labeled by CRISPR Sirius and CRISPR FISHer in U2OS cells. SaCas9/sgRNA was delivered by nucleofection (16 h after delivering DNA loci labeling systems) for inducing DSB between the two labeled loci. b Representative fluorescent images of DSB-induced intrachromosomal dissociation and rejoining in a single cell. White boxes show DNA loci pairs. Scale bar, 5 µm. c, d Time-lapse imaging and corresponding distance of DNA loci of pair 1 in b. Scale bar, 1 µm. e, f Time-lapse imaging and corresponding distance of DNA loci of pairs 2 and 3 in b. After separation and association of Chr3 fragments, pairs 2 and 3 gradually gathered as shown in e. Scale bar, 1 µm. g Schematic diagram of DSB-induced interchromosomal translocation between Chr3 and Chr13. The labeling strategy is similar to Fig. 4a. saCas9/sgRNA was delivered to produce DNA cutting between the labeled loci on Chr3 and SPACA7 gene on Chr13. h Representative images showing intrachromosomal dissociation and interchromosomal translocation between Chr3 and Chr13. Colored arrows indicate three DNA loci for tracking (green, PPP1R2; red, Chr3Rep; purple, Chr13Rep). The white box shows local enlargement. Time-lapse imaging started from 4 h post saCas9/sgRNA delivery. Scale bar, 1 µm. i Distance of DNA loci pairs shown in h. The red line shows the distance between Chr3Rep (red) and PPP1R2 (green) paired foci; the purple line shows the distance between Chr13Rep (purple) and PPP1R2 (green) paired foci.
Fig. 6
Fig. 6. CRISPR FISHer detection and real-time visualization of native extrachromosomal eccDNAs and invading AAV DNA in live cells.
a Schematic diagram of the isolation, enrichment, amplification, and deep sequencing of eccDNAs from HepG2 cells. b The schematic strategy of the eccDNA labeling with CRISPR FISHer. sgRNA target sites are located at junction regions of eccDNAs. c, d Representative images showing labeled eccDNAs by CRISPR FISHer in HepG2 cells (c) and the number of eccDNA foci (d). e Representative XYZ-t trajectories for eccBEND3 and Chr3 loci during a 5-min period. See Supplementary information, Videos S3‒S5 for dynamics. f Comparison of tracking length of eccBEND3 and Chr3 in HepG2 cells. Two-tailed Student’s t-test was performed (ns nonsignificance, ***P < 0.001). g The schematic diagram of the linearized eccDNA amplified from eccDNA by PCR. Dotted boxes indicate the CRISPR FISHer targeting locus as well as junction regions of eccDNA. h Representative XYZ-t trajectories for linearized eccDNAs during a 5-min period. See Supplementary information, Videos S9‒S11 for dynamics. i Tracking length of circular and linearized eccDNAs as well as Chr13. Two-tailed Student’s t-test was performed (ns nonsignificance, ***P < 0.001). j Schematic diagram showing the labeling strategy of adeno-associated virus (AAV) with CRISPR FISHer. k, l Representative images showing nuclear ds AAV DNA loci labeled by CRISPR FISHer in U2OS cells. The appearance and increasing formation of ds AAV DNA foci over time were shown in a single live cell (l). The sgRNA targeting mouse TBG carried by AAV was used. 1E4 or 1E6 particles of AAV.TBG was used for detection. m, n Representative trajectory (m) and tracking length (n) for ds AAV DNA loci in U2OS cells. See Supplementary information, Video S12 for dynamics. sgGal4 was used as the control sgRNA in c and k. Scale bars in c, k and l, 5 µm.

Similar articles

Cited by

References

    1. Dekker J, et al. The 4D nucleome project. Nature. 2017;549:219–226. doi: 10.1038/nature23884. - DOI - PMC - PubMed
    1. Ain Q, Schmeer C, Wengerodt D, Witte OW, Kretz A. Extrachromosomal circular DNA: Current knowledge and implications for CNS aging and neurodegeneration. Int. J. Mol. Sci. 2020;21:2477. doi: 10.3390/ijms21072477. - DOI - PMC - PubMed
    1. Foxman EF, Iwasaki A. Genome-virome interactions: Examining the role of common viral infections in complex disease. Nat. Rev. Microbiol. 2011;9:254–264. doi: 10.1038/nrmicro2541. - DOI - PMC - PubMed
    1. Dixon JR, et al. Topological domains in mammalian genomes identified by analysis of chromatin interactions. Nature. 2012;485:376–380. doi: 10.1038/nature11082. - DOI - PMC - PubMed
    1. Roukos V, et al. Spatial dynamics of chromosome translocations in living cells. Science. 2013;341:660–664. doi: 10.1126/science.1237150. - DOI - PMC - PubMed

Publication types

MeSH terms