. 2022 Sep;609(7927):529-534.
doi: 10.1038/s41586-022-04981-x. Epub 2022 Sep 14.

Rapid shifting of a deep magmatic source at Fagradalsfjall volcano, Iceland

Affiliations

Rapid shifting of a deep magmatic source at Fagradalsfjall volcano, Iceland

Sæmundur A Halldórsson et al. Nature. 2022 Sep.

Abstract

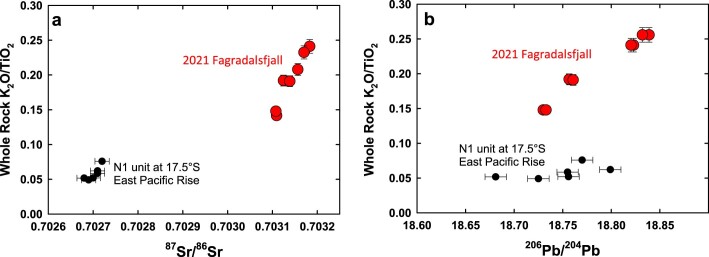
Recent Icelandic rifting events have illuminated the roles of centralized crustal magma reservoirs and lateral magma transport1-4, important characteristics of mid-ocean ridge magmatism1,5. A consequence of such shallow crustal processing of magmas4,5 is the overprinting of signatures that trace the origin, evolution and transport of melts in the uppermost mantle and lowermost crust6,7. Here we present unique insights into processes occurring in this zone from integrated petrologic and geochemical studies of the 2021 Fagradalsfjall eruption on the Reykjanes Peninsula in Iceland. Geochemical analyses of basalts erupted during the first 50 days of the eruption, combined with associated gas emissions, reveal direct sourcing from a near-Moho magma storage zone. Geochemical proxies, which signify different mantle compositions and melting conditions, changed at a rate unparalleled for individual basaltic eruptions globally. Initially, the erupted lava was dominated by melts sourced from the shallowest mantle but over the following three weeks became increasingly dominated by magmas generated at a greater depth. This exceptionally rapid trend in erupted compositions provides an unprecedented temporal record of magma mixing that filters the mantle signal, consistent with processing in near-Moho melt lenses containing 107-108 m3 of basaltic magma. Exposing previously inaccessible parts of this key magma processing zone to near-real-time investigations provides new insights into the timescales and operational mode of basaltic magma systems.


Conflict of interest statement

The authors declare no competing interests.

Figures

Fig. 1
Fig. 1. Geological setting.
a, Geological setting of the RP and the ITSCs of Reykjanes, Svartsengi, Fagradalsfjall, Krýsuvík and Brennisteinsfjöll extending from west to east are shown in bold. The inset map of Iceland shows the location of the RP. Scale bar, 5 km b, The Fagradalsfjall ITSC and the eruption sites. The extent of the lava field corresponds to 10 May 2021. The eruptive vents are shown with red circles. Sampling localities are also shown with white diamonds. Scale bar, 1 km. Source data
Fig. 2
Fig. 2. Chemical characteristics of the Fagradalsfjall volcanic products.
a,b, K2O/TiO2 versus MgO of the Fagradalsfjall whole-rock samples compared to historical lavas from other ITSCs on the RP,, (a) and single-eruptive Icelandic basaltic lavas from different parts of the rift system for which large datasets are available (ref. and references therein) (b). Error bars are included on both panels and include external 2σ error. Source data
Fig. 3
Fig. 3. Temporal trends evident over the course of the first 50 days of 2021 Fagradalsfjall eruption.
ac, K2O/TiO2 (a), La/Yb (b) and 206Pb/204Pb (c) versus days after start of the eruption. The kernel density estimates on the edges of a and b show the distribution of measured K2O/TiO2 and La/Yb for Fagradalsfjall MIs and the dashed line is the MI mean. The bandwidths are estimated using Scott’s rule: 0.14 for La/Yb and 0.036 for K2O/TiO2. Error bars are included and indicate external 2σ error for geochemical data and a possible range of eruption days when not known precisely. Error bars for 206Pb/204Pb are generally smaller than the symbol. For glass data error estimation, see Extended Data Fig. 2c. Source data
Fig. 4
Fig. 4. Conceptual model of melt extraction, accumulation, mixing and crustal ascent beneath Fagradalsfjall.
a, Melt storage pressures obtained by olivine-plagioclase-augite-melt (OPAM) barometry using compositions from glass, and MIs, clinopyroxene (cpx)–liquid barometry from crystal cores and rims, and the storage pressures consistent with the gas CO2/SO2 ratio, assuming closed-system degassing. The curves are kernel density estimates produced using a bandwidth based on the number of data points (Scott’s rule), which in all cases was greater than the measurement uncertainty. b, The lava erupted at the start of the eruption was depleted in composition, consistent with shallow, high-degree melting of a relatively depleted mantle source (yellow). However, as the eruption progressed, the melts became increasingly enriched, consistent with deeper, lower-degree partial melting of a more enriched mantle source (red). Note the reversed axis for La/Yb. c, A conceptual model of melt extraction, accumulation and crustal ascent beneath Fagradalsfjall. Melts are generated in the mantle and ascend to a near-Moho storage zone where crystallization, mixing and degassing occur before eruption. d, Evolution of a near-Moho reservoir that explains the erupted lava compositions at Fagradalsfjall. Initially, the magma reservoir contained depleted melt, but over the course of the eruption continuous recharge of enriched melt resulted in a compositional change within the magma reservoir. Source data
Extended Data Fig. 1
Extended Data Fig. 1. Petrographic features of the Fagradalsfjall lava.
Petrographic features of the Fagradalsfjall samples seen in backscattered electron images. a. Quenched lava, essentially without macrocrysts. b. Tephra with olivine macrocrysts containing spinel inclusions. c. Glomerocryst of Plag-Cpx-Ol with MI (important for OPAM). d. Macrocryst (Ol) with MIs in both core and rim (rim in equilibrium with the carrier melt, core is too primitive). Ol – olivine, Plag – plagioclase, Cpx-clinopyroxene, Gl – silicate glass, Sp – Cr-spinel, MI – silicate melt inclusion.
Extended Data Fig. 2
Extended Data Fig. 2. Chemical Characteristics of the Fagradalsfjall lava.
a, TiO2 versus MgO for whole rock and glass/tephra samples of the Fagradalsfjall eruption. For comparison, whole rock samples from other intra-transform spreading centers on the Reykjanes Peninsula are also shown,,. b, A single olivine crystal from sample G20210321-4 showing MIs with both low and high K2O/TiO2 and La/Yb. c-d, K2O/TiO2 and La/Yb vs. MgO, for whole rock and tephra samples compared to plagioclase (Plg), olivine (Ol) and clinopyoxene (Cpx) melt inclusions. In c, white stars represent the depleted (DM) and enriched (EM) parental melt end-member of the Reykjanes Peninsula. Error bars are included on all panels and include external 2σ error for all whole rock and glass data (where average EPMA 2σ error is reported in the lower left corner) but 1σ error the SIMS data plotted in panel d. Source data
Extended Data Fig. 3
Extended Data Fig. 3. Mineral compositions.
The range in a. Fo content of olivine, b. Mg# of clinopyroxene, c. An content of plagioclase and, d. Cr# of spinel. Core and rim compositions are depicted as circles and diamonds, respectively. Red bar shows the mineral compositions in equilibrium with the most primitive melt inclusions, pink bars are equilibrium compositions with a whole rock-like liquid, whereas purple bars indicate mineral compositions in equilibrium with tephra glass sampled in March. Numbers in each corner state the number of point analyses in minerals. Variation diagrams showing the NiO vs Fo content of olivine e., Al2O3/TiO2 vs Mg# clinopyroxene f., FeO content vs An content of plagioclase g. and Mg# vs Cr# in spinel macrocrysts h. Kernel density estimates on the top axis produced using a bandwidth of 0.2 show the relative probability of mineral compositions, determining the main compositional populations in each mineral. Representative error bars are included on all panels and include external 2σ error. Source data
Extended Data Fig. 4
Extended Data Fig. 4. Trace elements and radiogenic isotope compositions.
a, La/Yb vs. K2O/TiO2. b, Pb isotope vs K2O/TiO2, c, Primitive mantle normalized trace element patterns for the Fagradalsfjall samples reported here. Normalised to the primitive mantle. Lighter colors represent earlier eruption dates. d, La vs. La/Yb with samples dates. e, Sr vs. Nd isotopes plotted with samples dates. f, Pb isotope plot with samples dates. Comparative data from other Reykjanes Peninsula lavas erupted historically (i.e., erupted after Settlement, circa AD 870) are from,,. Error bars are included on panels except c and include external 2σ error. Source data
Extended Data Fig. 5
Extended Data Fig. 5. CIPW molecular normative plot of glass, melt inclusions and whole rock compositions.
CIPW molecular normative plot, which includes the tholeiitic portion of the basalt tetrahedron, Ol-Cpx-Plag-Qz, projected from the plagioclase apex. The approximate location of the cotectic with olivine (ol), plagioclase (plag) and clinopyroxene (cpx) in equilibrium with melts like those found in the Fagradalsfjall eruption products is shown for two different pressures, 0.1 MPa and 0.5 GPa (calculated using the OPAM code in ref. ). The compositions of the most primitive olivine MI are consistent with a short temperature interval of olivine-only fractionation. At a lower temperature, plagioclase and clinopyroxene join olivine as crystallizing phases. Symbols are the same as shown in Extended Data Fig. 2c, d. Source data
Extended Data Fig. 6
Extended Data Fig. 6. Inferred pressures and temperatures of crystallization from thermobarometry.
Using the olivine–plagioclase–augite–melt (OPAM) barometer (Methods), we calculate that the carrier melt of the crystal cargo, inferred from groundmass glass compositions equilibrated over the pressure range of 0.05 to 0.25 GPa in samples collected from March and early April. This coincides with calculated crystallization pressure of the evolved clinopyroxene macrocryst rims and cores suggesting crystallization in the mid- to upper crust. In contrast, glasses from the fire fountaining phase (late April-early May) and MI equilibrated at much higher pressures with the primitive crystal cargo, from 0.36 to 0.8 GPa with most probable pressures of 0.55 to 0.65 GPa. This is close to the values obtained from the cores of some of the primitive clinopyroxene macrocrysts (up to 0.52 GPa –Methods). We have also calculated the expected CO2/SO2 in the gas phase, assuming CO2 vapour saturation at various pressures of storage, followed by near-complete degassing of CO2 and SO2 during eruption (Methods). The contour lines show that the CO2/SO2 ratio observed at the vent can only be obtained if the magma rises from at least 0.5 GPa pressure. Model error (2σ) is indicated with the grey error bar. See Methods for details. Source data
Extended Data Fig. 7
Extended Data Fig. 7. Volatile elements in melt inclusions and comparison with gas emissions.
a and c, The PEP-corrected olivine- and plagioclase-hosted MI record overlapping H2O (0.18 –0.26 wt.%) and SO2 (1059–2053 ppm) contents. b, In contrast, bubble-free olivine-hosted inclusions have lower median CO2 contents (1126 ppm) than the bubble-free plagioclase-hosted inclusions (1649 ppm). d, Volatile elements in melt inclusions and comparison with gas emissions. In b. and d. samples that contain gas bubbles are indicated. Error bars are included on all panels and include external 1σ error. In all panels, are the 1σ error bars smaller than the symbol size. Source data
Extended Data Fig. 8
Extended Data Fig. 8. Cumulative frequency of melt inclusion CO2-H2O saturation pressures.
The CO2-H2O saturation pressures calculated for the olivine and plagioclase hosted MI, with and without PEP corrections. Calculations performed using v1.0.1 of VESIcal at 1200°C, assuming Fe3+/FeT = 0.15 with the MagmaSat model, the Iacono-Marziano model, and the Shishkina model. See Methods for discussion on the model uncertainty. Source data
Extended Data Fig. 9
Extended Data Fig. 9. Characteristics of gas emissions.
a-b: Plot of (a) H2O vs SO2 and (b) CO2 vs. SO2 column amounts for vent gases from fracture one during 25th March and 5th April. The measurements were carried out using an open-path Fourier transform infrared spectrometer (OP-FTS) at approx. 150 m distance. Note that atmospheric corrections have been applied to the H2O and CO2 measurements. c-d: Plot of (c) CO2 vs. SO2 and (d) H2O vs CO2 for vent gases on the 25th March and 5th April. The measurements were carried out using a Multi-GAS device at 50-150 m from the vent source. Error bars are included on all plots and include external 2σ error. Source data
Extended Data Fig. 10
Extended Data Fig. 10. The Fagradalsfjall gas signature in a global context.
Time-averaged volcanic gas CO2/S ratios versus mean whole-rock Sr/Sm and Sr/Nd ratios for a global population of plume-related (MOR and intraplate) and continental rift volcanoes, and for Fagradalsfjall (this study; Supplementary Tables 3 and 12). The gas/trace element composition of the Depleted MORB Mantle (DMM) is from ref. . These correlations are evidence for that closed-system degassing behavior has prevailed until shallow magmatic levels, and that the volcanic gas CO2/S ratio can thus be used to infer the parental melt CO2 concentration. Source data
Extended Data Fig. 11
Extended Data Fig. 11. REE systematics show variability derived from mantle melting.
a, Dy/Yb vs. La/Yb of the Fagradalsfjall whole rocks, compared with historial RP eruptions. b, the same data superimposed onto a mantle melting trajectory, with indicative mixing lines. The calculation assumes a homogenous depleted mantle composition and was performed using alphaMELTS running the pMELTS model. The calculations were for isentropic decompression melting starting at 4 GPa and 1572 °C, with 0.01 GPa pressure steps. Trace element concentrations were calculated using constant partition coefficients from ref. ,, and assuming continuous melting with a residual porosity of 0.2%. The pressures indicated are model dependent. Error bars are included on both panels and include external 2σ error. Source data
Extended Data Fig. 12
Extended Data Fig. 12. Fagradalsfjall K2O/TiO2 variability vs. single-eruptive oceanic basalt units.
Comparison of the Fagradalsfjall K2O/TiO2 variability with petrologically well-characterized single-eruptive oceanic basalt units that have been mapped and sampled for within-flow variations. a, Pu‘u ‘Ō‘ō 1983–2018 and Kilauea 2018 eruption, and individual MOR basaltic eruptions from b, plume-influenced ridges along the Galápagos spreading center, where different units are shown using different symbols. c, units near 17.5°S on the East Pacific Rise (EPR), and d, some newly-formed EPR (2005–2006) eruptions and recent eruptions on the Axial seamount. Except for the Galápagos spreading center, only lavas flows with MgO contents higher than 6.5 wt.% are shown. Error bars are included on all panels and include external 2σ error. Source data
Extended Data Fig. 13
Extended Data Fig. 13. Fagradalsfjall K2O/TiO2 vs. the N1 lava unit at 17.5°S on the East Pacific Rise.
a and b, Comparison of the Fagradalsfjall K2O/TiO2 with the N1 lava unit at 17.5°S on the East Pacific Rise which shows both considerable and systematic mantle-derived heterogeneity. Error bars are included on both panels and include external 2σ error. Source data

References

    1. Wright TJ, et al. Geophysical constraints on the dynamics of spreading centres from rifting episodes on land. Nat. Geosci. 2012;5:242–250. doi: 10.1038/ngeo1428. - DOI
    1. Sigmundsson, F. et al. Segmented lateral dyke growth in a rifting event at Bárðarbunga volcanic system, Iceland. Nature517, 191–195 (2014). - PubMed
    1. Halldórsson SA, et al. Petrology and geochemistry of the 2014–2015 Holuhraun eruption, central Iceland: compositional and mineralogical characteristics, temporal variability and magma storage. Contributions Mineral. Petrol. 2018;173:1–25. doi: 10.1007/s00410-018-1487-9. - DOI - PMC - PubMed
    1. Sigurdsson H, Sparks SRJ. Lateral magma flow within rifted Icelandic crust. Nature. 1978;274:126–130. doi: 10.1038/274126a0. - DOI
    1. Sigmundsson F. New insights into magma plumbing along rift systems from detailed observations of eruptive behavior at Axial volcano. Geophys. Res. Lett. 2016;43:12,423–12,427. doi: 10.1002/2016GL071884. - DOI

Publication types

LinkOut - more resources