. 2022 Oct;610(7930):135-142.
doi: 10.1038/s41586-022-05196-w. Epub 2022 Sep 14.

Distinguishing externally from saccade-induced motion in visual cortex

Affiliations

Distinguishing externally from saccade-induced motion in visual cortex

Satoru K Miura et al. Nature. 2022 Oct.

Erratum in

Abstract

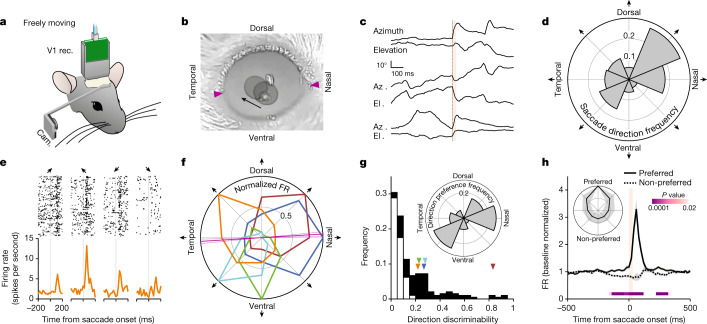
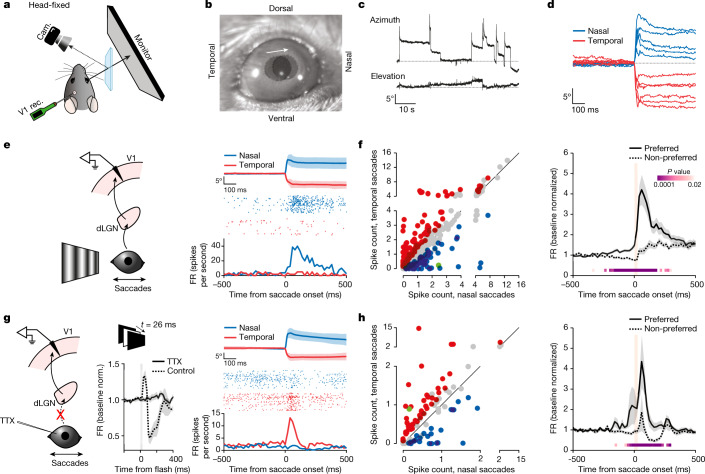
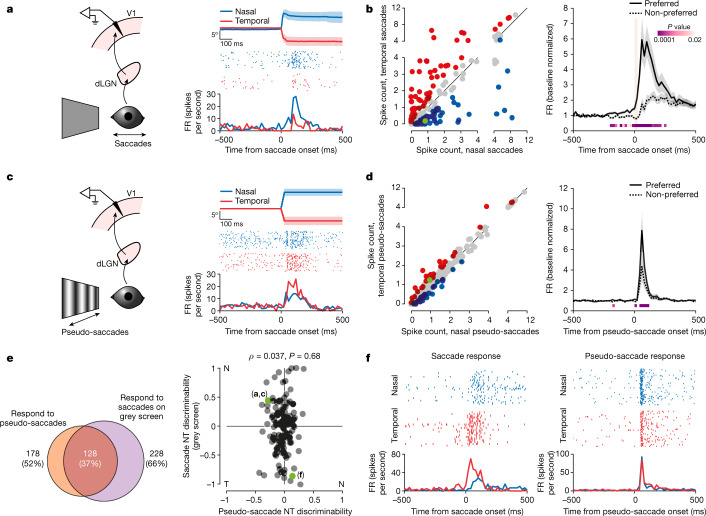
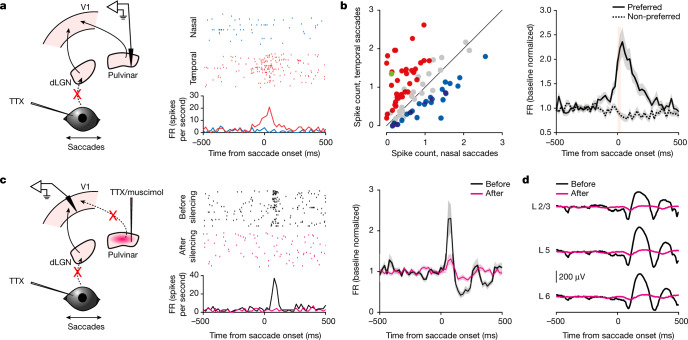
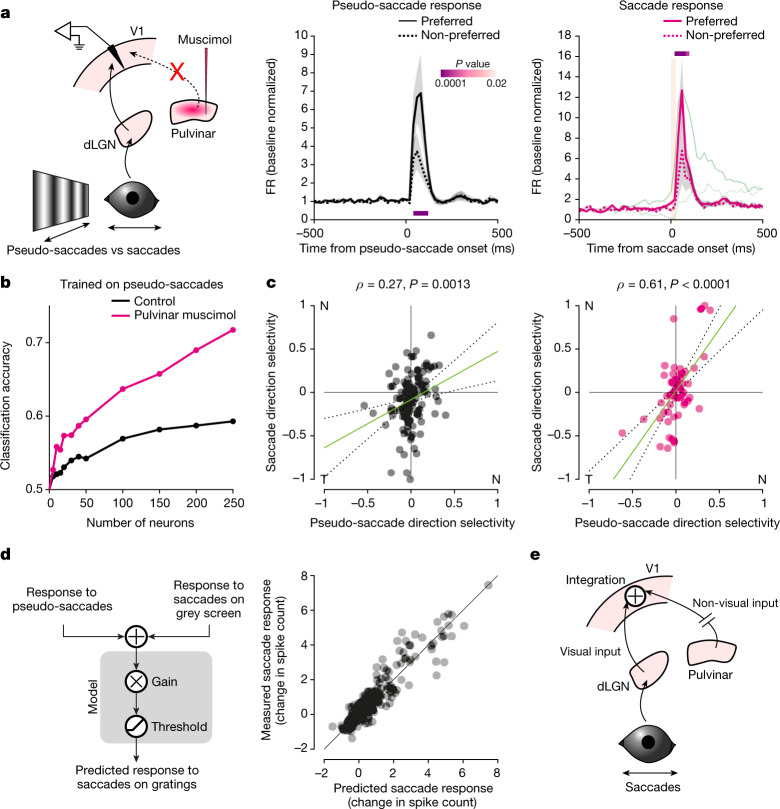
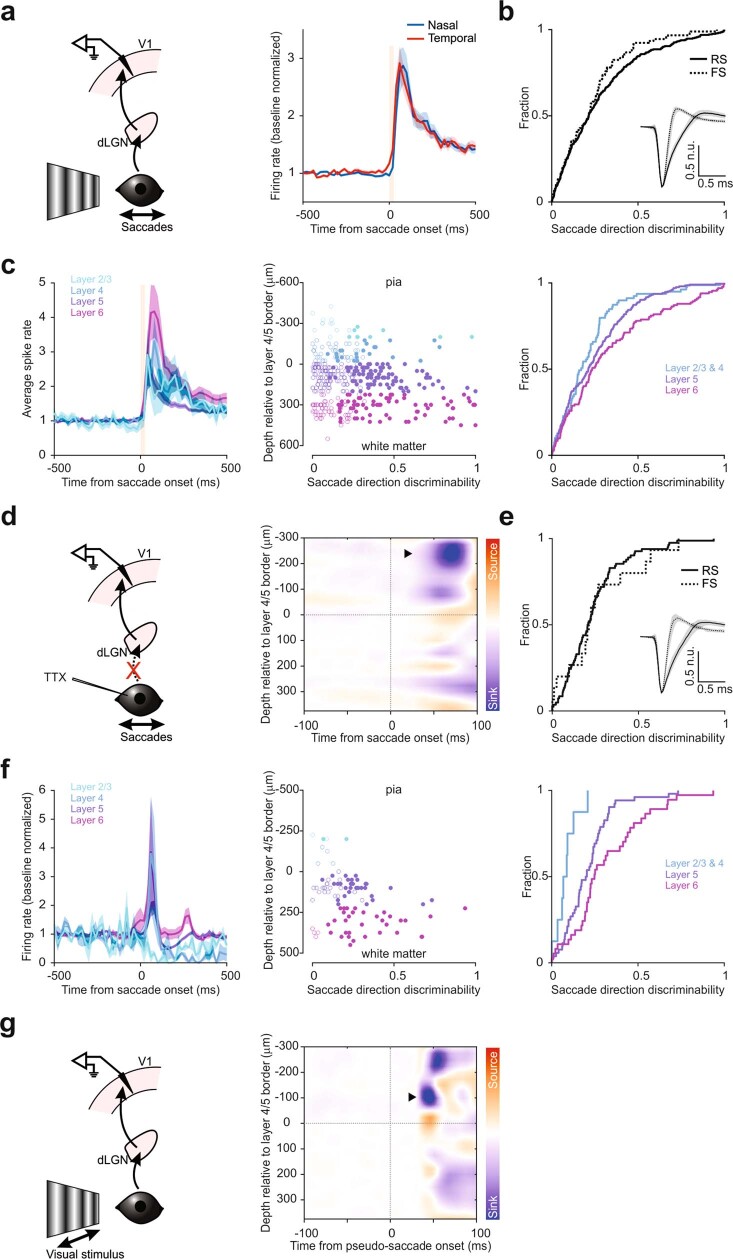
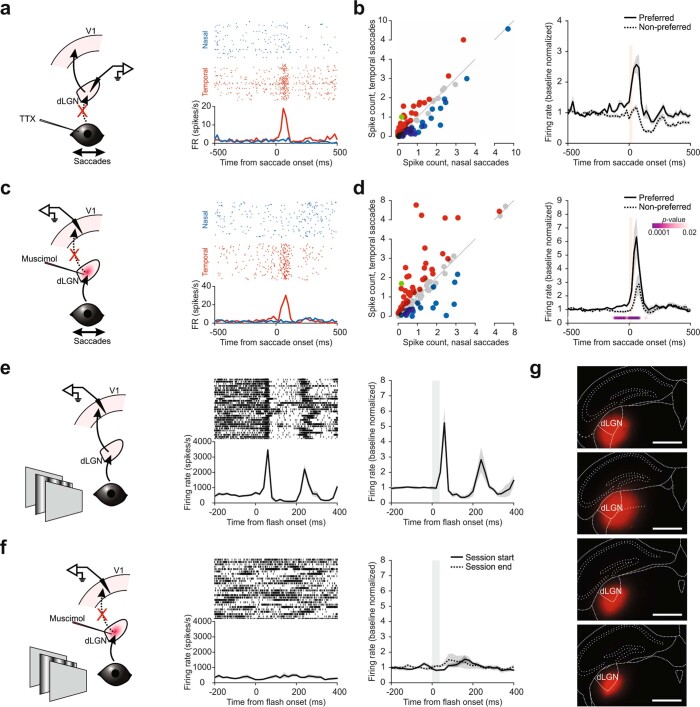
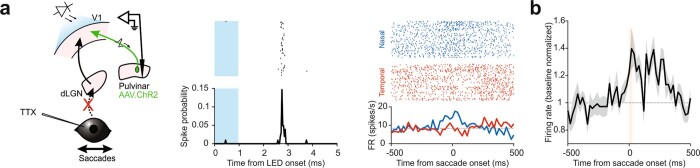
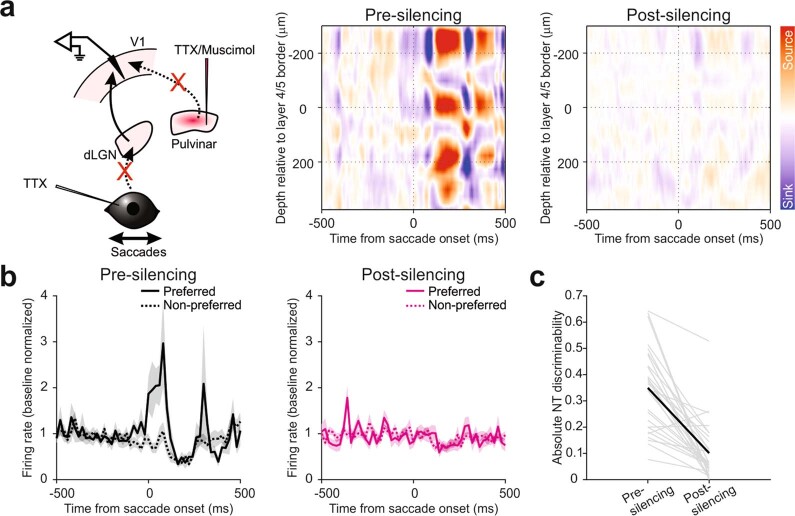
Distinguishing sensory stimuli caused by changes in the environment from those caused by an animal's own actions is a hallmark of sensory processing1. Saccades are rapid eye movements that shift the image on the retina. How visual systems differentiate motion of the image induced by saccades from actual motion in the environment is not fully understood2. Here we discovered that in mouse primary visual cortex (V1) the two types of motion evoke distinct activity patterns. This is because, during saccades, V1 combines the visual input with a strong non-visual input arriving from the thalamic pulvinar nucleus. The non-visual input triggers responses that are specific to the direction of the saccade and the visual input triggers responses that are specific to the direction of the shift of the stimulus on the retina, yet the preferred directions of these two responses are uncorrelated. Thus, the pulvinar input ensures differential V1 responses to external and self-generated motion. Integration of external sensory information with information about body movement may be a general mechanism for sensory cortices to distinguish between self-generated and external stimuli.


Conflict of interest statement

The authors declare no competing interests.

Figures

Fig. 1
Fig. 1. V1 neurons are tuned to saccade direction.
a, Experimental set-up for eye monitoring in freely moving mice. b, Overlay of two snapshots, taken before and after a dorso-temporal saccade (right eye). The arrow indicates the direction of the saccade. The pupils are overlaid with grey circles. Arrowheads indicate temporal and nasal commissures. c, Eye position traces for three example saccades. Orange bar, 0–90% rise time of saccades (31 ms). In each pair, the top trace shows azimuth (up is nasal) and the bottom trace shows elevation (up is dorsal). d, Polar histogram showing saccade direction frequency. Average of five animals, normalized. e, Example V1 neuron showing preference for the dorso-temporal saccade direction. Raster plots (top) and PETHs (bottom) are shown. Arrows indicate the direction of saccades as defined in f. f, Polar plot of five example saccade direction-selective V1 neurons, normalized to their maximum response (average activity in the 100-ms window after saccade onset). Orange, example neuron in e. Magenta line, angle of the axis connecting the temporal and nasal commissures (solid line, average; dotted lines, s.d.). g, Direction discriminability of saccade-responsive neurons (based on the receiver operating characteristic of the spike frequency distribution; 0, no discriminability; 1, perfect discriminability;  Methods). Black, direction-selective neurons (n = 90 neurons); white, non-selective neurons (n = 104 neurons; 10 mice). Arrowheads indicate the discriminability of the example neurons in f. Inset, polar histogram of preferred direction frequency. h, Average PETH of saccade direction-selective neurons (n = 90 neurons, 10 mice) for preferred and non-preferred (that is, opposite) directions. Shaded area, average ± s.e.m. Orange bar, 0–90% rise time of saccades (31 ms). P values are from comparison of activity for preferred and non-preferred directions in 20-ms bins (Wilcoxon signed-rank test, one tailed; Methods). Inset, polar plot of the average response of direction-selective neurons, aligned to the preferred direction. Shaded area, s.d.
Fig. 2
Fig. 2. Direction-selective non-visual V1 response to saccades.
a, Experimental set-up in head-fixed mice. b, Two overlaid snapshots (before and after a nasal saccade). The arrow indicates saccade direction. Circles delineate the pupils. c, Example eye position traces. Top, azimuth (up is nasal); bottom, elevation (up is dorsal). d, Example azimuthal eye position for nasal and temporal saccades. e, Left, schematic of V1 recording during saccades on a vertical grating. Right, example neuron. Average eye position for nasal and temporal saccades (top; shaded area, average ± s.d.), raster plots (centre) and the PETH (bottom) are shown. f, Left, scatterplot of the response to nasal and temporal saccades (average spike count in a 100-ms window from saccade onset), for all responsive neurons (n = 415 neurons, 13 mice). Blue, nasal preference; red, temporal preference; grey, no statistical difference; green, example in e. Right, average PETH of discriminating neurons (n = 192 neurons, 13 mice), for preferred and non-preferred directions. Shaded area, average ± s.e.m. Orange bar, 0–90% rise time of saccades (26 ms). P values are from the comparison of activity for preferred and non-preferred saccade directions in 20-ms bins (Wilcoxon signed-rank test, one tailed). g, Left, schematic of V1 recording during saccades in TTX-blinded animals. Centre, average multi-unit responses to a brief full-field flash. Grey bar, flash duration (26 ms). Note the lack of response with TTX. Control, 137.9 ± 31.2 Hz (FR ± s.e.m. averaged over a 60-ms window 10 ms after response onset; n = 4 mice; 22.1% ± 4.3% increase over baseline); TTX, −8.0 ± 15.4 Hz (0.12% ± 3.0% increase over baseline; n = 8 mice). Wilcoxon rank-sum test, one tailed: P = 0.0020. Right, example neuron in a TTX-blinded animal. Average eye position (top; shaded area, average ± s.d.), raster plots (centre) and the PETH (bottom) are shown. h, Same as in f, but for TTX-blinded animals. Left, n = 97; right, n = 67 (8 mice). Green, example neuron in g. 0–90% rise time of saccades, 27 ms.
Fig. 3
Fig. 3. Direction preferences for saccades and visual motion are not correlated.
a, Left, schematic of V1 recording during saccades on a grey screen. Right, example neuron preferring nasal saccades. Average eye position (top; shaded area, average ± s.d.), raster plots (centre) and the PETH (bottom) are shown. b, Left, scatterplot of the response to nasal and temporal saccades for all responsive neurons (n = 171, 4 mice). Blue, nasal preference; red, temporal preference; grey, no statistical difference; green, example in a. Right, average PETH of discriminating neurons for preferred and non-preferred saccade directions (n = 107 neurons, 4 mice). Shaded area, average ± s.e.m. Orange bar, 0–90% rise time of saccades (25 ms). P values are from the comparison of activity for preferred and non-preferred saccade directions (Wilcoxon signed-rank test, one tailed). c, Left, schematic of V1 recording during pseudo-saccades. Right, same example neuron as in a. This neuron prefers the temporal direction for pseudo-saccades (otherwise as in a). d, Left, scatterplot of the response to nasal and temporal pseudo-saccades (n = 582 neurons, 13 mice, including the 4 mice in b). Blue, nasal preference; red, temporal preference; grey, no statistical difference; green, example in c. Right, average PETH of discriminating neurons (n = 65 neurons; otherwise as in b). e, Left, Venn diagram of the number of neurons that respond to pseudo-saccades, saccades on a grey screen and both. Percentages are out of the entire population; based on four mice from b and d in which the responses to both saccades on a grey screen and pseudo-saccades were tested. Right, scatterplot of NT discriminability for pseudo-saccades (x axis) against saccades on a grey screen (y axis), for neurons that respond to both (128 neurons in e). n = 128 neurons, 4 mice. NT discriminability reports how well an ideal observer distinguishes between nasal and temporal saccades on the basis of spike counts (negative, temporal preference; positive, nasal preference; 0, no preference;  Methods). For this analysis, amplitudes and directions for pseudo-saccades were matched to those of real saccades on the grey screen. Green, example neurons in a, c and f. f, Example neuron showing altered direction preference for real saccades (left) and pseudo-saccades (right). Top, raster plots; bottom, PETHs.
Fig. 4
Fig. 4. The pulvinar provides non-visual direction-selective saccade input to V1.
a, Left, schematic of pulvinar recording during saccades in TTX-blinded animals. Right, example neuron preferring temporal saccades. Raster plots (top) and the PETH (bottom) are shown. b, Left, scatterplot of the response to nasal and temporal saccades for all responsive neurons (n = 84, 12 mice). Blue, nasal preference; red, temporal preference; grey, no statistical difference; green, example neuron in a. Right, average PETH of discriminating neurons (coloured data points on left scatterplot) for preferred and non-preferred directions (n = 61 neurons). Shaded area, average ± s.e.m. Orange bar, 0–90% rise time of saccades (26 ms). c, Left, schematic of V1 recording during saccades in TTX-blinded mice before and after pulvinar silencing. Centre, raster plot (top) and PETH (bottom) of an example neuron in response to nasal saccades before and after pulvinar silencing. Right, average PETH of saccade-responsive neurons before and after pulvinar silencing (n = 56 neurons, 5 mice). All nasal and temporal saccades are included. Shaded area, average ± s.e.m. d, LFPs from an example animal aligned to the time of saccades for layer 2/3 (L2/3), layer 5 (L5) and layer 6 (L6) before and after pulvinar silencing.
Fig. 5
Fig. 5. Non-visual and visual inputs are combined in V1 during saccades.
a, Left, schematic of V1 recording during saccades on a grating while silencing the pulvinar. Centre, average PETH for pseudo-saccades recorded before pulvinar silencing (n = 34 neurons that discriminate pseudo-saccade direction out of 328 neurons, 9 mice). Right, average PETH for real saccades following pulvinar silencing (n = 34 neurons that discriminate saccade direction). Orange bar, 0–90% rise time of saccades (25 ms). Shaded area, average ± s.e.m. P values are from comparison of activity for preferred and non-preferred saccade directions in 20-ms bins (Wilcoxon signed-rank test, one tailed). Green trace, average PETH for saccades in control conditions for comparison of the time course (from Fig. 2f; scaled to the peak of response to the preferred direction). Following pulvinar silencing, the time course of the response to saccades resembles that of the response to pseudo-saccades, including a lack of separation before saccade onset. b, Classification accuracy for direction of motion (nasal or temporal) for a classifier trained on pseudo-saccades under the control condition and tested on real saccades under the control condition (black) or under pulvinar silencing (magenta), as a function of the number of neurons included in the analysis. c, Left, scatterplot of NT discriminability for real and pseudo-saccades for neurons that contribute to the classifier’s ability to discriminate (top 20% of neurons). Green line, linear regression (coefficient, 0.61; P = 0.0003); dotted lines, 95% confidence interval. n = 135 neurons, 13 mice. Right, same as to left, but real saccade responses were acquired after pulvinar silencing. Green line, linear regression (coefficient, 1.52; P < 0.0001). n = 61 neurons, 9 mice. Note the improved correlation. d, Left, schematic of the linear model used to predict the number of spikes evoked by saccades on a vertical grating on the basis of the response of neurons to pseudo-saccades and to saccades on a grey screen (Methods). Right, predicted number of spikes (x axis) plotted against the observed values (y axis). e, Integration of saccade direction-selective non-visual input from the pulvinar with saccade-induced visual motion alters the stimulus direction preference of V1 neurons during saccades.
Extended Data Fig. 1
Extended Data Fig. 1. Response of V1 neurons to saccades in freely moving mice.
a, Average PETH of saccade responsive neurons (n = 194 neurons, 10 mice). For each neuron, the saccade direction with maximum response was taken. Baseline normalized. Shaded area, average ± s.e.m. Vertical orange bar, 0 – 90% rise time of saccades (31 ms). b, Histogram of classical direction selectivity index (see Methods). White, non-direction selective (n = 104 neurons); black, saccade direction selective (n = 90 neurons). c. Scatter plot of saccade responsive neurons, showing the gradient of response profiles. X-axis, saccade direction discriminability; y-axis, ratio of the FR between the direction orthogonal to the preferred and the preferred. Gray, non-direction selective; black, direction selective. Data points in colored circles correspond to example units shown in (d) and (e). d, Polar plots of example saccade direction selective neurons. Dotted gray circle, baseline FR averaged for all directions. FR for the preferred direction is shown at the top of the polar plots. e, Same as (d), but for non-direction selective neurons.
Extended Data Fig. 2
Extended Data Fig. 2. Distribution of real and pseudo-saccade amplitudes.
a, Histogram of saccade amplitudes in control head-fixed mice. Blue, nasal saccades; red, temporal saccades. Bars indicate interquartile range, dot denotes median. Nasal saccades: median, 13.2; Q1, 9.9; Q3, 16.2; n = 296. Temporal saccades: median 7.9; Q1, 6.2; Q3, 10.26; temporal, n = 189. 4 mice. b, Histogram of pseudo-saccade amplitudes presented to the mice. For each mouse, we only analyzed the response to those pseudo-saccades whose amplitudes matched the amplitudes of the real saccades performed by the animal during the experiment. Nasal pseudo-saccades: median, 12.5; Q1, 9.6; Q3, 15.8; n = 193. Temporal pseudo-saccades: median 9.4; Q1, 6.7; Q3, 11.6; n = 207. c, Same as in (a) but for TTX-blinded animals. Nasal saccades: median, 13.9; Q1, 11.2; Q3, 17.5; n = 887. Temporal saccades: median 8.8; Q1, 6.5; Q3, 11.5; temporal, n = 561. 8 mice. d, Same as in (a) but for animals with the pulvinar silenced. Nasal saccades: median, 13.3; Q1, 10.4; Q3, 16.3; n = 579. Temporal saccades: median 9.0; Q1, 6.9; Q3, 11.4; temporal, n = 329. 9 mice.
Extended Data Fig. 3
Extended Data Fig. 3. V1 neurons keep the same naso-temporal direction preference across freely-moving and head-fixed conditions.
a, Comparisons of responses to nasal and temporal saccades under freely-moving condition and head-fixation for three example direction selective neurons. Left, polar plots showing saccade direction preferences under freely-moving conditions. The blue and red dots show the firing rate in response to nasal and temporal saccades, for the same neurons, under head-fixed conditions. Center, raster plots and PETH for nasal and temporal saccades under freely-moving conditions. Right, raster plots and PETH for nasal and temporal saccades under head-fixation. Note similar direction preference and response dynamics. The number of nasal and temporal saccades shown in the raster plots under head-free condition is matched to the number of nasal and temporal saccades in the head-fixed condition. The PETH under head-free condition is calculated from all nasal and temporal saccades recorded in this condition. b, Scatter plot of naso-temporal (NT) discriminability for saccades under freely-moving and head-fixed conditions, for all saccade responsive neurons under head-fixation. NT discriminability is a measure of how well an ideal observer can distinguish between the nasal and the temporal direction of saccades based on spike counts (negative and positive values indicate temporal and nasal preference, respectively; 0, no preference; see Methods). Black data points represent neurons that discriminate naso-temporal direction under head-fixed conditions. Pearson ρ = 0.76, p < 0.0001, n = 120 neurons, 5 mice. c, Histogram of correlation coefficients between PETHs of freely-moving and head-fixed conditions (−500 ms to +500 ms around saccade onset, FR calculated in 20-ms bins), for neurons that discriminate naso-temporal direction under head-fixed conditions. Coefficients were calculated for the preferred direction as determined under head-fixed conditions. d, Scatter plot of the response to preferred direction of saccades in freely-moving and head-fixed conditions (average firing rate in the first 100 ms window after saccade onset), calculated for neurons that discriminate naso-temporal direction under head-fixed conditions. Preferred direction as determined under head-fixed conditions.
Extended Data Fig. 4
Extended Data Fig. 4. Saccade response across cortical depth and neuron class in control and TTX-blinded mice.
a, Left, schematic of V1 recording during saccades on a vertical grating. Right, average PETH of saccade responsive neurons to nasal and temporal saccades. Baseline normalized. Shaded area, average ± s.e.m. Vertical orange bar, 0–90% rise time of saccades for reference (26 ms). Note the similarity of the population averaged response to nasal and temporal saccades. b, Cumulative frequency distribution (CFD) of direction discriminability (see Methods), plotted for saccade responsive regular-spiking (RS) and fast-spiking (FS) neurons. Overall, 53% (324 out of 607) and 82% (91 out of 111) of RS and FS neurons, respectively, responded to saccades. Anderson-Darling test, p = 0.29, n = 607 for RS, 111 for FS, 13 mice. Inset, median spike shape normalized to the trough. Shaded area, interquartile range. c, Left, average PETH of saccade responsive V1 neurons, sorted by cortical depth. All nasal and temporal saccades are included. Layer 2/3, 21 responsive neurons out of 54; layer 4, 58 out of 121; layer 5, 204 out of 334; layer 6, 132 out of 209. Baseline normalized. Shaded area, average ± s.e.m. Vertical orange bar, 0–90% rise time of saccades for reference (26 ms). Center, scatter plot of direction discriminability (x-axis) of all units as a function of cortical depth (y-axis). Open circles, statistically non-significant; filled, significant (see Methods). Color code as in left. Right, CFD of discriminability by cortical depth. Layers 2/3 and 4 were grouped together. 3-sample Anderson-Darling test, p < 0.0001. d, Left, schematic of V1 recording during saccades in TTX-blinded animals. Right, heat map of the current source density (CSD) analysis from an example animal. Note major sink in the supragranular layers (arrowhead). Data from 89 nasal and 82 temporal saccades. e, Cumulative frequency distribution (CFD) of saccade direction discriminability, plotted for saccade responsive RS and FS neurons in TTX-blinded animals. Overall, 42% (82 out of 194) and 48% (15 out of 31) of RS and FS neurons, respectively, responded to saccades. Anderson-Darling test, p = 0.313, n = 194 for RS, 31 for FS. Inset, median spike shape normalized to the trough. Shaded area, interquartile range. f, Left, average PETH of saccade responsive V1 neurons in TTX-blinded animals, sorted by cortical depth. All nasal and temporal saccades are included. Layer 2/3, 4 responsive neurons out of 13; layer 4, 4 out of 28; layer 5, 52 out of 119; layer 6, 37 out of 65. Shaded area, average ± s.e.m. Center, scatter plot of direction discriminability of all neurons (x-axis) as a function of cortical depth (y-axis). Open circles, statistically non-significant; filled, significant (see Methods). Color code as in left. Right, CFD of discriminability by cortical depth. Layers 2/3 and 4 were grouped together. 3-sample Anderson-Darling test, p = 0.0005. g, Same as in (d), but for visual stimuli in a control animal. The visual stimuli used here were pseudo-saccades, i.e., quick shifts of the grating that mimic visual scene changes induced by real saccades (see Main and Methods). Note early sink in layer 4 (arrowhead). Color scale same as in (d).
Extended Data Fig. 5
Extended Data Fig. 5. The dLGN is not the source of non-visual saccade input to V1.
a, Left, schematic of dLGN recording during saccades in TTX-blinded animals. Right, example neuron preferring temporal saccades. Raster plots (top) and PETH (bottom). b, Left, scatter plot of the response to nasal and temporal saccades (average spike count in a 100 ms window from saccade onset) for all responsive dLGN neurons (n = 108, 4 mice). Blue, prefer nasal saccades; red, prefer temporal saccades; gray, no statistical difference; green, example neuron in (a). Right, average PETH for preferred and non-preferred saccade directions (n = 77 neurons, 4 mice). Baseline normalized. Shaded area, average ± s.e.m. Vertical orange bar, 0–90% rise time of saccades (26 ms). c, Left, schematic of V1 recording during saccades under dLGN silencing. Right, example neuron preferring temporal saccades. Raster plots (top) and PETH (bottom). d, Left, scatter plot of the response to nasal and temporal saccades (average spike count in a 100 ms window from saccade onset) for all responsive V1 neurons (n = 125, 4 mice). Blue, prefer nasal saccades; red, prefer temporal saccades; gray, no statistical difference; green, example neuron in (c). Right, average PETH for preferred and non-preferred saccade directions (n = 64 neurons, 4 mice). Shaded area, average ± s.e.m. Vertical orange bar, 0–90% rise time of saccades (26 ms). P-values, comparison of activity for preferred and non-preferred saccade directions in 20-ms bins (see Methods). Note the persistence of directionally selective saccade responses in V1 despite dLGN silencing. e, Left, schematic of V1 recording during a brief (32 ms) presentation of a full-field grating (see Methods). Center, multi-unit response from an example recording. Raster plot (top) and PETH (bottom). Right, average PETH of 3 mice. Baseline normalized. Shaded area, average ± s.e.m. 173.5 ± 29% average increase in evoked FR ± s.e.m. f, Left and center, same as in (a), but for mice injected with muscimol-BODIPY in the dLGN. Right, average PETH of 4 mice. Recording started after muscimol injection. Response was measured both at the start of the recording session and at the end. Note the lack of visual response in both cases. Baseline normalized. Shaded area, average ± s.e.m. Average increase in evoked FR ± s.e.m. was −16.7 ± 7.5% (start) and 14.1 ± 8.8% (end). g, Section images of the four mice injected with muscimol-BODIPY in the dLGN in (b). Red, BODIPY. Scale bar, 1 mm.
Extended Data Fig. 6
Extended Data Fig. 6. Pulvinar neurons that respond to saccades can project to V1.
a, Left, Schematic of pulvinar recordings during saccades in TTX-blinded animal and optogenetic antidromic activation of pulvinar projections to V1. Center, example of antidromically activated neuron. Raster plot (top) and spike probability (bottom; 0.05 ms bin). Blue shaded area indicates time of the 1-ms LED illumination. Right, response of neuron shown in center panel to saccades. This neuron prefers nasal saccades. Raster plot (top) and PETH (bottom). Dotted line in PETH, baseline firing rate. b, Average PETH of saccade-responsive pulvinar neurons that were antidromically activated by illumination of V1 (n = 13 neurons, 3 mice). Shaded area, average ± s.e.m. Vertical orange bar, 0–90% rise time of saccades (26 ms).
Extended Data Fig. 7
Extended Data Fig. 7. Silencing the pulvinar eliminates saccade response in V1 of TTX-blinded mice.
a, Left, schematic of V1 recording during saccades in TTX-blinded animals before and after pulvinar silencing. Center, heat map of the current source density (CSD) analysis of an example animal, prior to pulvinar silencing. All nasal and temporal saccades are included. Note the strong sink in the superficial layers. Right, CSD heat map of the same animal, but after the pulvinar silencing. Color scale: same as in the center panel. Note the attenuated sink. b, Left, average PETH of discriminating neurons for preferred and non-preferred directions, prior to pulvinar silencing. Right, average PETH of the same neurons, but after pulvinar silencing. n = 29, 5 mice. Shaded area, average ± s.e.m. c, Discriminability of the 29 neurons in (b), pre and post silencing of the pulvinar. Gray, individual animals; black, average.
Extended Data Fig. 8
Extended Data Fig. 8. Identification of V1 neurons that contribute to the performance of the classifier of pseudo-saccade direction.
a, Classification accuracy of pseudo-saccades (cross-validated 10-fold) plotted against the ratio of top contributing neurons from control animals (n = 13 mice) whose pseudo-saccade responses were shuffled in the training dataset. The neurons were first ranked by their contribution to the accuracy of the classifier in decoding pseudo-saccade direction, determined from permutation feature importance (see Methods). b, The discriminability of pseudo-saccade direction (x-axis) plotted against each neuron’s contribution to the accuracy of the classifier (y-axis, feature importance). Darker shade, top 10% of the contributing neurons. c-d, Same as in (a-b), but for animals in which the pulvinar was later silenced (n = 9 mice). Note that the responses to pseudo-saccades used here were collected prior to the silencing.
Extended Data Fig. 9
Extended Data Fig. 9. The visual and the non-visual components of the V1 response to saccades each capture only part of the V1 response to saccades on a grating.
a, Schematic of the linear regression-based model used to predict the number of spikes evoked by saccades on a vertical grating. The model is based on the response of neurons to pseudo-saccades (visual component) and to saccades on a gray screen (non-visual component). Results from the sum of the two inputs are shown in Fig. 5g in which the model explains 86% of the observed variance. b, Model prediction results for all neurons that respond to pseudo-saccades and saccades on a gray monitor. Left, predicted number of spikes from the response to pseudo-saccades alone (x-axis) plotted against the observed values (y-axis). This model explains only 40% of the observed variance (gain 0.97, p < 0.0001). Right, predicted number of spikes from the response to saccades on a gray screen alone (x-axis) plotted against the observed values (y-axis). This model explains only 69% of the observed variance (gain 0.89, p < 0.0001). c, Model prediction results for layer 2/3 and 4 neurons that respond to pseudo-saccades and saccades on a gray monitor. Left, predicted number of spikes from the summed response to pseudo-saccades and saccades on a gray monitor (x-axis) plotted against the observed values (y-axis). This model explains 80% of the observed variance (gain 0.49, p < 0.0001). Center, predicted number of spikes from the response to pseudo-saccades alone (x-axis) plotted against the observed values (y-axis). This model explains 80% of the observed variance (gain 0.62, p < 0.0001). Right, predicted number of spikes from the response to saccades on a gray screen alone (x-axis) plotted against the observed values (y-axis). This model explains only 49% of the observed variance (gain 1.49, p < 0.0001). Note the lack of difference in prediction accuracy between the summation model (left) and the visual response model (center). The response to saccades on a grating in layer 2/3 is mainly shaped by the visual inputs. d, Same as in (c), but for layer 5 neurons. Left, gain 0.63, p < 0.0001. Center, gain 1.22, p < 0.0001. Right, gain 0.85, p < 0.0001. Note the increase in prediction accuracy in the summation model (left) compared to the other models. The response to saccades on a grating in layer 5 is shaped by the combination of visual and non-visual inputs. e, Same as in (c), but for layer 6 neurons. Left, gain 0.66, p < 0.0001. Center, gain 1.17, p < 0.0001. Right, gain 0.88, p < 0.0001. Again, note the increase in prediction accuracy in the summation model (left) compared to the other models.
Extended Data Fig. 10
Extended Data Fig. 10. Integration of visual and non-visual inputs during saccades alters direction preference in V1.
a, Illustration showing responses to a nasal pseudo-saccade (leftward in the schematic) in a population of 12 example V1 neurons, each tuned to a different direction of motion of a pseudo-saccade (gray circles, preferred direction indicated by arrows). A nasal pseudo-saccade activates, to various extents, six neurons whose preferred direction is close to the direction of motion of the pseudo-saccade. The other six neurons would have been activated by a temporal pseudo-saccade. A structure downstream of V1 responsible for determining the stimulus direction will count the V1 neurons “voting” for either nasal or temporal direction in order to establish the direction of the pseudo-saccade: Since more neurons voted nasal, this was most likely the direction of the pseudo-saccade. b, Illustration showing responses to a real nasal saccade on a gray screen (i.e. a situation in which V1 experiences only the non-visual input originating in the pulvinar), in the same 12 V1 neurons as in (a). The tuning preference of V1 neurons to the direction of the visual input are not matched with their tuning preference to the direction of the non-visual input. Thus, a nasal saccade on a gray screen activates a subset of V1 neurons that has no apparent relationship with the subset of neurons activated by the nasal pseudo-saccade in (a). c, Illustration showing responses to a real nasal saccade on a grating (i.e., a situation in which V1 experiences both the visual and the non-visual inputs), in the same 12 V1 neurons as in (a). In this situation, V1 experiences a combination (i.e., a summation, see Fig. 5d) of the visual and non-visual inputs. The pattern of activity of the population of V1 neurons in response to a real nasal saccade on a grating vastly differs from the pattern of activity generated by a nasal pseudo-saccade (a), thus “scrambling” the response. The downstream structure now counts both temporal and nasal votes and cannot accurately attribute a visual stimulus direction. Calculation of a confidence level for the direction (i.e. a metric that quantifies the similarity of a given V1 activity pattern to the prototypical V1 response patterns to pseudo-saccades in nasal or temporal direction) may prevent the decoder from reporting motion during saccades.

References

    1. Crapse TB, Sommer MA. Corollary discharge across the animal kingdom. Nat. Rev. Neurosci. 2008;9:587–600. - PMC - PubMed
    1. Castet, E. Perception of intra-saccadic motion. in Dynamics of Visual Motion Processing: Neuronal, Behavioral, and Computational Approaches (eds Ilg, U. J. & Masson, G. S.) 213–238 (Springer US, 2010).
    1. Land MF. The evolution of gaze shifting eye movements. Curr. Top. Behav. Neurosci. 2019;41:3–11. - PubMed
    1. Land M. Eye movements in man and other animals. Vision Res. 2019;162:1–7. - PubMed
    1. Michaiel AM, Abe ET, Niell CM. Dynamics of gaze control during prey capture in freely moving mice. eLife. 2020;9:e57458. - PMC - PubMed

Publication types