. 2022 Sep;609(7929):975-985.
doi: 10.1038/s41586-022-05194-y. Epub 2022 Sep 14.

Control of cell state transitions

Affiliations

Control of cell state transitions

Oleksii S Rukhlenko et al. Nature. 2022 Sep.

Abstract

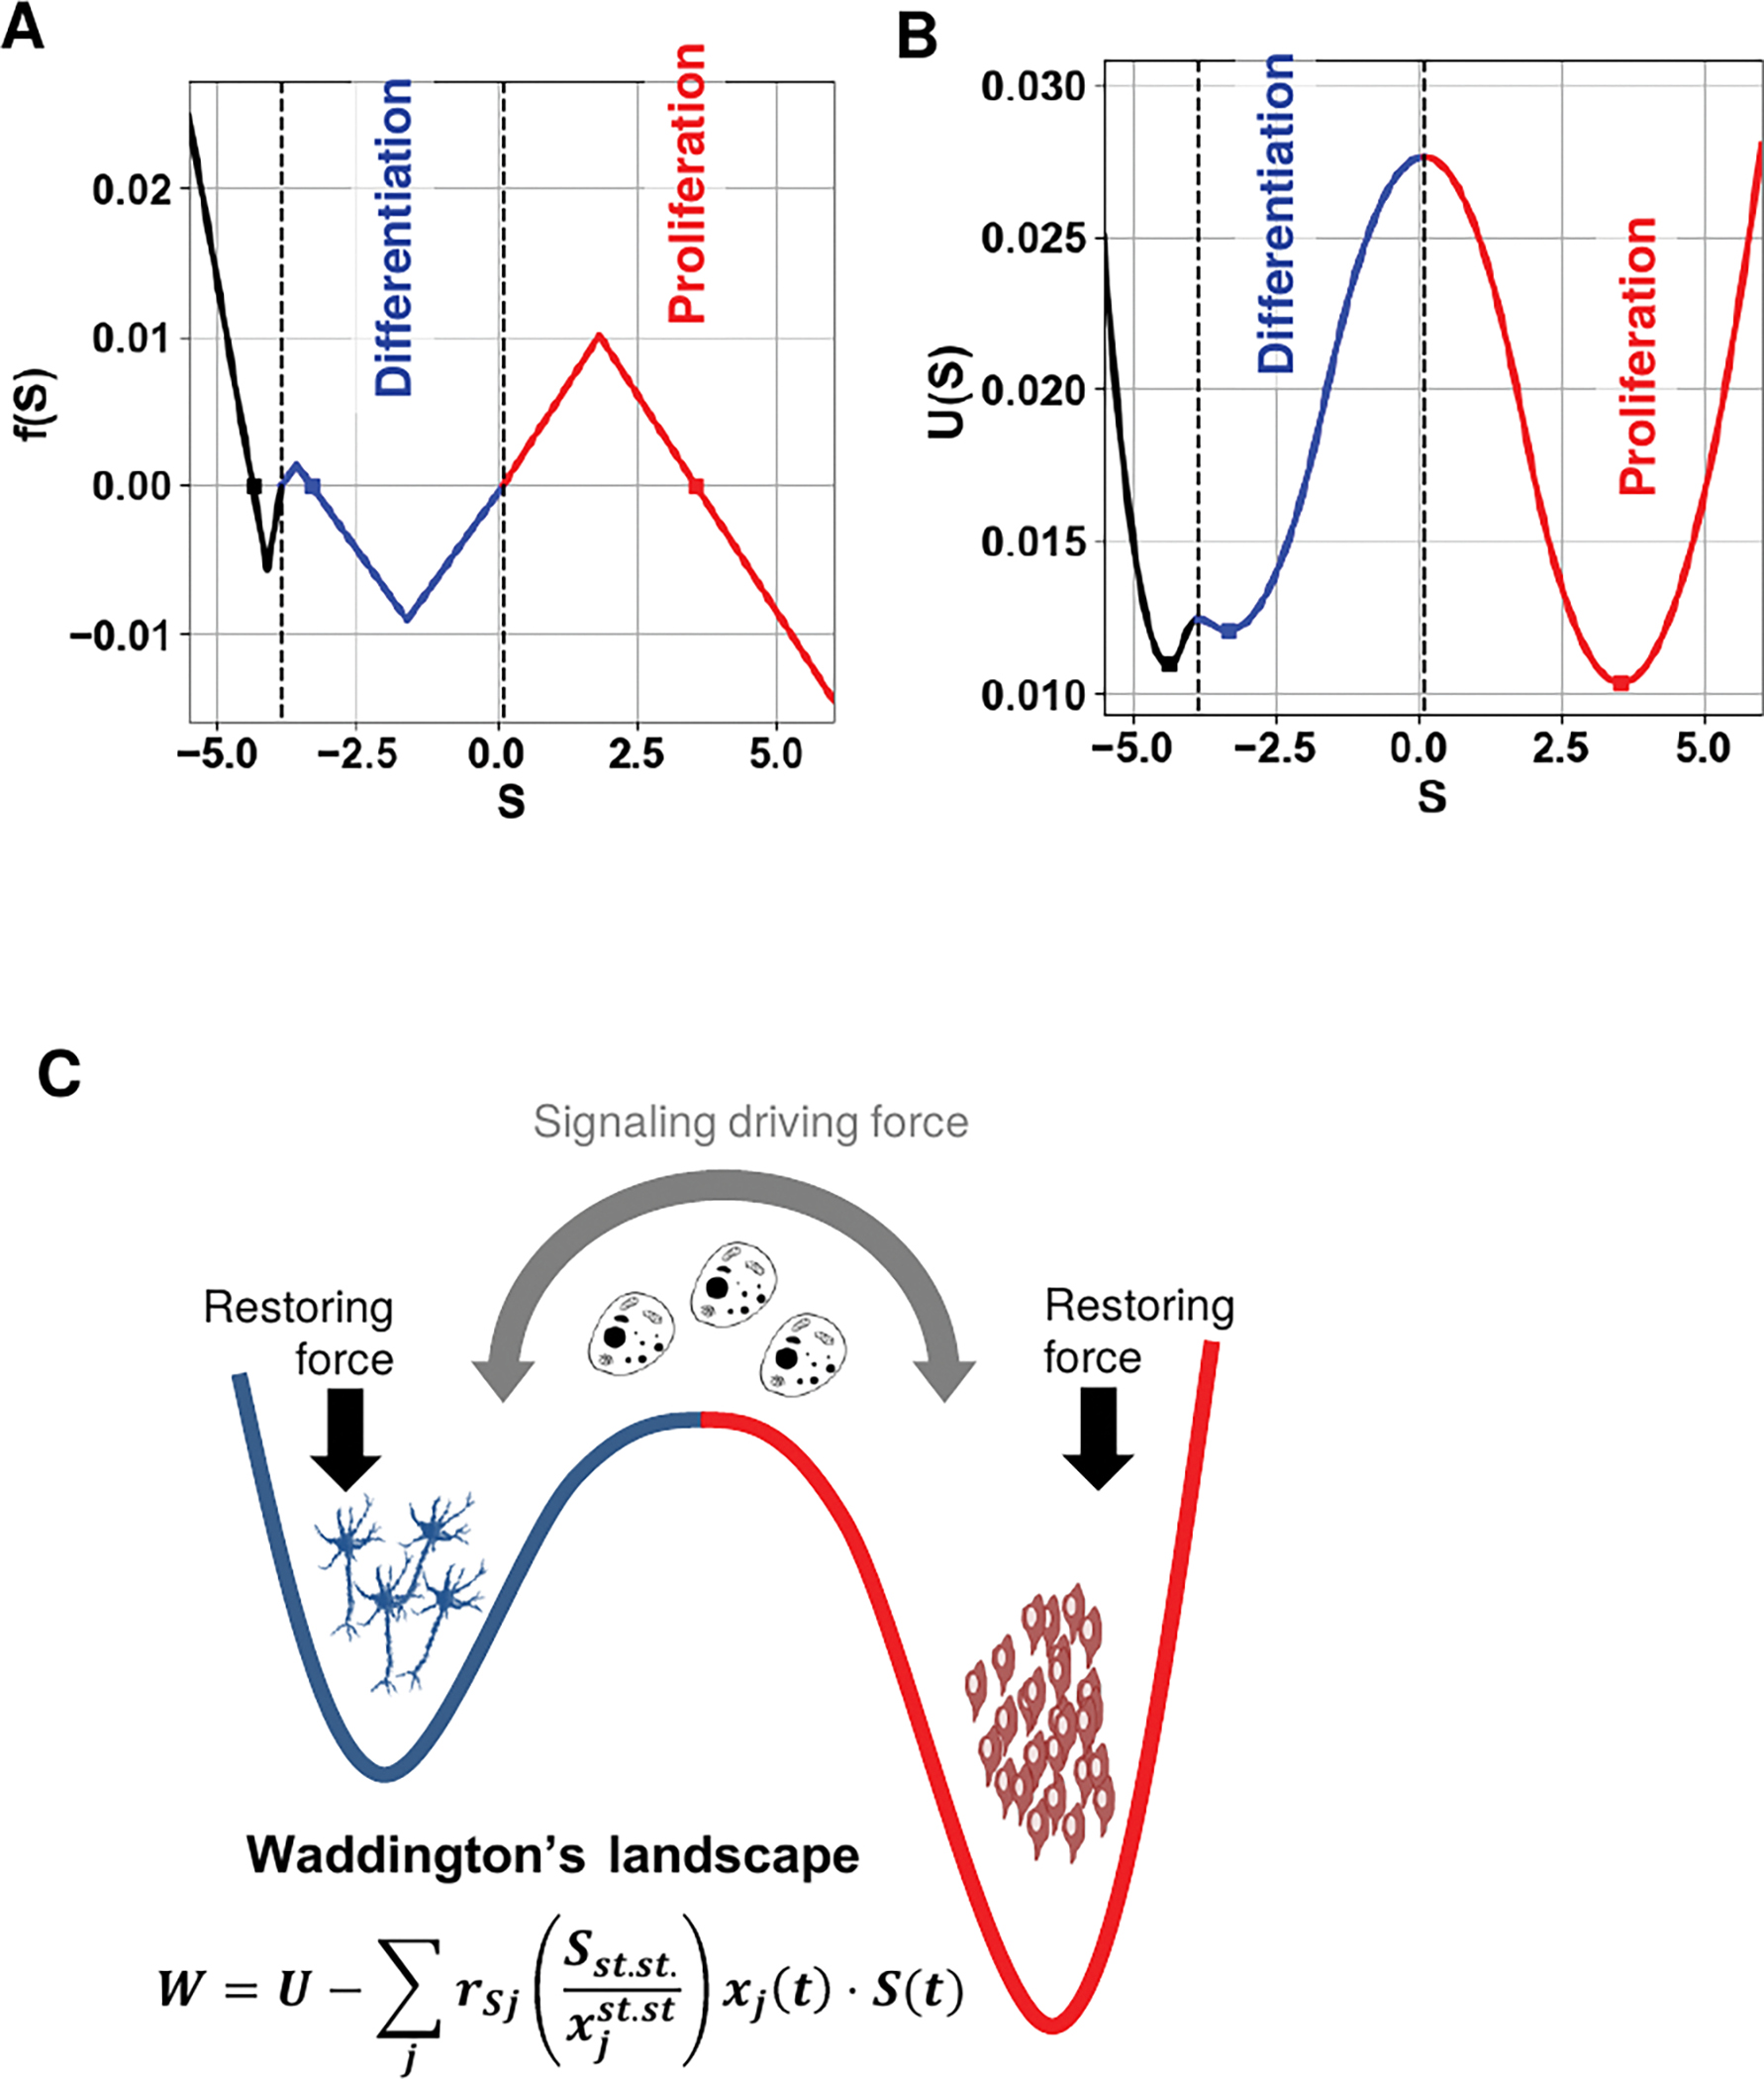
Understanding cell state transitions and purposefully controlling them is a longstanding challenge in biology. Here we present cell state transition assessment and regulation (cSTAR), an approach for mapping cell states, modelling transitions between them and predicting targeted interventions to convert cell fate decisions. cSTAR uses omics data as input, classifies cell states, and develops a workflow that transforms the input data into mechanistic models that identify a core signalling network, which controls cell fate transitions by influencing whole-cell networks. By integrating signalling and phenotypic data, cSTAR models how cells manoeuvre in Waddington's landscape1 and make decisions about which cell fate to adopt. Notably, cSTAR devises interventions to control the movement of cells in Waddington's landscape. Testing cSTAR in a cellular model of differentiation and proliferation shows a high correlation between quantitative predictions and experimental data. Applying cSTAR to different types of perturbation and omics datasets, including single-cell data, demonstrates its flexibility and scalability and provides new biological insights. The ability of cSTAR to identify targeted perturbations that interconvert cell fates will enable designer approaches for manipulating cellular development pathways and mechanistically underpinned therapeutic interventions.


Conflict of interest statement

Competing interests. Patent application (No. UK2107576.7) related to this work was filed (O.S.R., V.Z., W.K. and B.N.K.). All other authors declare no competing interests.

Figures

Extended Data Figure 1.
Extended Data Figure 1.. Proliferation responses of SH-SY5Y-TrkA and SH-SY5Y-TrkB cells to NGF, BDNF, and kinase inhibitors.
Proliferation of NGF-stimulated TrkA cells and BDNF-stimulated TrkB cells treated with different inhibitors was measured using the (A) ATP luminescence and (B) MTS assays following 72 hours after treatment. Concentrations of inhibitors: TRKi (SP600125) – 5 μM, AKTi (AKT inhibitor IV) – 1 μM, JNKi (JNK-IN-8) – 1 μM, S6Ki (LY2584702) – 1 μM, MEKi (Trametinib) – 0.5 μM, RSKi (BI-D1870) – 1 μM. Data are presented as mean values +/− SEM for n=3 biologically independent experiments.
Extended Data Figure 2.
Extended Data Figure 2.. RPPA phospho-proteomics data.
Heatmap of RPPA data obtained at 10 and 45 minutes stimulation of TrkA and TrkB cells with 100 ng/ml NGF and BDNF (the time and replicate numbers are indicated at the bottom, the proteins on the side). The data were clustered using Ward hierarchical clustering.
Extended Data Figure 3.
Extended Data Figure 3.. PCA compression of RPPA data and selection of core network components.
(A) PCA compressed RPPA data for TrkA and TrkB cells are plotted in the space of the first two principal components that are normalized by the data variance captured by these components. Following NGF or BDNF stimulation (100 ng/ml) the data points measured by RPPA were clustered in a 115-dimensional molecular dataspace using K-means clustering (K=2). All data points from NGF-stimulated TrkA cells constitute a single cluster shown in blue, and all data points from BDNF-stimulated TrkB cells form a cluster shown in red. Unstimulated control cells are shown in black. (B) High ranked STV components determine the components of a core signaling network. The changes in individual protein activities or abundances between the centroids of the data point clouds that characterize two different cells states were projected onto the STV to determine protein ranks. Resulting high rank proteins constitute the nodes of a core signaling network.
Extended Data Figure 4.
Extended Data Figure 4.. Literature-based prior network and signaling responses to ligand stimulation.
(A) Prior topology of core network connections based on the existing knowledge,,. (B) Time courses of Trk and ERK activation (measured with phosphospecific antibodies, pTrk and ppERK) in TrkA and TrkB cells after stimulation with 100 ng/ml NGF or BDNF, respectively. GAPDH staining was used as loading control. For gel source data, see Supplementary Figure 1. Representative blot of 3 biological replicates is shown.
Extended Data Figure 5.
Extended Data Figure 5.. Reconstruction of core signaling networks by BMRA.
Inferred topologies of TrkA (A) and TrkB (B) core signaling networks. Edges that are specific to TrkA and TrkB are shown in blue and red, respectively. Arrowheads indicate activation, blunt ends indicate inhibition. Line widths indicate the absolute values of interaction strengths.
Extended Data Figure 6.
Extended Data Figure 6.. Model predicted time courses of responses to p70S6K and Trk inhibitors.
Experimental data (dots) are imposed on model predicted time course of signaling responses of TrkA and TrkB cells treated with (A) S6K inhibitor (LY2584702, 1 μM) or (B) Trk inhibitor (SP600125, 5 μM) and stimulated with 100 ng/ml NGF and BDNF, respectively. Dashed lines are the time courses in the absence of inhibitor. TrkA, blue; TrkB, red. Data are presented as mean values +/− SEM for n=3 biologically independent experiments.
Extended Data Figure 7.
Extended Data Figure 7.. Model predicted time courses of responses to MEK and AKT inhibitors.
Experimental data are imposed on model predicted time courses of signaling responses of TrkA and TrkB cells treated with (A) MEK inhibitor (Trametinib, 0.5 μM) or (B) AKT inhibitor (AKT inhibitor IV, 1 μM) and stimulated with 100 ng/ml NGF and BDNF, respectively. Dashed lines show the time courses in the absence of inhibitor. TrkA, blue; TrkB, red. Data are presented as mean values +/− SEM for n=3 biologically independent experiments.
Extended Data Figure 8.
Extended Data Figure 8.. Model predicted time courses of responses to JNK and RSK inhibitors.
Experimental data are imposed on model predicted time-courses of signaling responses of TrkA (blue) and TrkB (red) cells treated with (A) JNK inhibitor (1 μM) or (B) RSK inhibitor (1 μM) and stimulated with 100 ng/ml NGF and BDNF, respectively. Dashed lines show the time courses in the absence of inhibitor. TrkA, blue; TrkB, red. Data are presented as mean values +/− SEM for n=3 biologically independent experiments.
Extended Data Figure 9.
(A) The restoring force f(S) is plotted versus the DPD output S. (B) Waddington’s landscape in the absence of the signaling driving force. The basins of attraction for differentiation and proliferation are colored blue and red, respectively. (C) Schematic diagram of the generation of cell fate decisions by the driving signaling force, which drives cell state changes, and the restoring force, which stabilizes a given cell state.
Extended Data Figure 10.
Extended Data Figure 10.. Live cell images of TrkA cells stimulated with NGF and treated with inhibitors.
Inhibitor concentrations are given in the legend to Extended Data Figures 6–8. Representative images of 3 biological replicates are shown.
Extended Data Figure 11.
Extended Data Figure 11.. Live cell images of TrkB cells stimulated with BDNF and treated with inhibitors.
Inhibitor concentrations are given in the legend to Extended Data Figures 6–8. Representative images of 3 biological replicates are shown.
Extended Data Figure 12.
Extended Data Figure 12.. Model predicted outcomes of TrkA cell inhibitor treatments are corroborated by cell images.
(A) Model predicted DPD responses of TrkA cells to ERBB and MEK inhibitors are shown at 45 min 100 ng/ml NGF stimulation by Loewe isoboles. The ERBB inhibitor applied alone has a negligible effect. (B) The percentages of differentiated TrkA cells show that a combination of ERBB (Gefitinib, GEF) and MEK inhibitors (Trametinib, TRAM) does not change the cell state, as correctly predicted by the model. Data are presented as mean values +/− SEM for n=3 biologically independent experiments. (C) Live cell images of NGF-stimulated TrkA cells treated with 2.5 μM Gefitinib, 0.2 μM Trametinib and a combination of 1.25 μM Gefitinib and 0.1 μM Trametinib taken at 72 hours. Representative images of 3 biological replicates are shown.
Extended Data Figure 13.
Extended Data Figure 13.. Model predicted outcomes of TrkB cell inhibitor treatments are corroborated by cell images.
Live cell images of BDNF-stimulated TrkB cells treated with 2.5 μM Geftitinib, 0.2 μM Trametinib and a combination of 1.2 μM Geftitinib and 0.1 μM Trametinib at 72 hours. Representative images of 3 biological replicates are shown.
Extended Data Figure 14.
Extended Data Figure 14.. Inhibition of p38 does not change the percentage of differentiated TrkA and TrkB cells.
Live cell images of NGF-stimulated TrkA (A) cells and BDNF-stimulated TrkB (B) cells treated with 10 μM p38 inhibitor SB203580 for 72 hours. Representative images of 3 biological replicates are shown.
Extended Data Figure 15.
Extended Data Figure 15.. Separation of MS phosphoproteomic patterns of TrkA and TrkB cell states and the STV projection into the PCA space.
Following GF stimulation, TrkA (blue) and TrkB (red) states were separated by a SVM. Projections of data points, the separating hyperplane (grey) and the STV (dark red) are shown in the space of the first three principal components. The text in red indicates the kinases that phosphorylate the top STV components.
Extended Data Figure 16.
Extended Data Figure 16.. Separation of apoptotic and proliferation states of SKMEL-133 cells and a projection into the PCA space.
SVM separation of phosphoproteomic patterns of proliferation states in growing SKMEL-133 cells and apoptotic states after treatment with a combination of PI3K/AKT/mTOR and MEK inhibitors. The data are taken from Korkut et al. Projections of the separated data points, the separating hyperplane (black) and the STV (dark red) are shown in the space of the first two principal components.
Extended Data Figure 17.
Extended Data Figure 17.. Model calculated and experimentally determined DPD responses of SKMEL-133 cells to different inhibitors.
(A) The experimentally measured DPD values (dots) are calculated based on the data from the reference Korkut et al. Model-predicted (blue curves) DPD responses to many inhibitors exhibit abrupt DPD decreases at certain inhibitor doses caused by the loss of stability of a proliferation state and the induction of apoptosis in a threshold manner. Mathematically, an abrupt DPD decrease relates to a saddle-node bifurcation (a fold catastrophe) that occurs when a stable steady-state solution corresponding to a proliferation state disappears. Data are presented as mean values +/− SEM for n=3 biologically independent experiments. (B) Synergy between MEK/ERK and PI3K/AKT inhibitors is demonstrated by concave Loewe isoboles.
Extended Data Figure 18.
Extended Data Figure 18.. Separation of scRNAseq transcriptomic patterns of epithelial and mesenchymal states and projections into the PCA states.
Single cell RNAseq data were separated by SVM in untreated (blue) and treated with TGFβ (red) A549 (A), DU145 (B), MCF7 (C) and OVCA420 (D) cells. Projections of data points, the separating hyperplane (grey) and the STV (dark red) are shown in the space of the first three principal components.
Extended Data Figure 19.
Extended Data Figure 19.. DPD responses of Py2T, A549, DU145, MCF7 and OVCA420 cell lines to specific inhibitors of different signaling modules.
The cell lines, ligands and inhibited modules are indicated on the horizontal and vertical axes. The normalized DPD value 1 corresponds to fully mesenchymal state, and normalized DPD value 0 corresponds to fully epithelial state.
Extended Data Figure 20.
Extended Data Figure 20.. Single-cell DPD distributions for A549, DU145, MCF7, OVCA420 cells.
Left panels show single-cell DPD distributions for cells stimulated with TGFβ, EGF or TNF for 7 days. Right panels show single-cell DPD distributions for TGFβ-stimulated cells treated with RIPK1 inhibitor for 7 days.
Extended Data Figure 21.
Extended Data Figure 21.. Single-cell DPD distribution for Py2T cells treated with TGFβ for 7 days.
Figure 1.
Figure 1.. Overview of cSTAR and experimental system.
(A) cSTAR approach workflow. Clockwise: (i) Acquisition of omics datasets; (ii) Cell state classification by clustering and SVM state separation; (iii) The STV indicates a path between centroids of cell state data point clouds; (iv) A core signaling network of high-ranked STV components is reconstructed by BMRA. The DPD summarizes the cell-wide network; (v) A mechanistic model of the core network and cell state transitions; x, the outputs of signaling modules; S, the DPD module output; U, the potential, cell state transitions interpreted as cell maneuvering in Waddington’s landscape. (B) SH-SY5Y cells stably expressing TrkA or TrkB receptors were stimulated with 100 ng/ml NGF or BDNF resulting in differentiation or proliferation, which were assessed 72 hours after GF treatment.
Figure 2.
Figure 2.. Separation of proliferation and differentiation signaling patterns and the STV projection into the PCA space.
(A) Following GF stimulation, TrkA (blue triangles) and TrkB (red triangle) states were separated by SVM. Large triangles are point cloud centroids. Projections of data points, the separating hyperplane (grey) and the STV (dark red) are shown in the space of the first 3 principal components. (B) Decomposition of a perturbation vector (solid black line) into a vector collinear with the STV and a vector perpendicular to the STV (dotted lines). TrkB cells were treated with BDNF and the p90RSK inhibitor BI-D1870. Green triangles, TrkB data points after perturbation.
Figure 3.
Figure 3.. The Dynamic Phenotype Descriptor (DPD) module output.
(A, B) BMRA reconstructed topologies of the core signaling networks and connections to the DPD module in TrkA (A) and TrkB (B) cell lines. Arrowheads indicate activation, blunt ends show inhibition, line widths indicate the absolute values of interaction strengths. Edges specific to TrkA and TrkB are shown in blue and red. (C, D) Blue, red and green triangles show PCA-compressed 45 min data points for TrkA cells, TrkB cells, and TrkB cells treated with p90RSK inhibitor. The distances of TrkB centroids to the separating hyperplane (grey) before and after perturbation are shown by black lines. The DPD module output is the distance of a centroid from the separation hyperplane determined along or opposite the STV direction taken with the plus sign if the centroid is located at the right side from the separation hyperplane (proliferation), and with the minus sign if the centroid is at the left side (differentiation).
Figure 4.
Figure 4.. Computing signaling patterns and modeling cell maneuvering in Waddington’s landscape using the DPD.
(A, B) Experimental data are imposed on model-predicted time-courses for NGF-stimulated TrkA (blue) and BDNF-stimulated TrkB (red) cells. (C, D) Waddington’s landscape evolution predicted by the model for TrkA (C) and TrkB (D) cells following ligand stimulation. The Waddington landscape potential W is plotted against the DPD (S) and time (from 0 to 45 minutes). At t = 0, cells reside in stable ground state (S0). Following stimulation by GFs, TrkA and TrkB cells maneuver to differentiation (C) and proliferation (D) states (model-predicted trajectories shown by black lines). (E) Experimentally measured (dots) and model-predicted (solid lines) DPD responses (S) to ligand stimulation in TrkA and TrkB cells. (F) Percentages of differentiated TrkA/B cells stimulated with GFs for 72 hours compared to unstimulated controls. The decrease in differentiation of BNDF-stimulated TrkB cells reflects the increase of proliferation. Data are presented as mean values +/− SEM for n=3 biologically independent experiments, Table S13 contains data. The asterisk * indicates p<0.05 calculated using unpaired one-sided t-test.
Figure 5.
Figure 5.. Model predicted DPD values and quantification of phenotypic responses of TrkA and TrkB cells to different inhibitors.
(A-C, G-I) Model-predicted time courses (lines) and experimentally measured (dots) DPD responses of TrkA (blue) and TrkB (red) cells to inhibitor treatments (see legends to Extended Data Figures 6–8 for inhibitor concentrations). (D-F, J-L) Percentages of differentiated TrkA and TrkB cells quantified using live-cell images. (M) Simulated DPD time-course of the response of NGF-stimulated TrkA cells to a 10-fold increase in AKT activity predicts persistent proliferation (solid line), whereas simulated DPD time-course of NGF-stimulated control cells predicts differentiation (dashed line). (N, O) Live cell images of TrkA cells transfected with myristoylated AKT (N) and stimulated with NGF for 72 hours. Representative live images of 3 biological replicates are shown. (O) confirm modeling predictions. Data are presented as mean values +/− SEM for n=3 biologically independent experiments. The asterisk * indicates p<0.05 calculated using unpaired one-sided t-test.
Figure 6.
Figure 6.. Inhibition of ERBB and ERK modules synergistically induces differentiation of TrkB-expressing cells.
(A) Model-predicted DPD responses of TrkB cells to ERBB and MEK inhibitors applied separately and in combinations are shown in a two-dimensional plane of the drug doses at 45 min BDNF stimulation. Constant DPD lines, Loewe isoboles, show the borders between the differently colored areas; concave isoboles demonstrate synergy. (B) Percentages of differentiated TrkB cells corroborate model-predicted synergy between ERBB and MEK inhibitors in inducing TrkB cell differentiation. Data are presented as mean values +/− SEM for n=3 biologically independent experiments. The asterisk * indicates that p<0.05 calculated using unpaired one-sided t-test. (C) Responses of FAK phosphorylation (cell differentiation marker) to Geftitinib (2.5 and 5 μM), Trametinib (0.1 and 0.2 μM) and their combination (2.5 and 0.05 μM, and 1.25 and 0.1 μM) at 72 hours. For gel source data, see Supplementary Figure 1. Representative blot of 3 biological replicates is shown. (D) ERBB and MEK inhibitors synergistically induce TrkB cell differentiation. The DPD values calculated using MS phosphoproteomics data for TrkA and TrkB cells treated with Trametinib (0.5 μM), Gefitinib (2.5 μM), and their combination (0.25 μM and 1.25 μM) at 45-minute stimulation. Data are presented as mean values +/− SEM for n=3 biologically independent samples examined over 2 independent experiments. Dashed, red bar shows the expected DPD value for the Bliss independence of a combination treatment of TrkB cells with Trametinib and Gefitinib.
Figure 7.
Figure 7.. cSTAR analysis of RAF inhibitor resistant SKMEL-133 cells.
(A-B) Inferred topologies of a core signaling network that (A) lacks or (B) includes c-MYC. Arrowheads indicate activation, blunt ends show inhibition, line widths indicate the absolute values of interaction strengths. (C-D) Model-predicted steady-state DPD responses to (C) MYC and MEK inhibitors and (D) Insulin/IGF1 receptor and PI3K/AKT inhibitors are shown by Loewe isoboles. Synergy is more pronounced in (D). (E-G) Model-predicted SKMEL-133 cell maneuvering (black lines) in Waddington’s landscape following inhibitor treatments. The Waddington landscape potential (W) plotted against the DPD (S) and time. At t = 0 cells reside in a highly proliferating state (high positive values of DPD). PI3K/AKT and Insulin/IGF1 receptor inhibitors were added at t = 30 min at the 3Kd and 4Kd doses. When the inhibitors are applied separately (E, F), the decreasing DPD values remain in the proliferation region (positive DPD values). (G) Treated with a combination of inhibitors in twice lower doses (1.5Kd for PI3K/AKT inhibitor and 2Kd for Insulin/IGF1 receptor inhibitor), the cells maneuver to the apoptotic state manifested by negative DPD values. A threshold-like switch to negative DPD (black arrow) is a switch from proliferation to apoptosis.

Similar articles

Cited by

References

    1. Waddington CH Organisers and Genes by C. H. Waddington. (The University Press, 1940).
    1. Brackston RD, Lakatos E & Stumpf MPH Transition state characteristics during cell differentiation. PLoS Comput Biol 14, e1006405, doi:10.1371/journal.pcbi.1006405 (2018). - DOI - PMC - PubMed
    1. Wang J, Zhang K, Xu L & Wang E Quantifying the Waddington landscape and biological paths for development and differentiation. Proc Natl Acad Sci U S A 108, 8257–8262, doi:10.1073/pnas.1017017108 (2011). - DOI - PMC - PubMed
    1. Hormoz S et al. Inferring Cell-State Transition Dynamics from Lineage Trees and Endpoint Single-Cell Measurements. Cell Syst 3, 419–433 e418, doi:10.1016/j.cels.2016.10.015 (2016). - DOI - PMC - PubMed
    1. Kholodenko BN et al. Untangling the wires: A strategy to trace functional interactions in signaling and gene networks. Proceedings of the National Academy of Sciences 99, 12841, doi:10.1073/pnas.192442699 (2002). - DOI - PMC - PubMed

Publication types