. 2022 Sep;609(7929):986-993.
doi: 10.1038/s41586-022-05171-5. Epub 2022 Sep 14.

Glucose-driven TOR-FIE-PRC2 signalling controls plant development

Affiliations

Glucose-driven TOR-FIE-PRC2 signalling controls plant development

Ruiqiang Ye et al. Nature. 2022 Sep.

Abstract

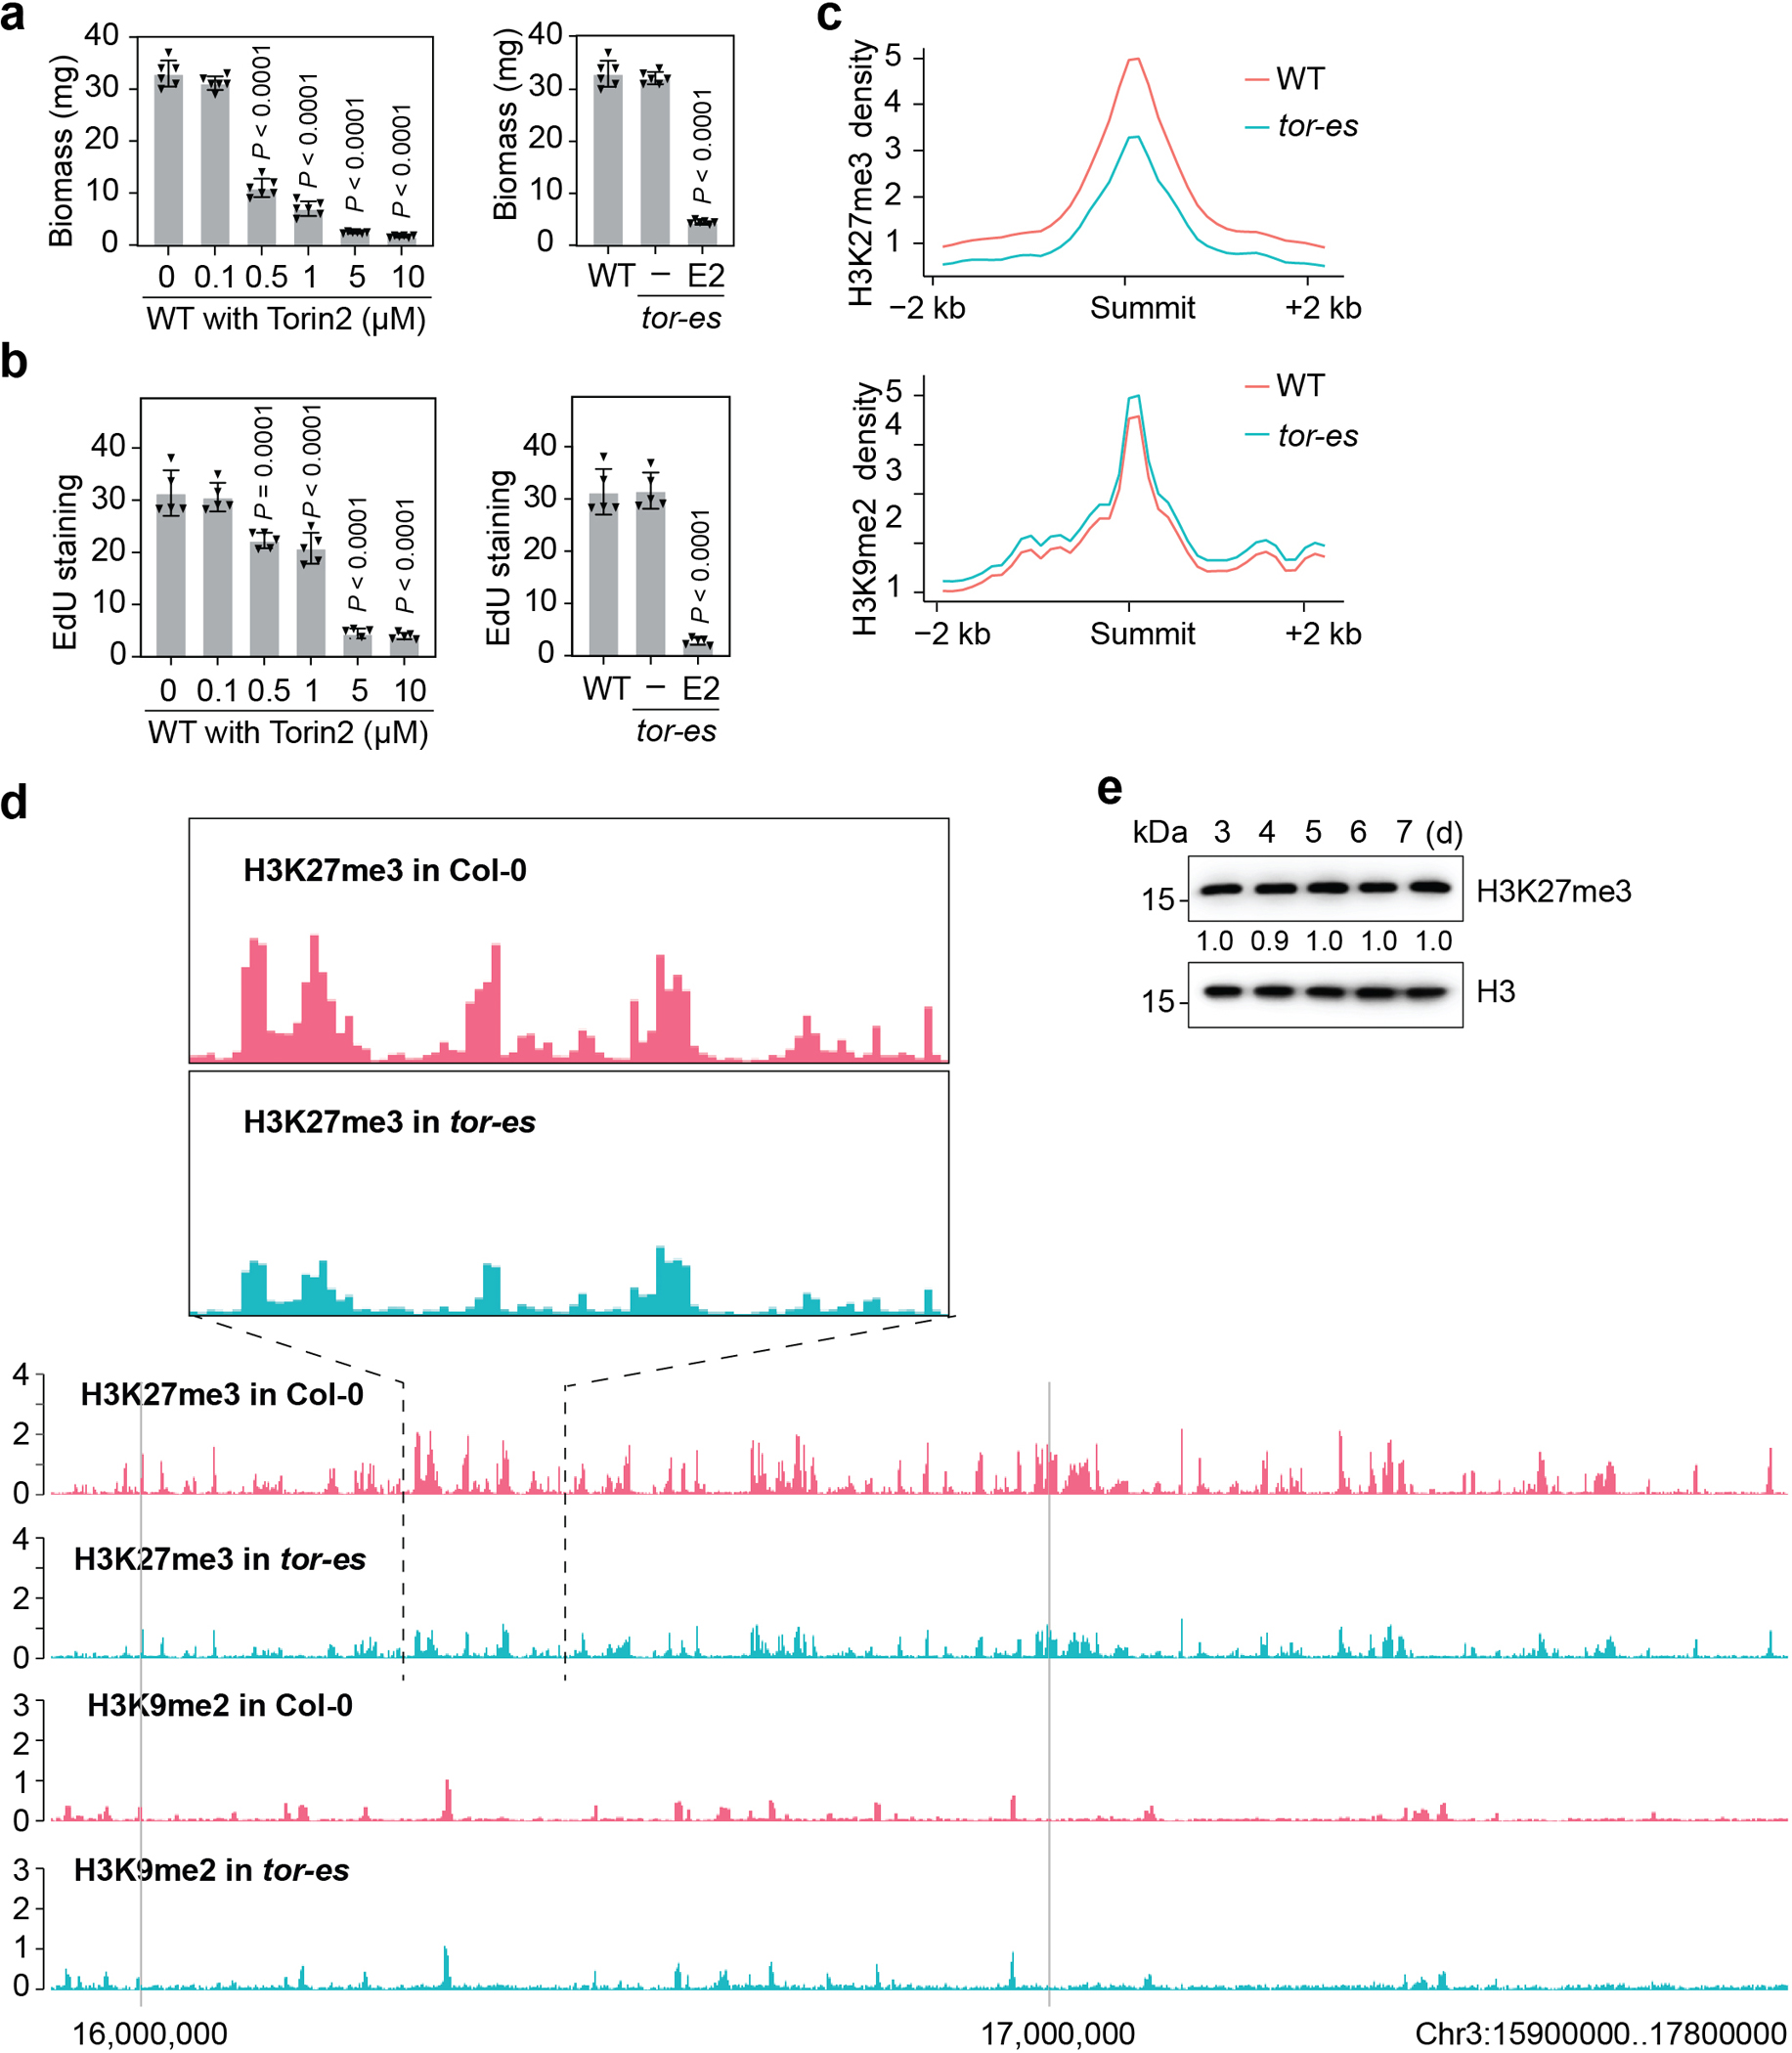
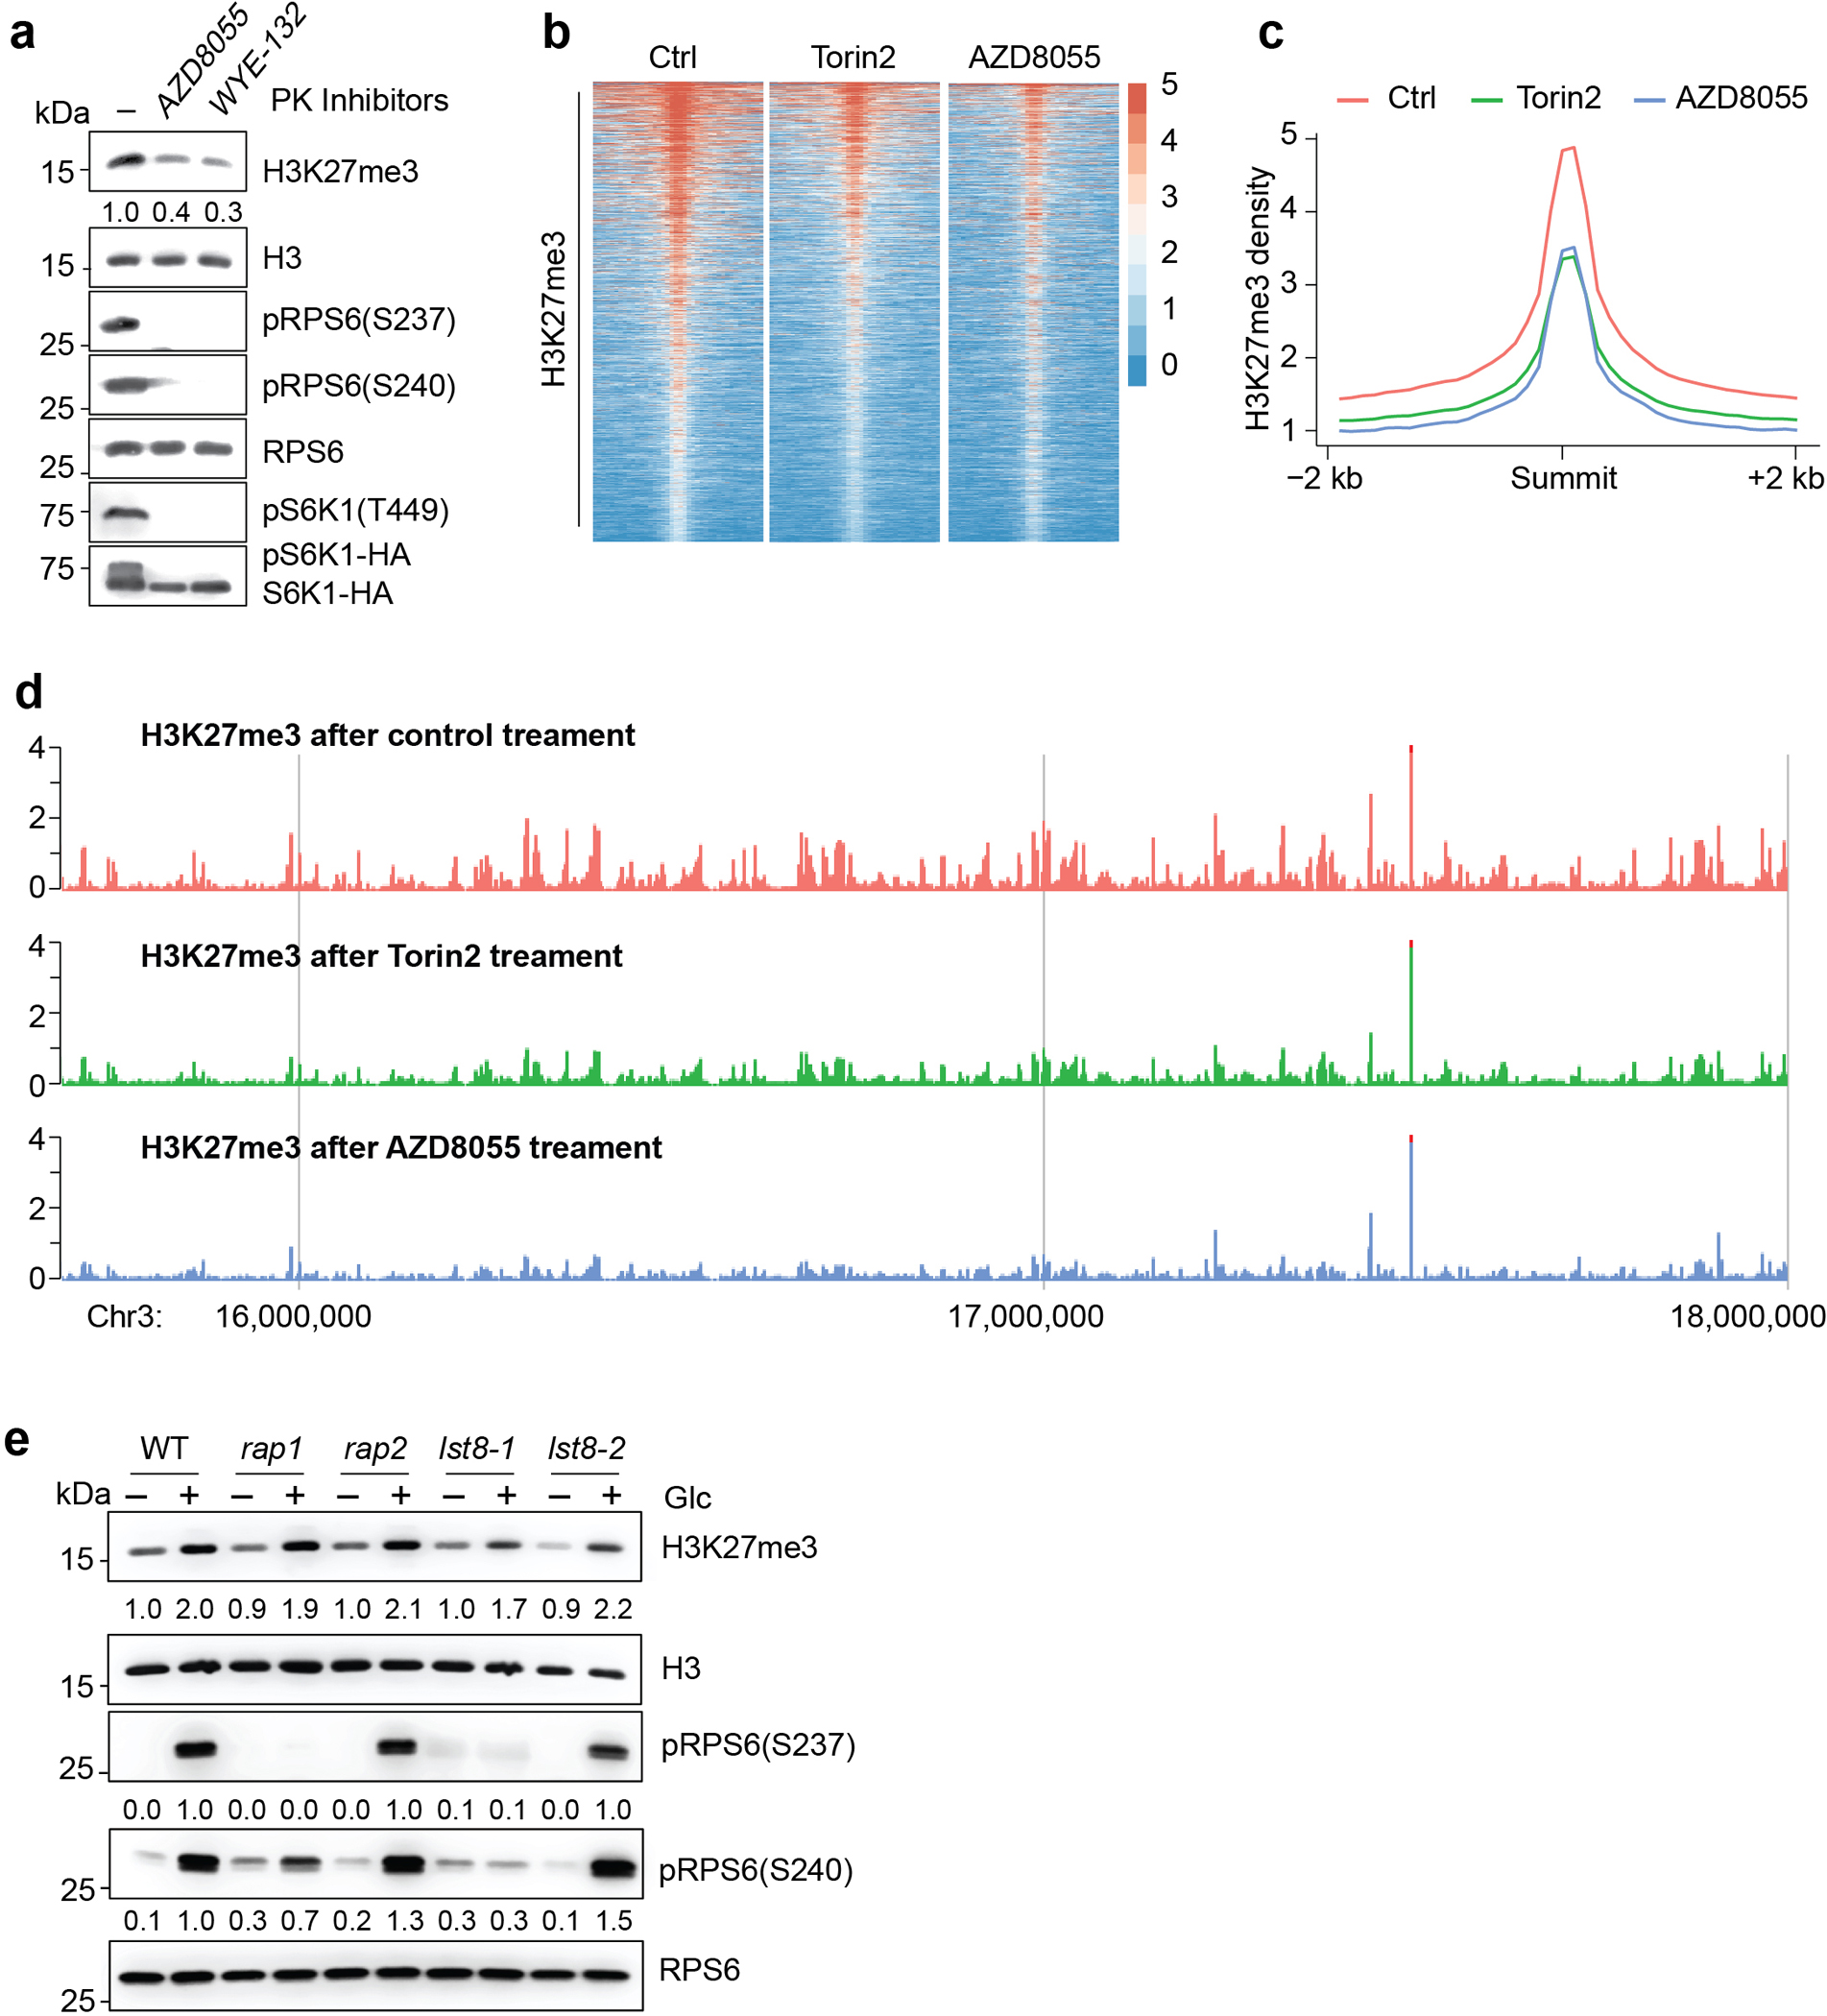
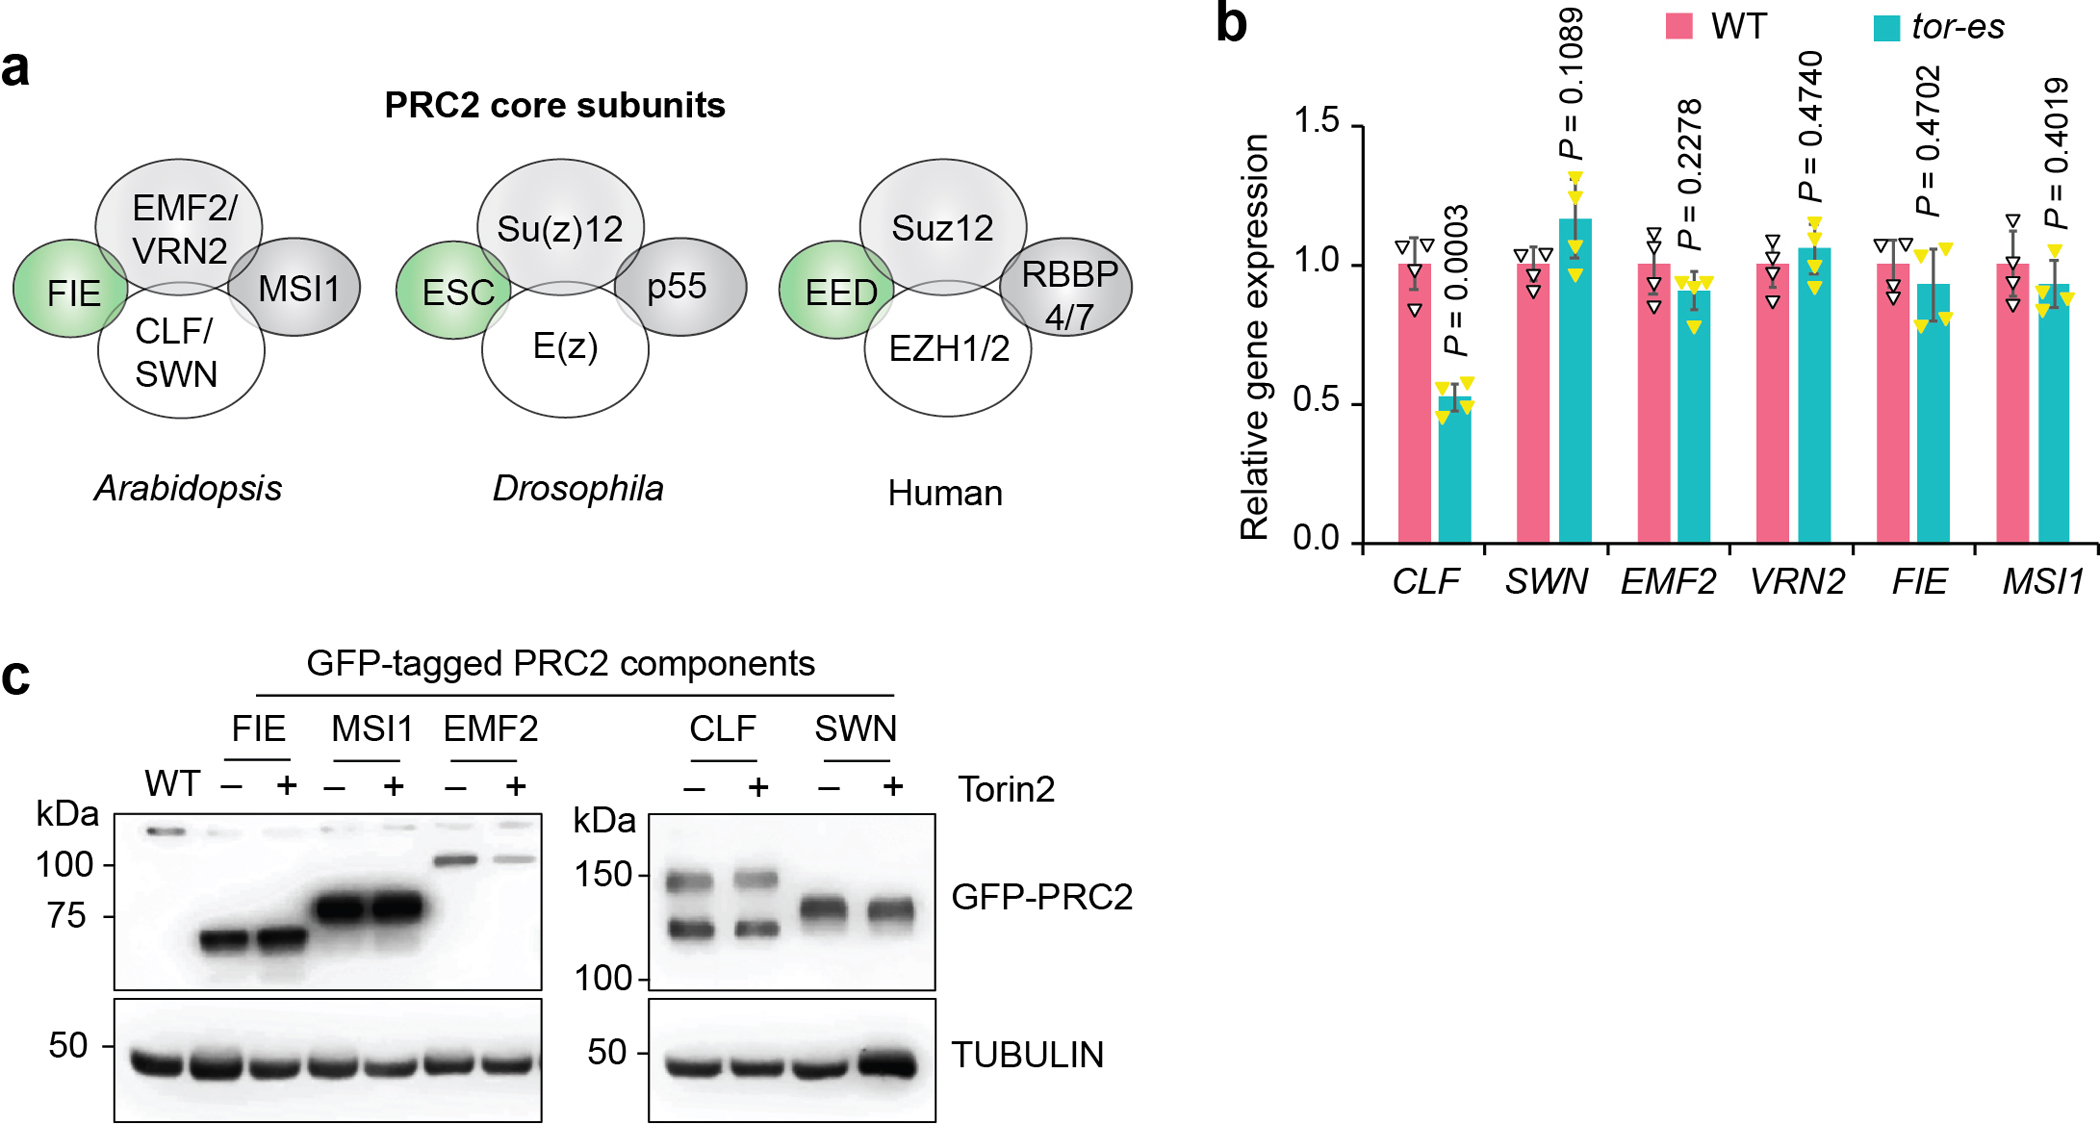
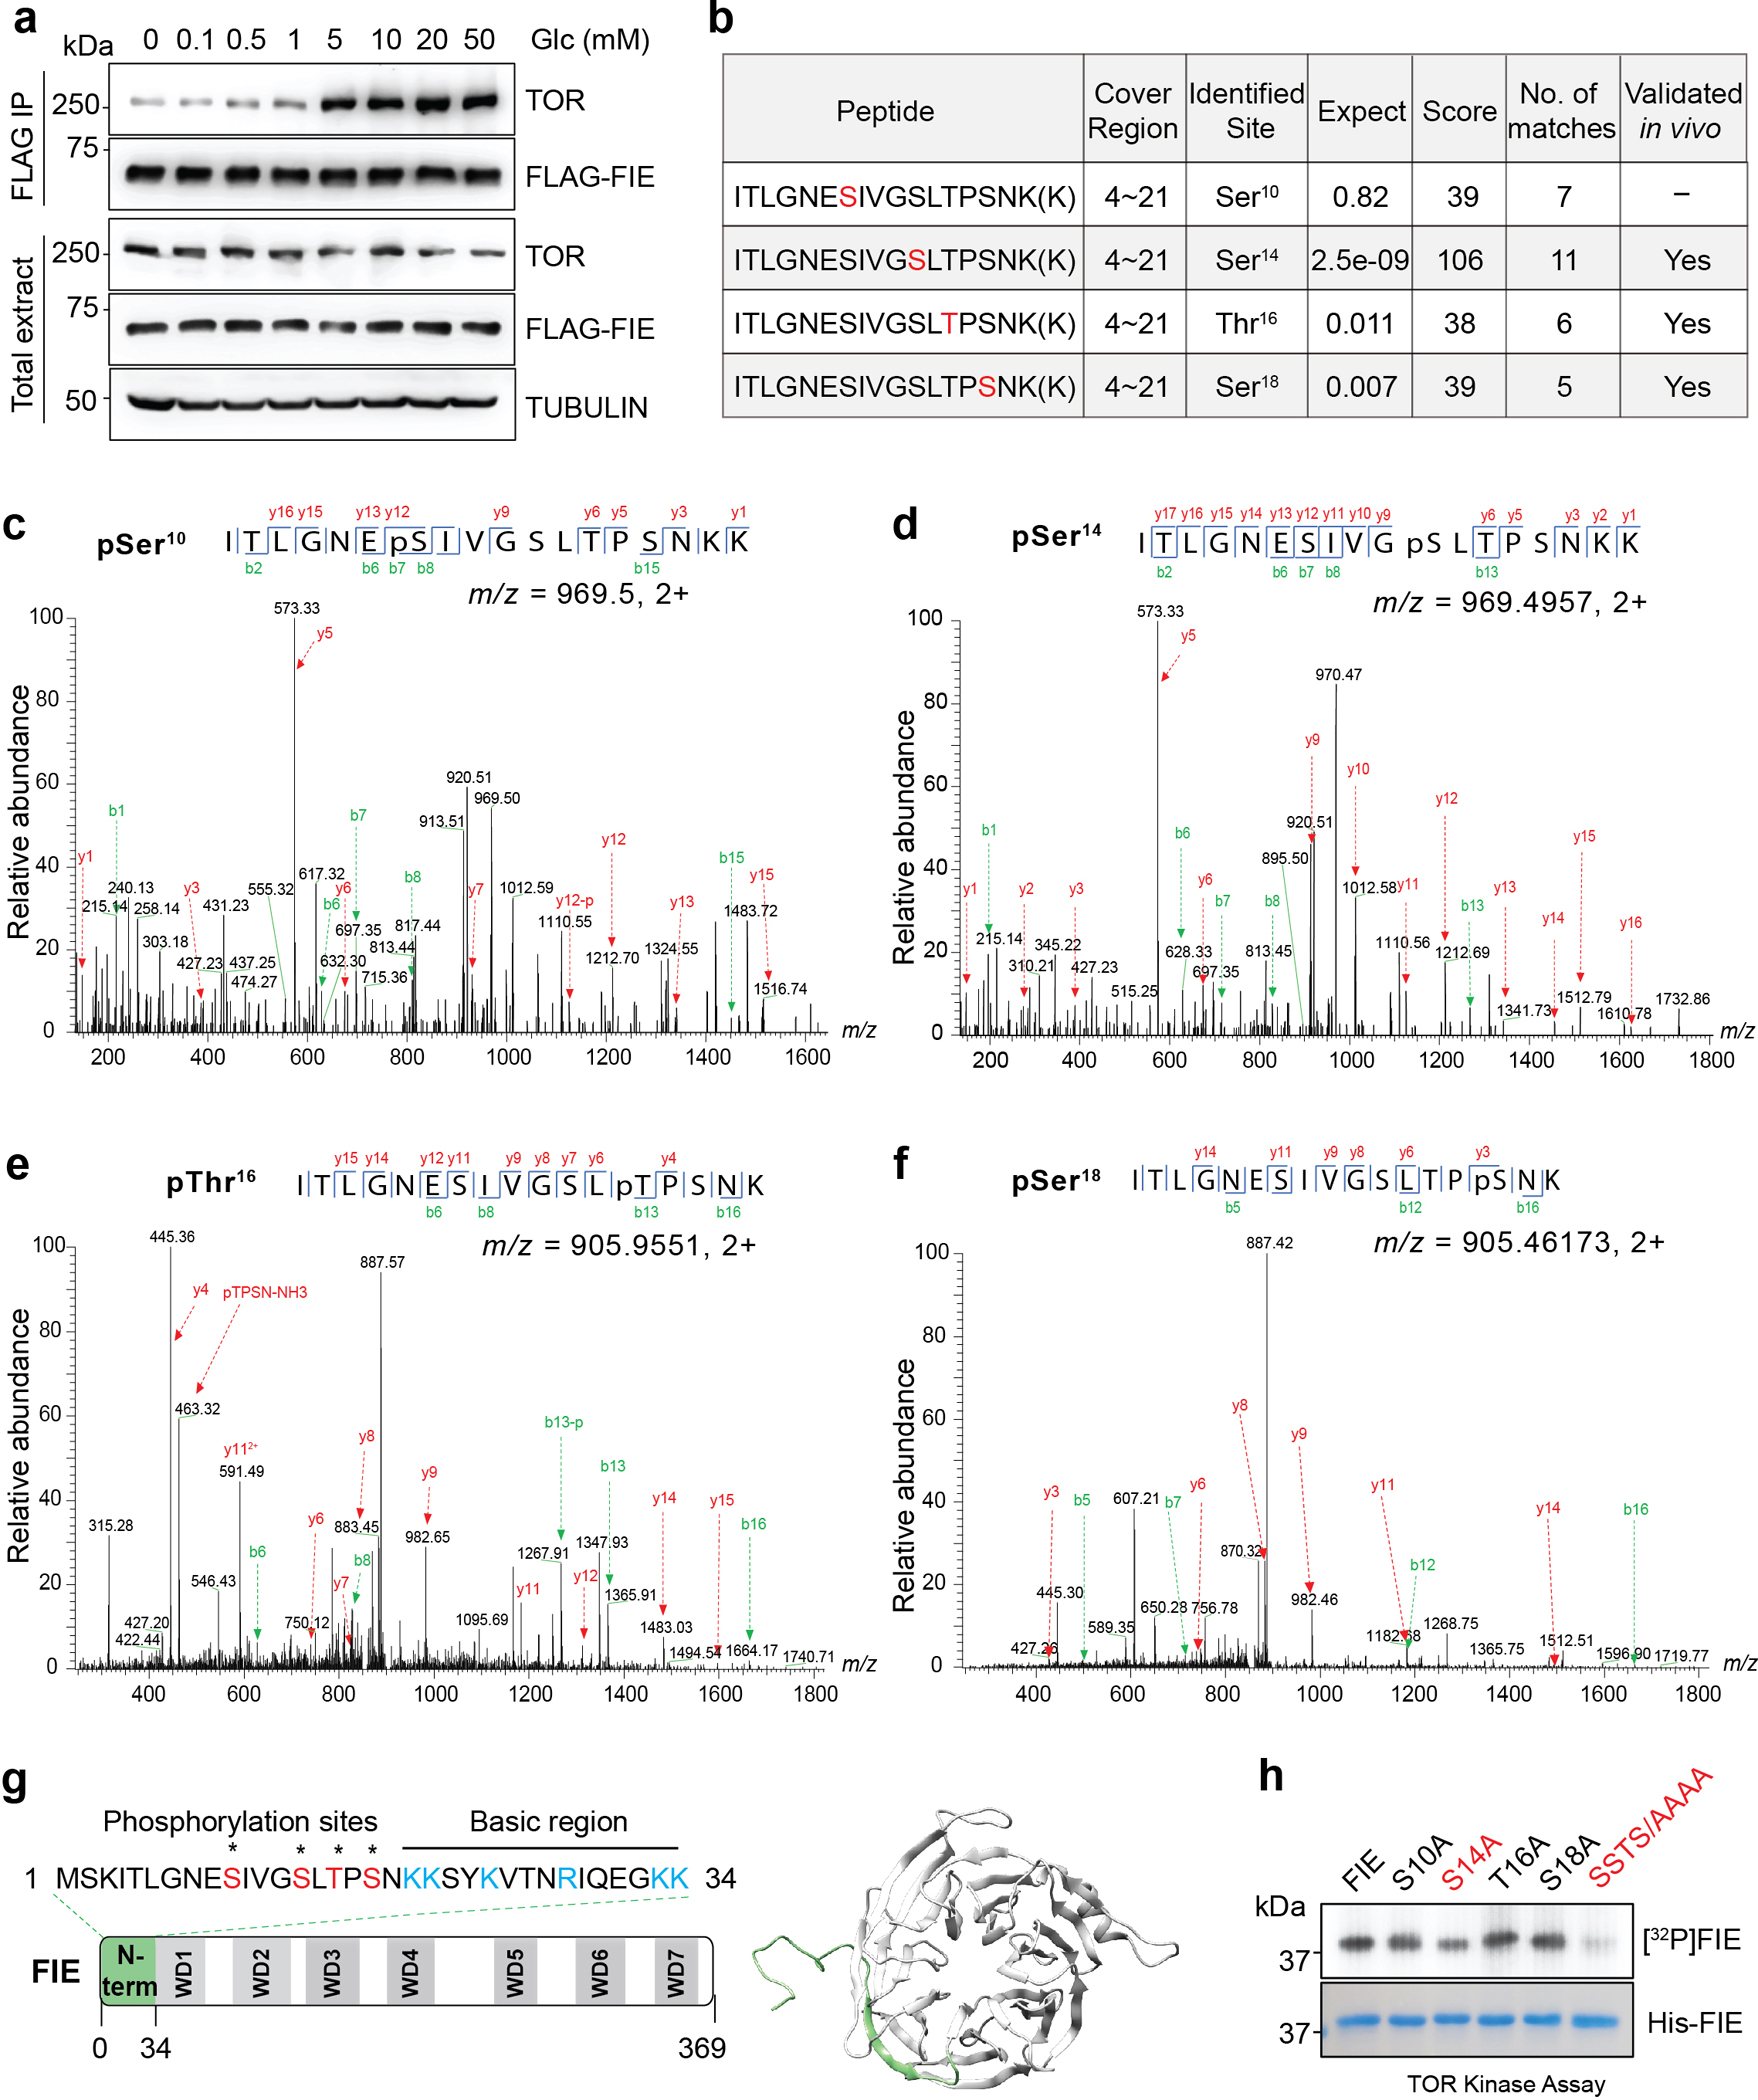
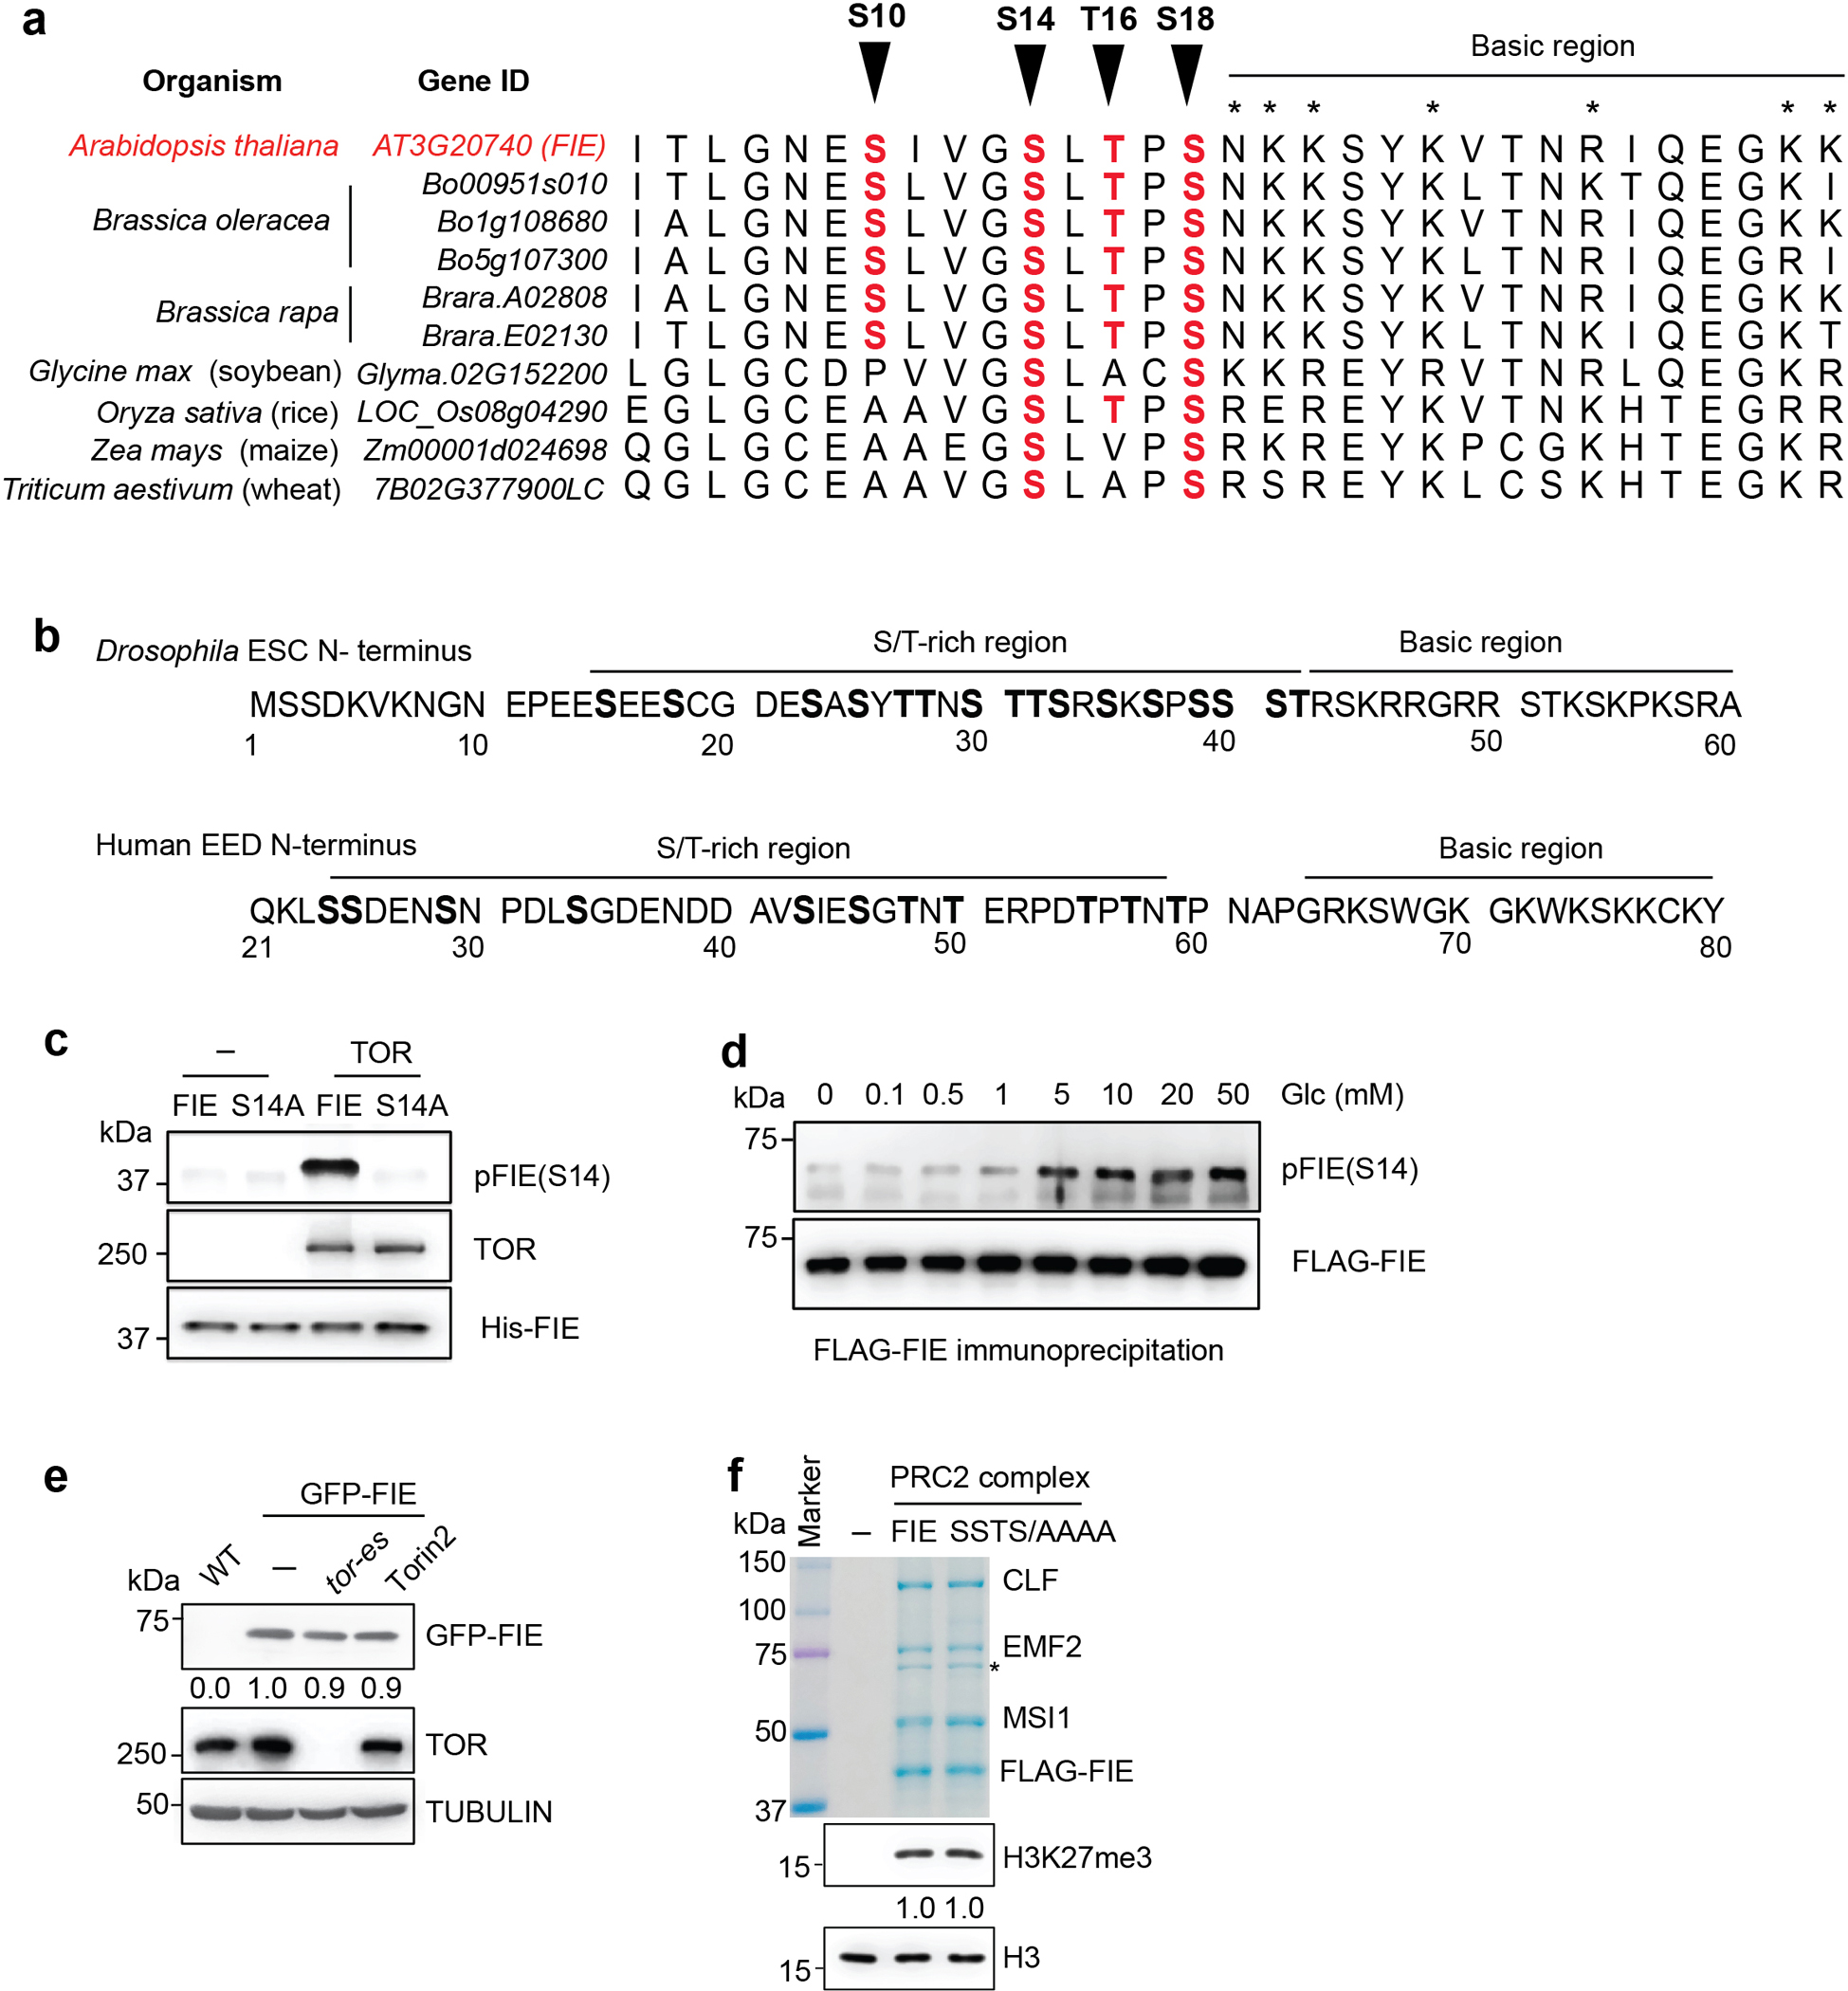
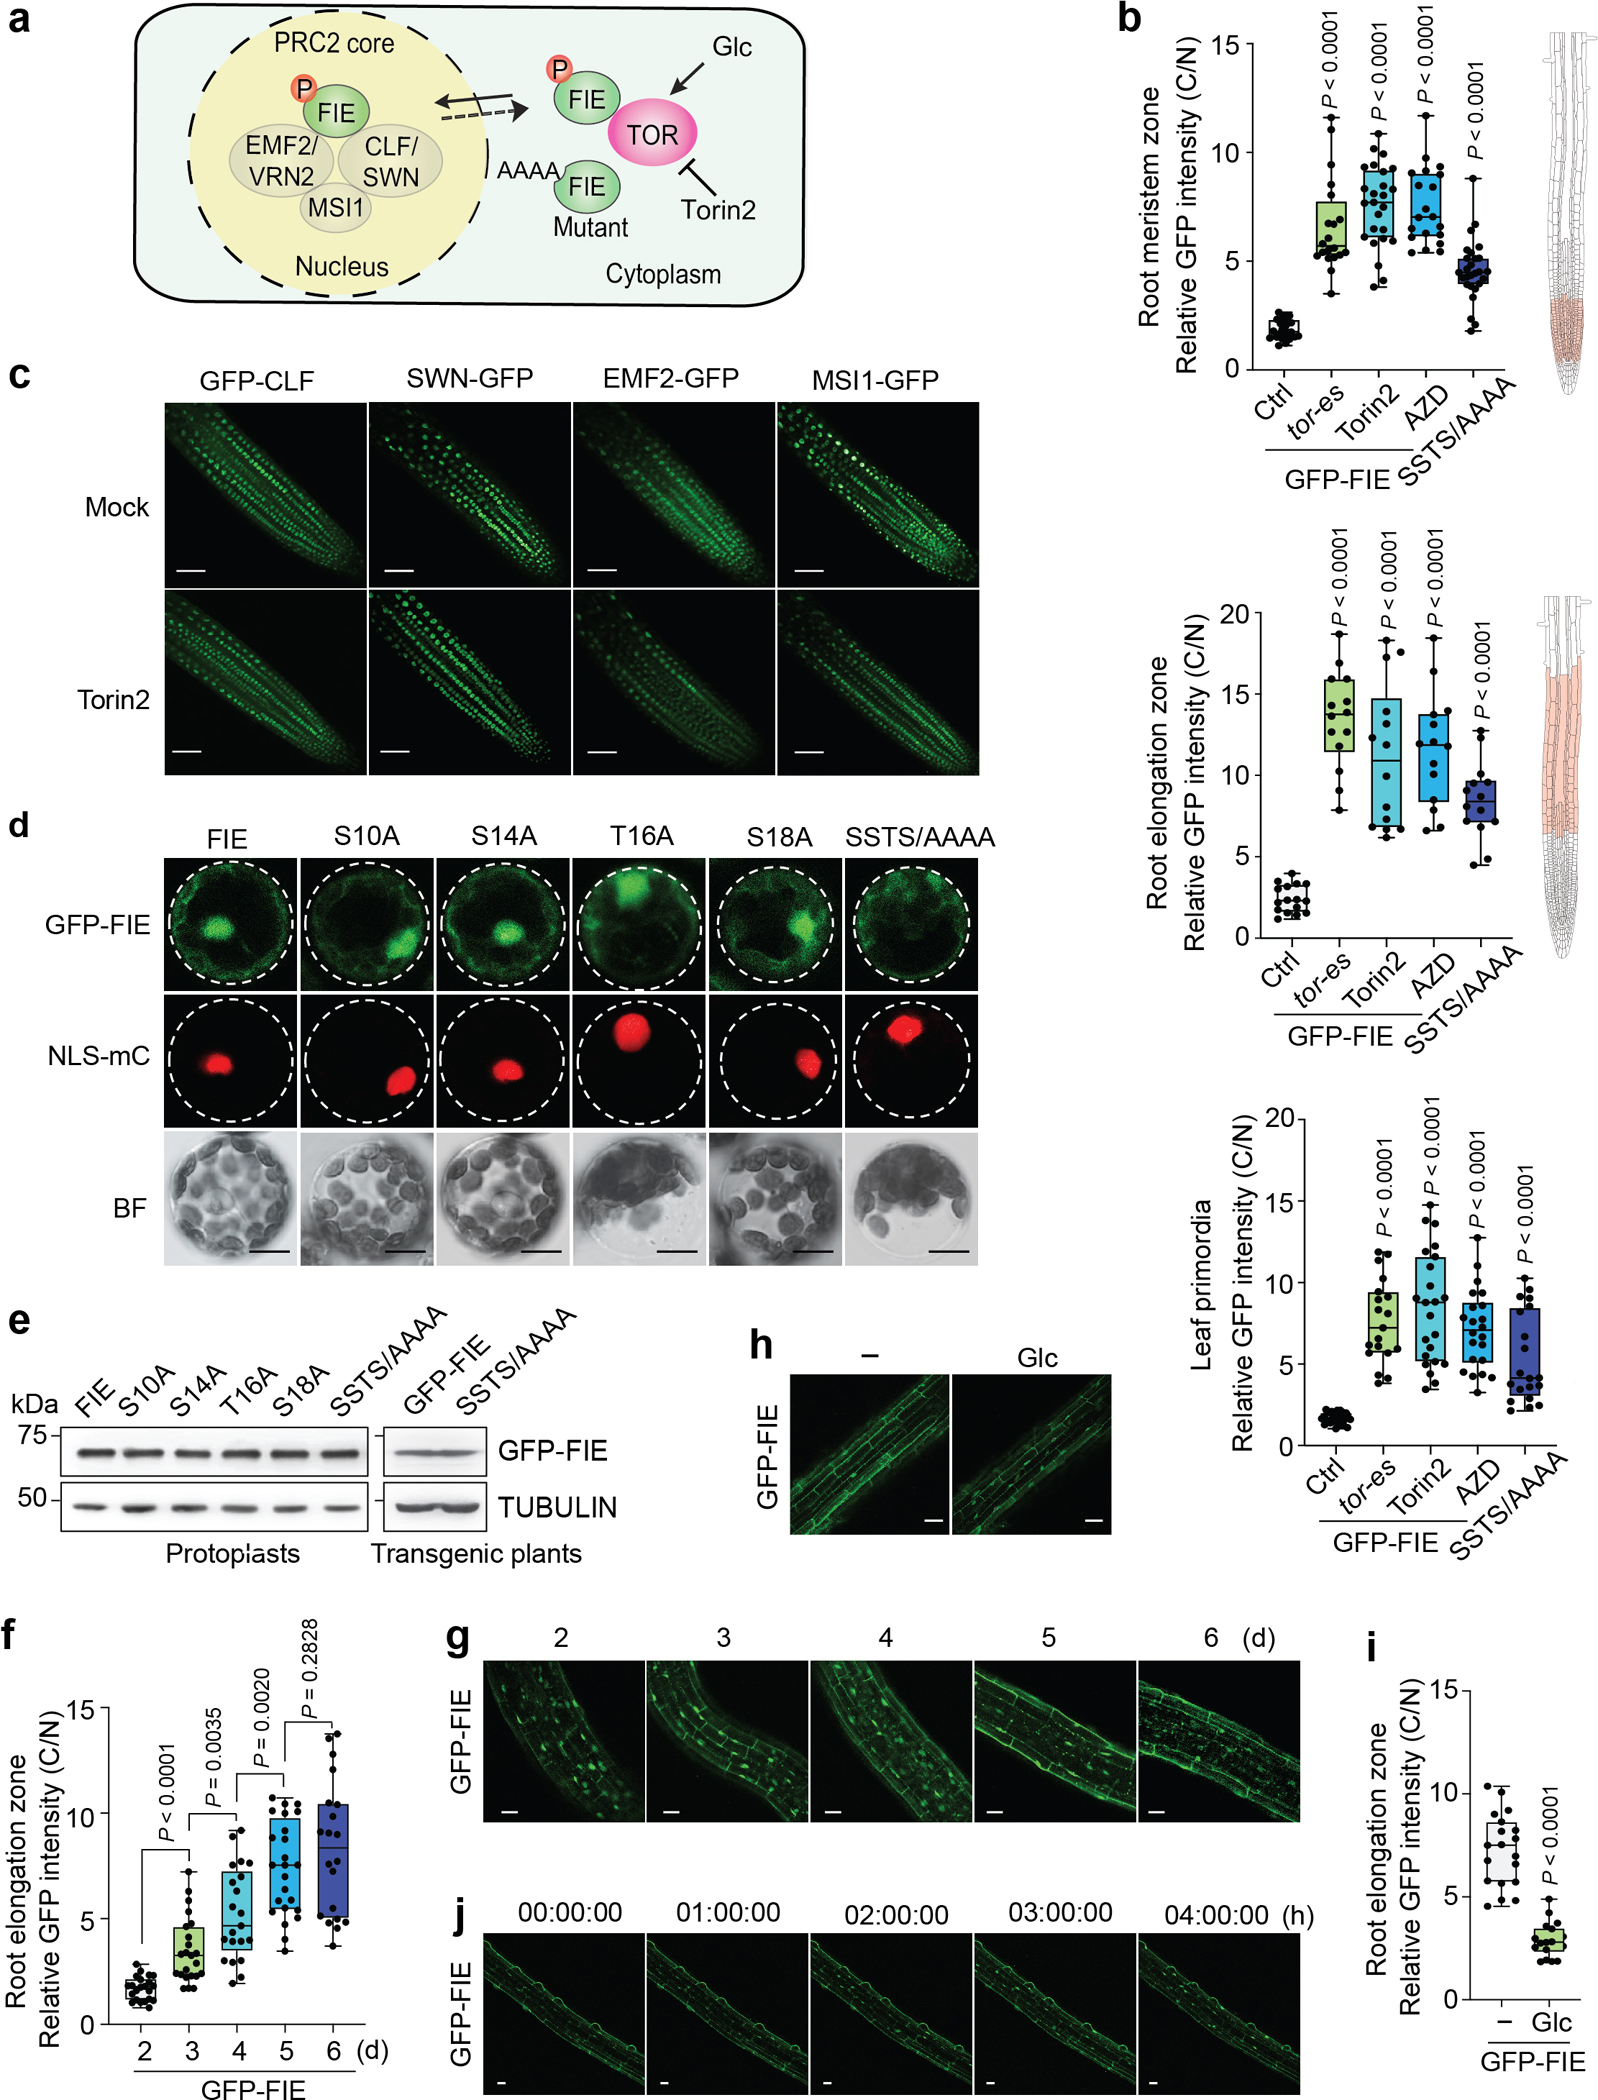
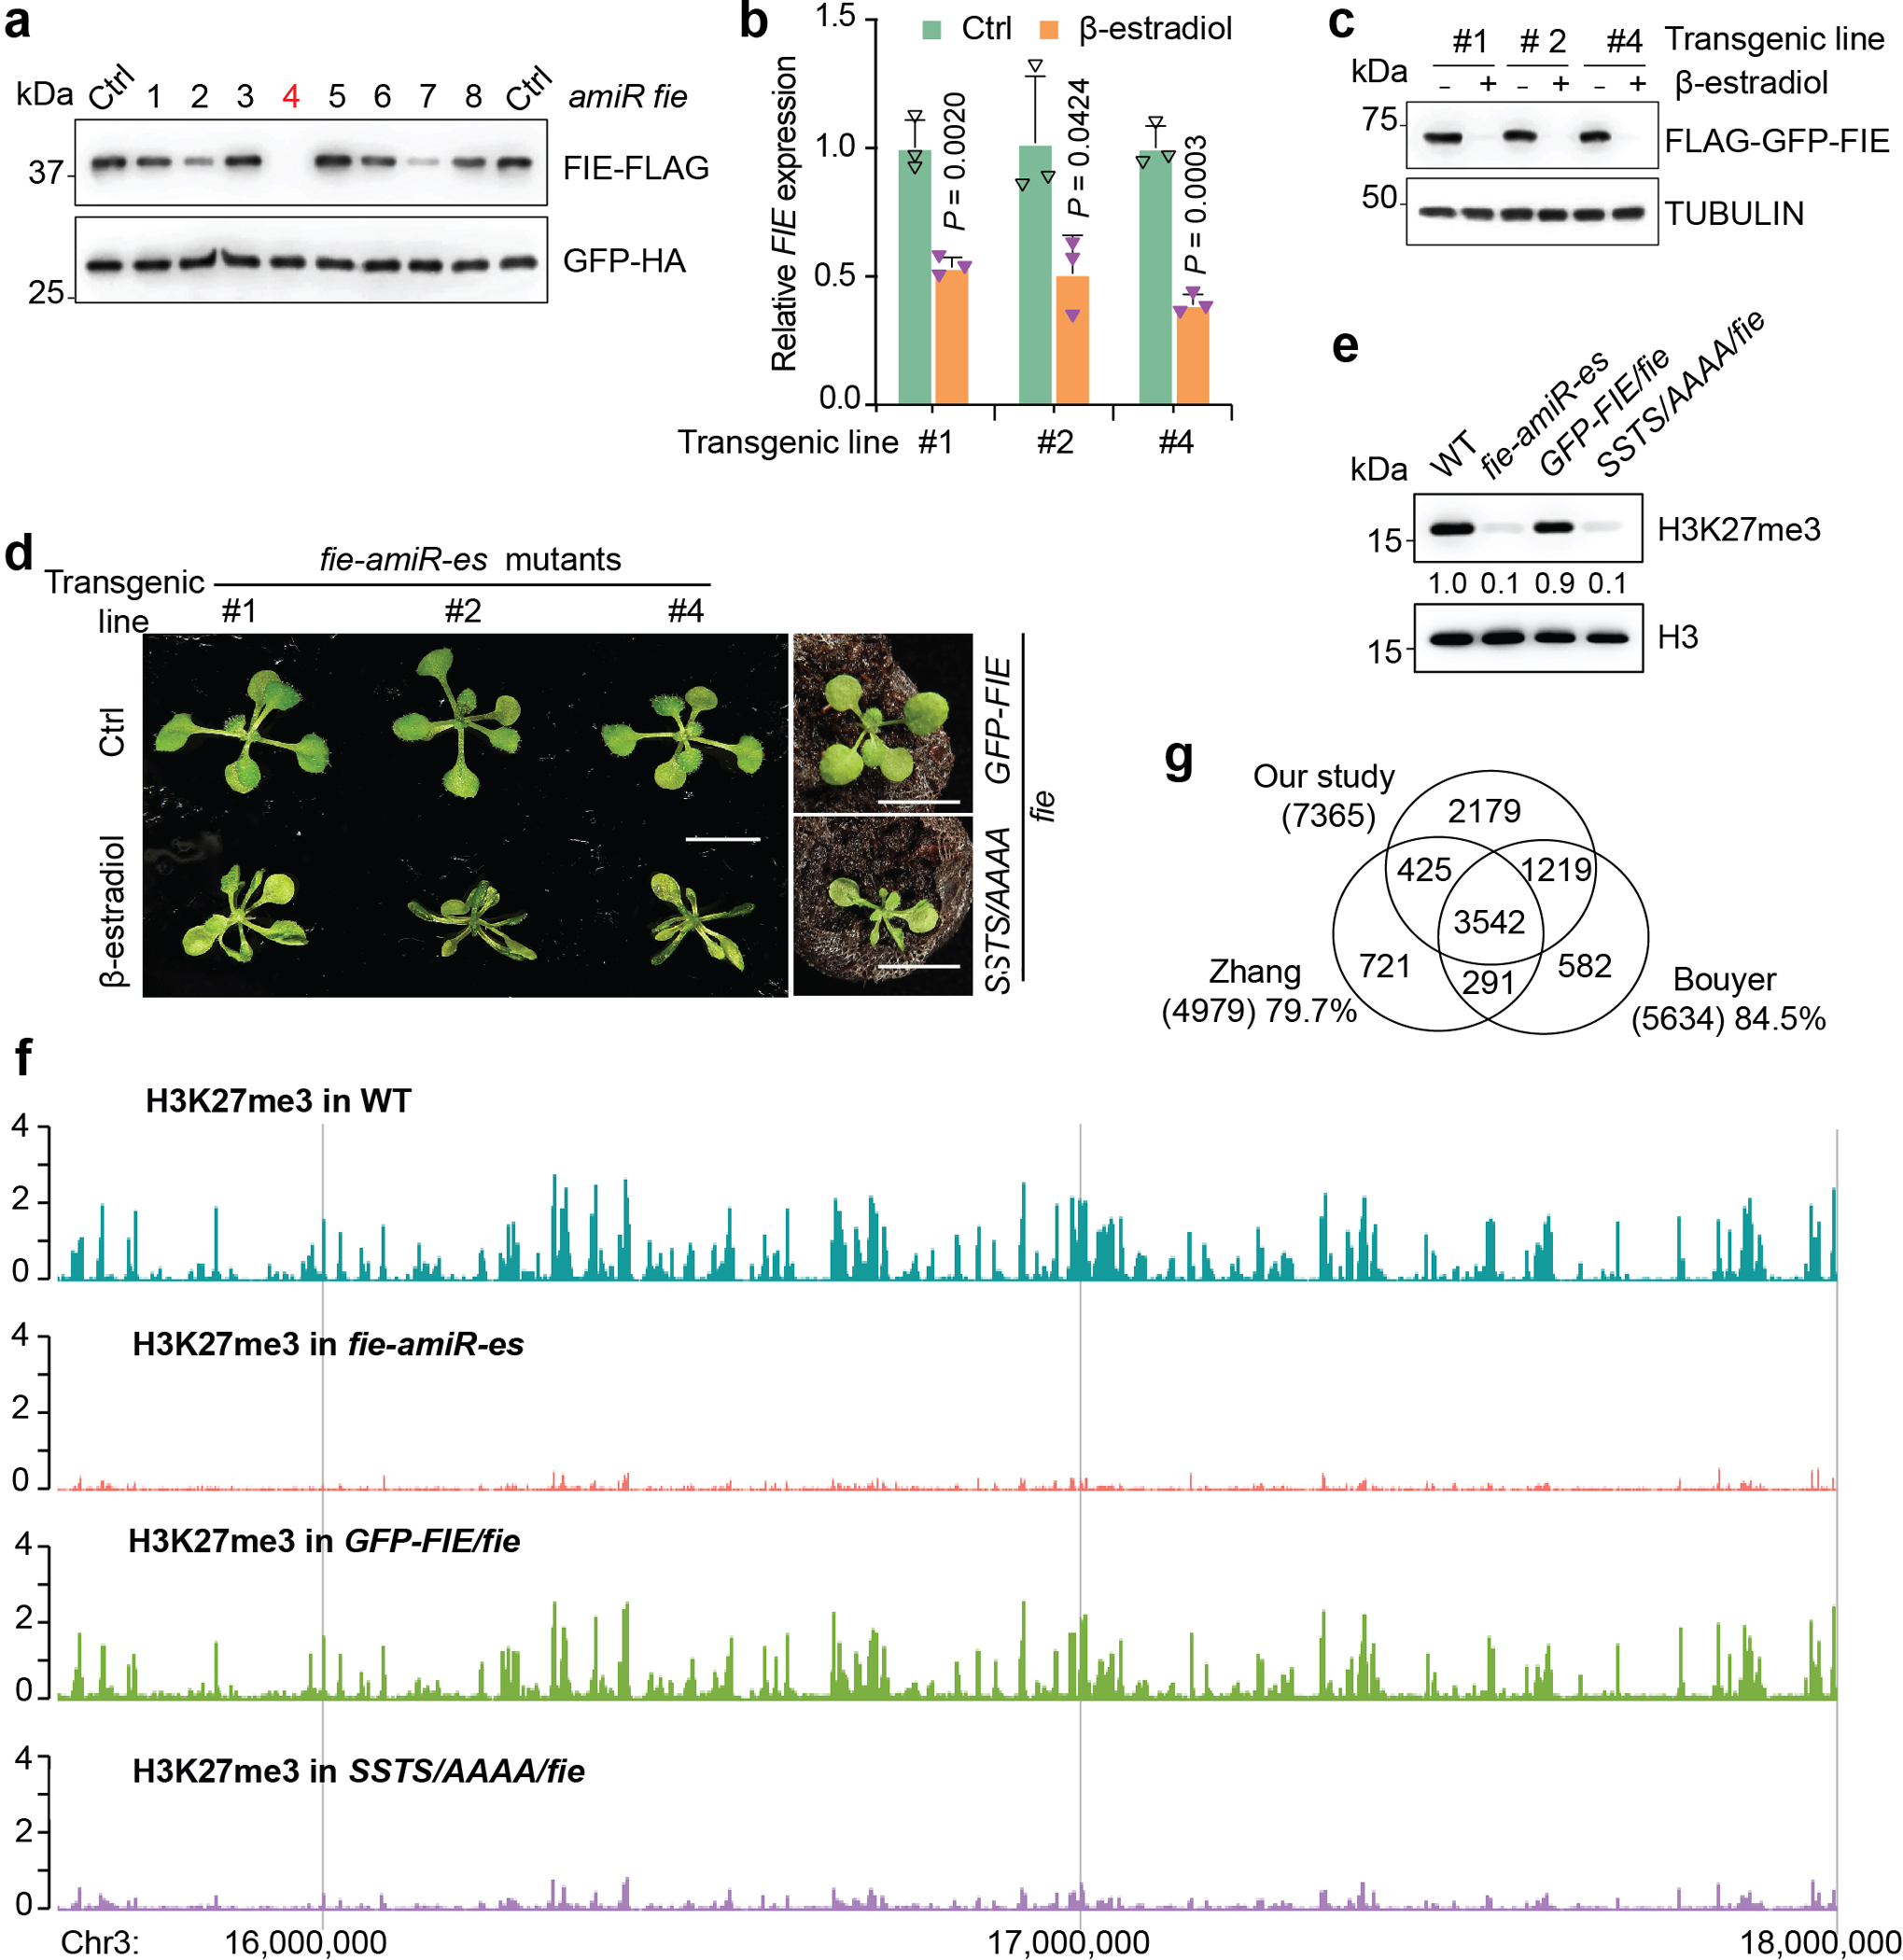
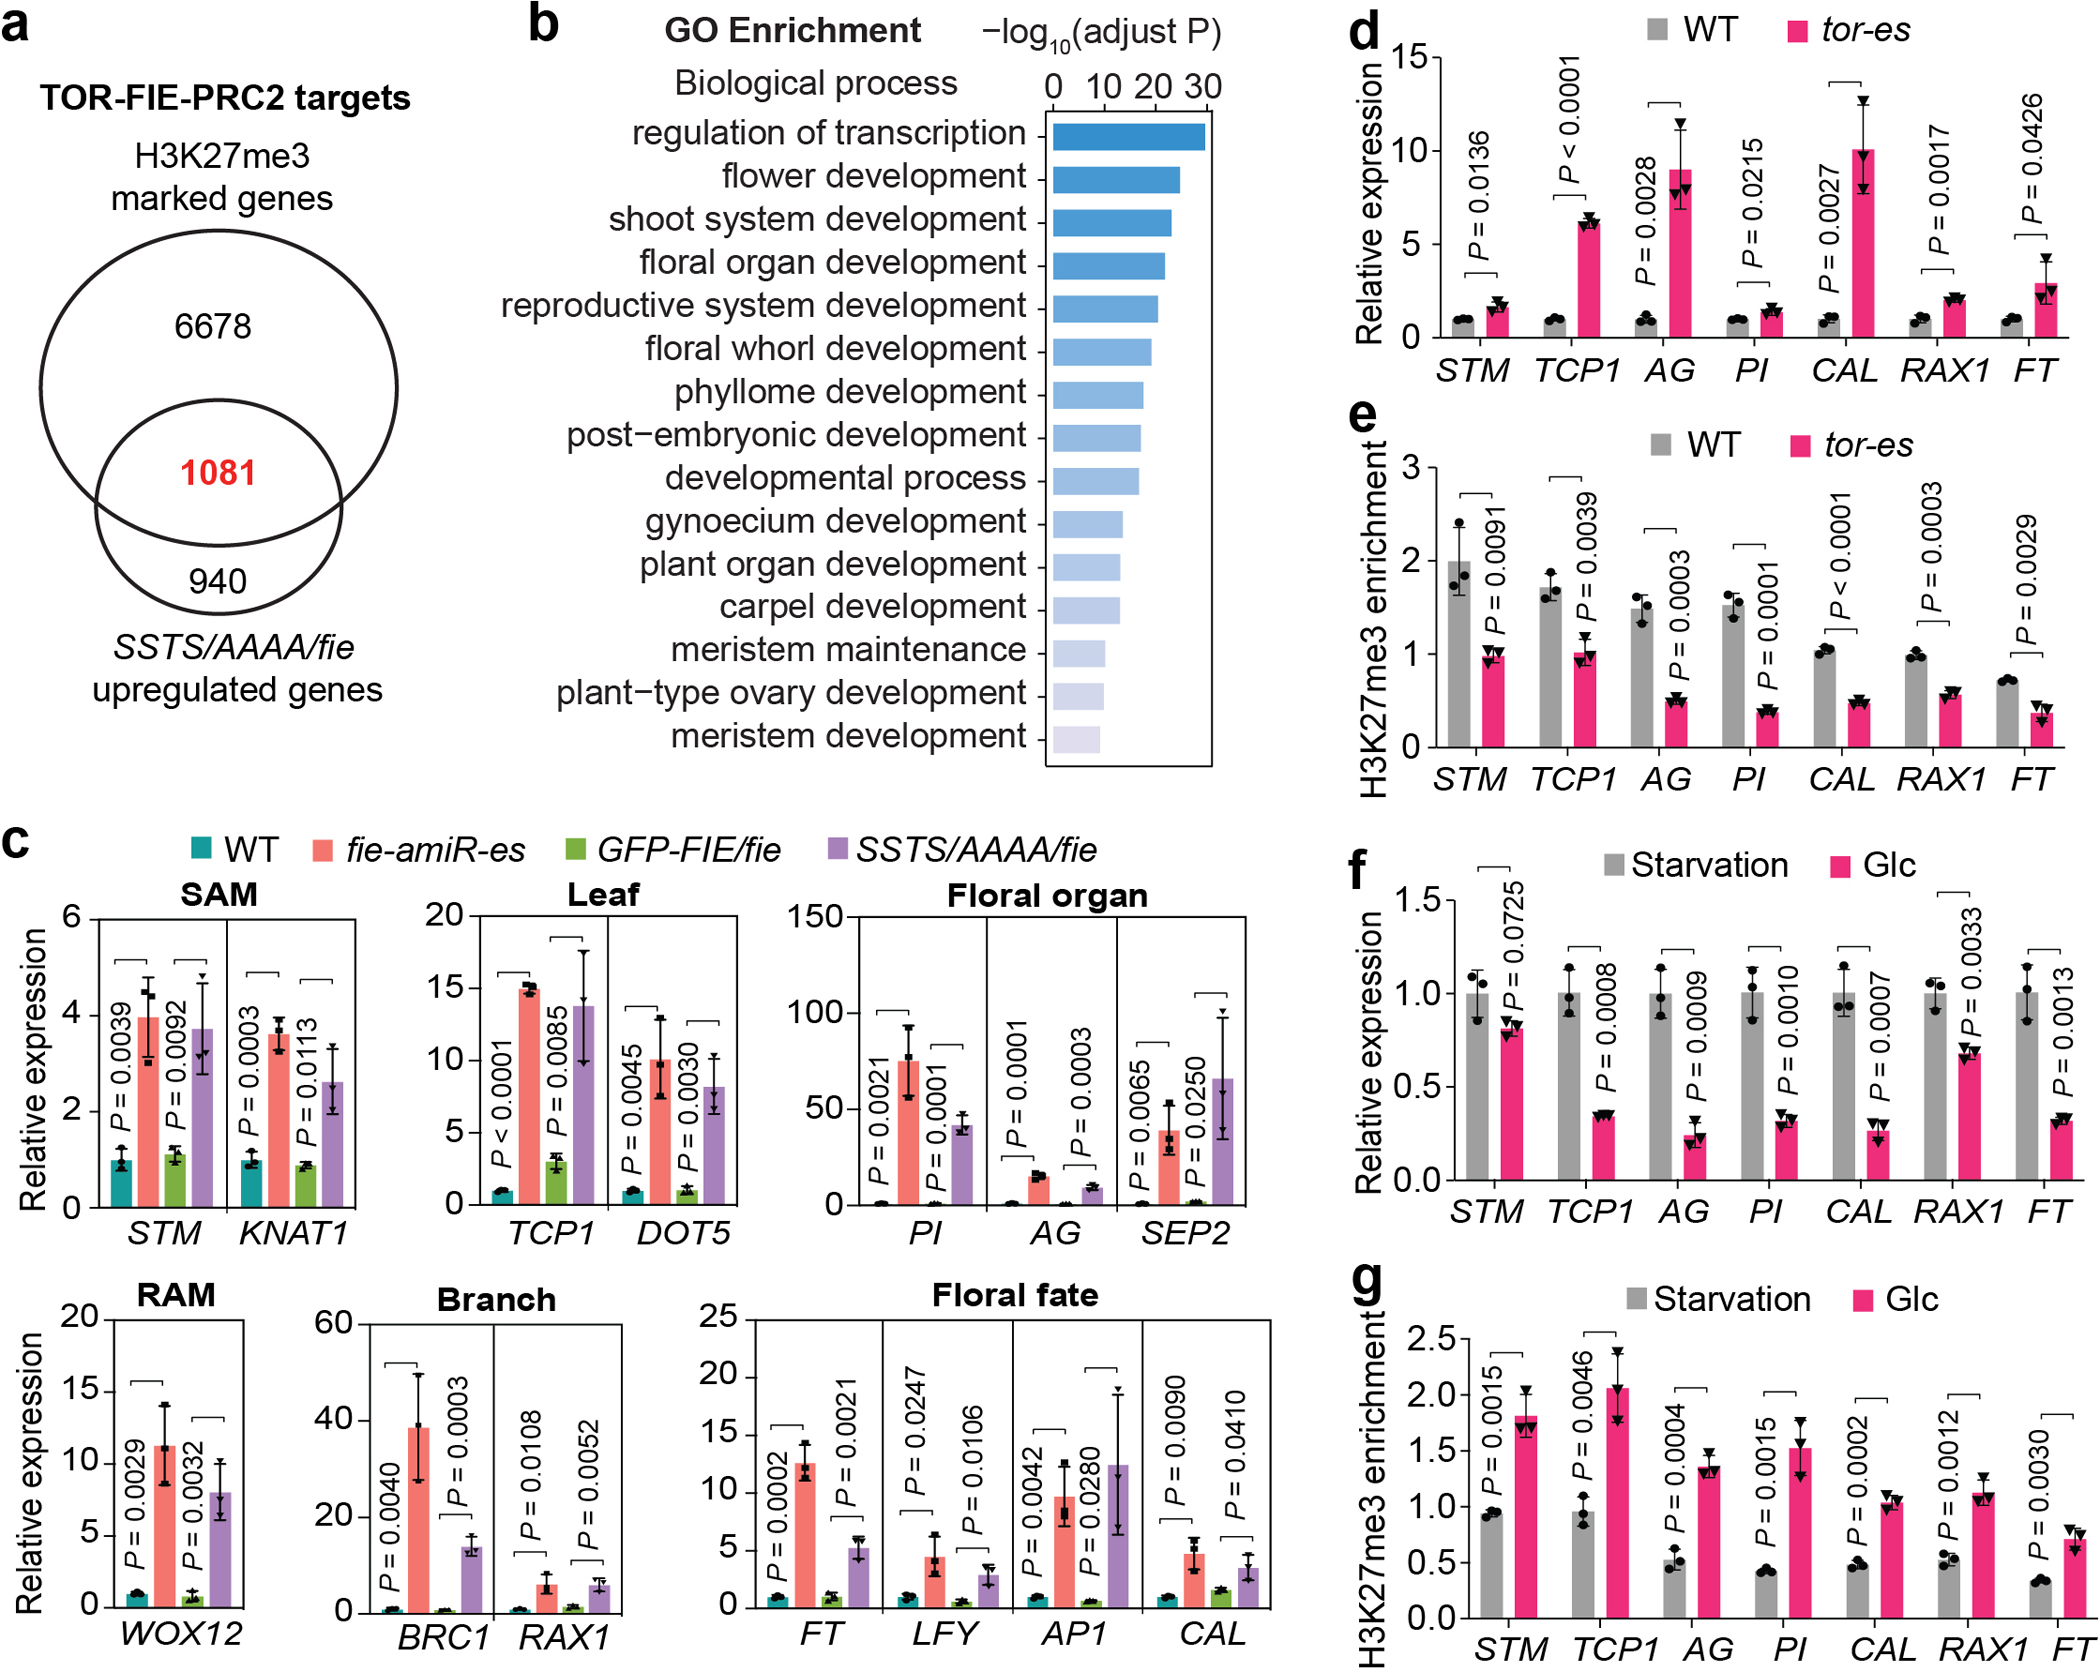
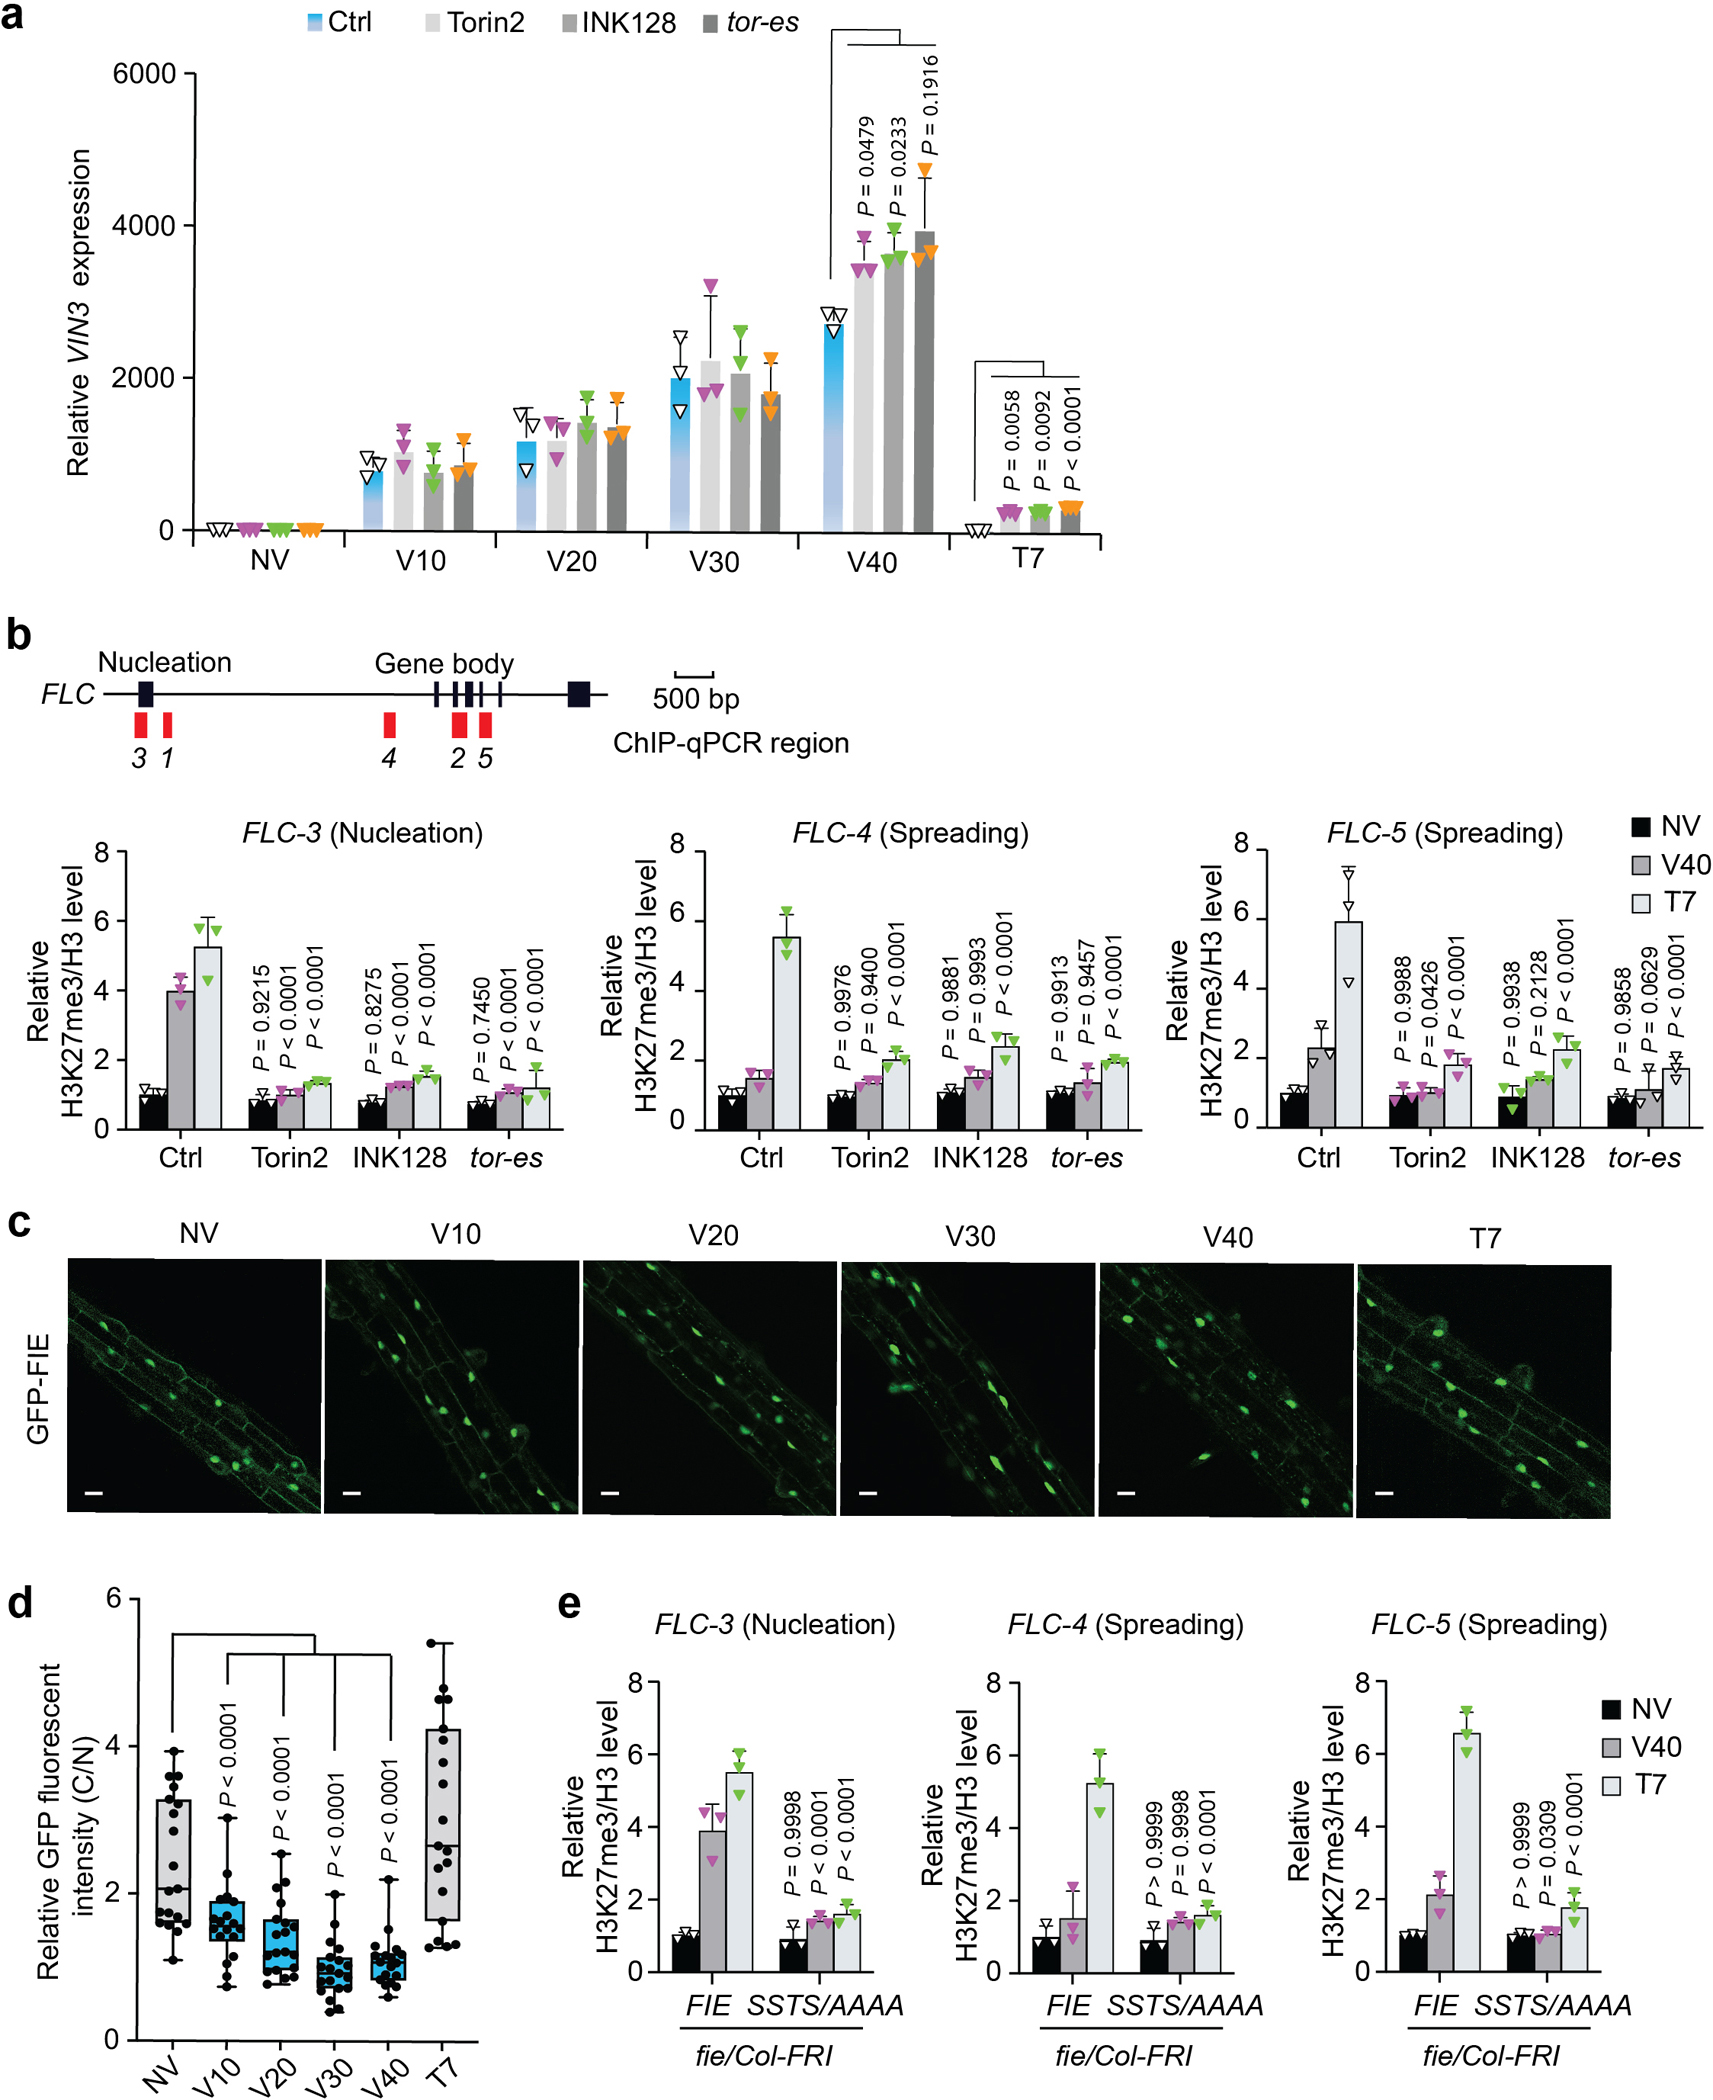
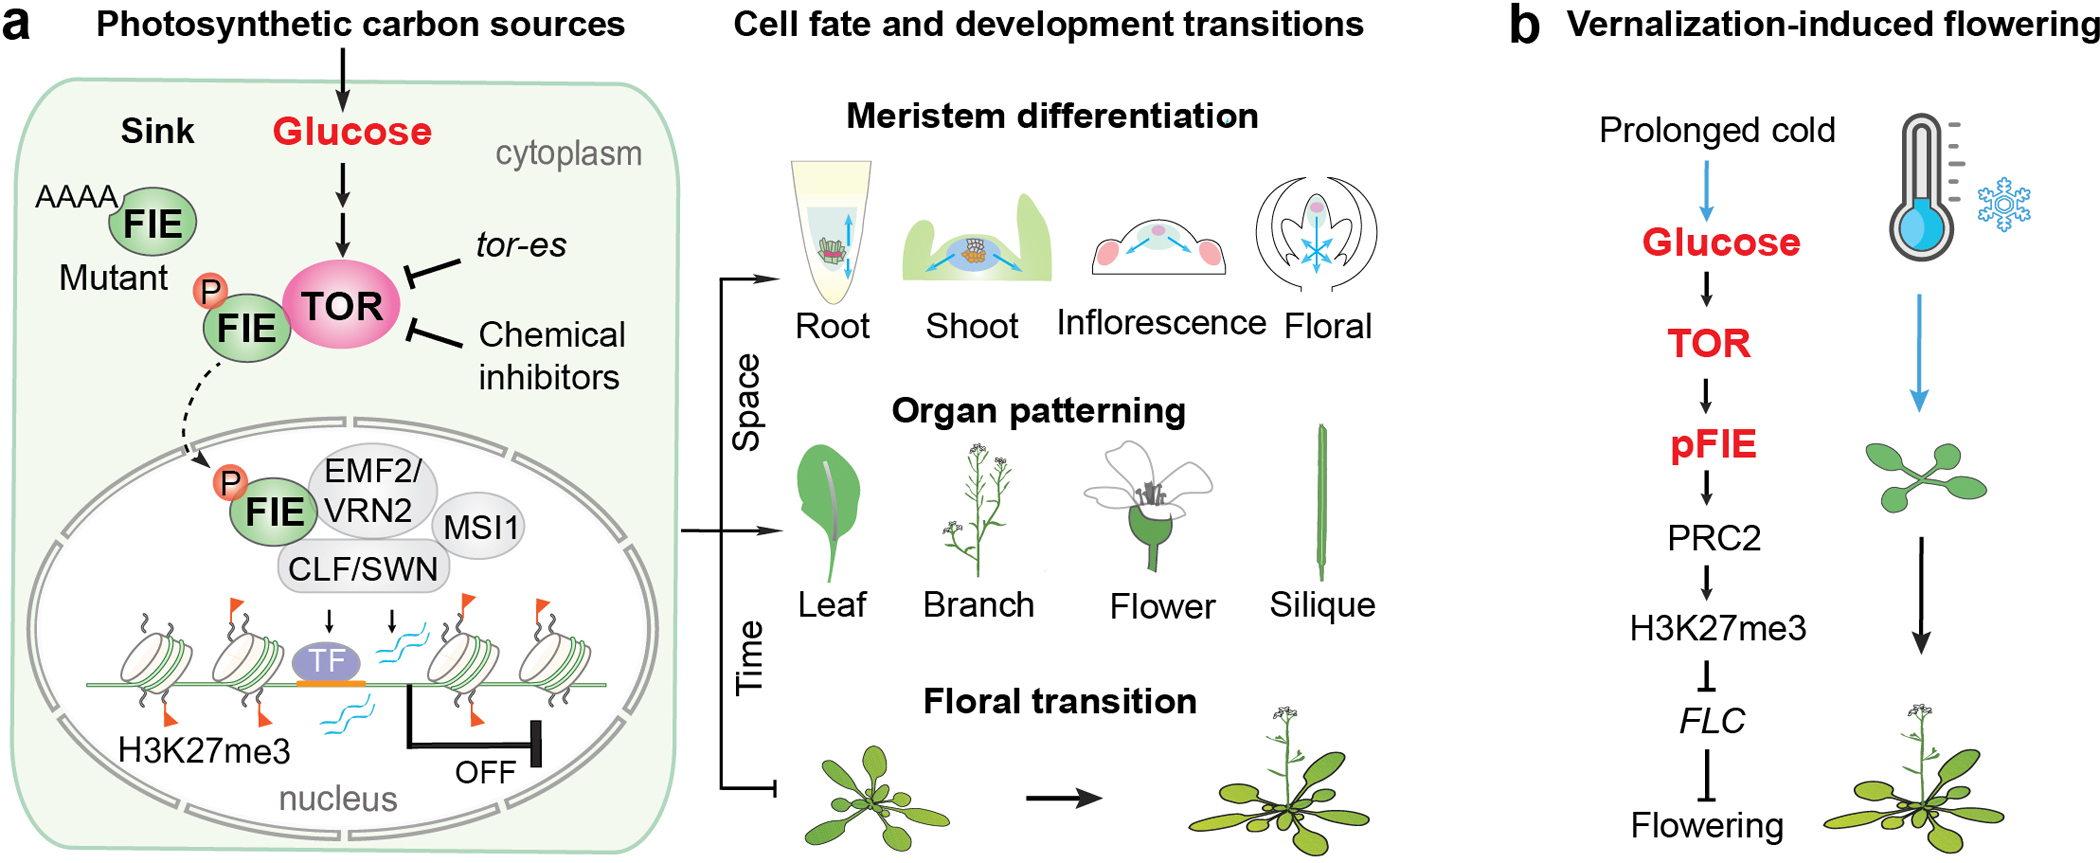
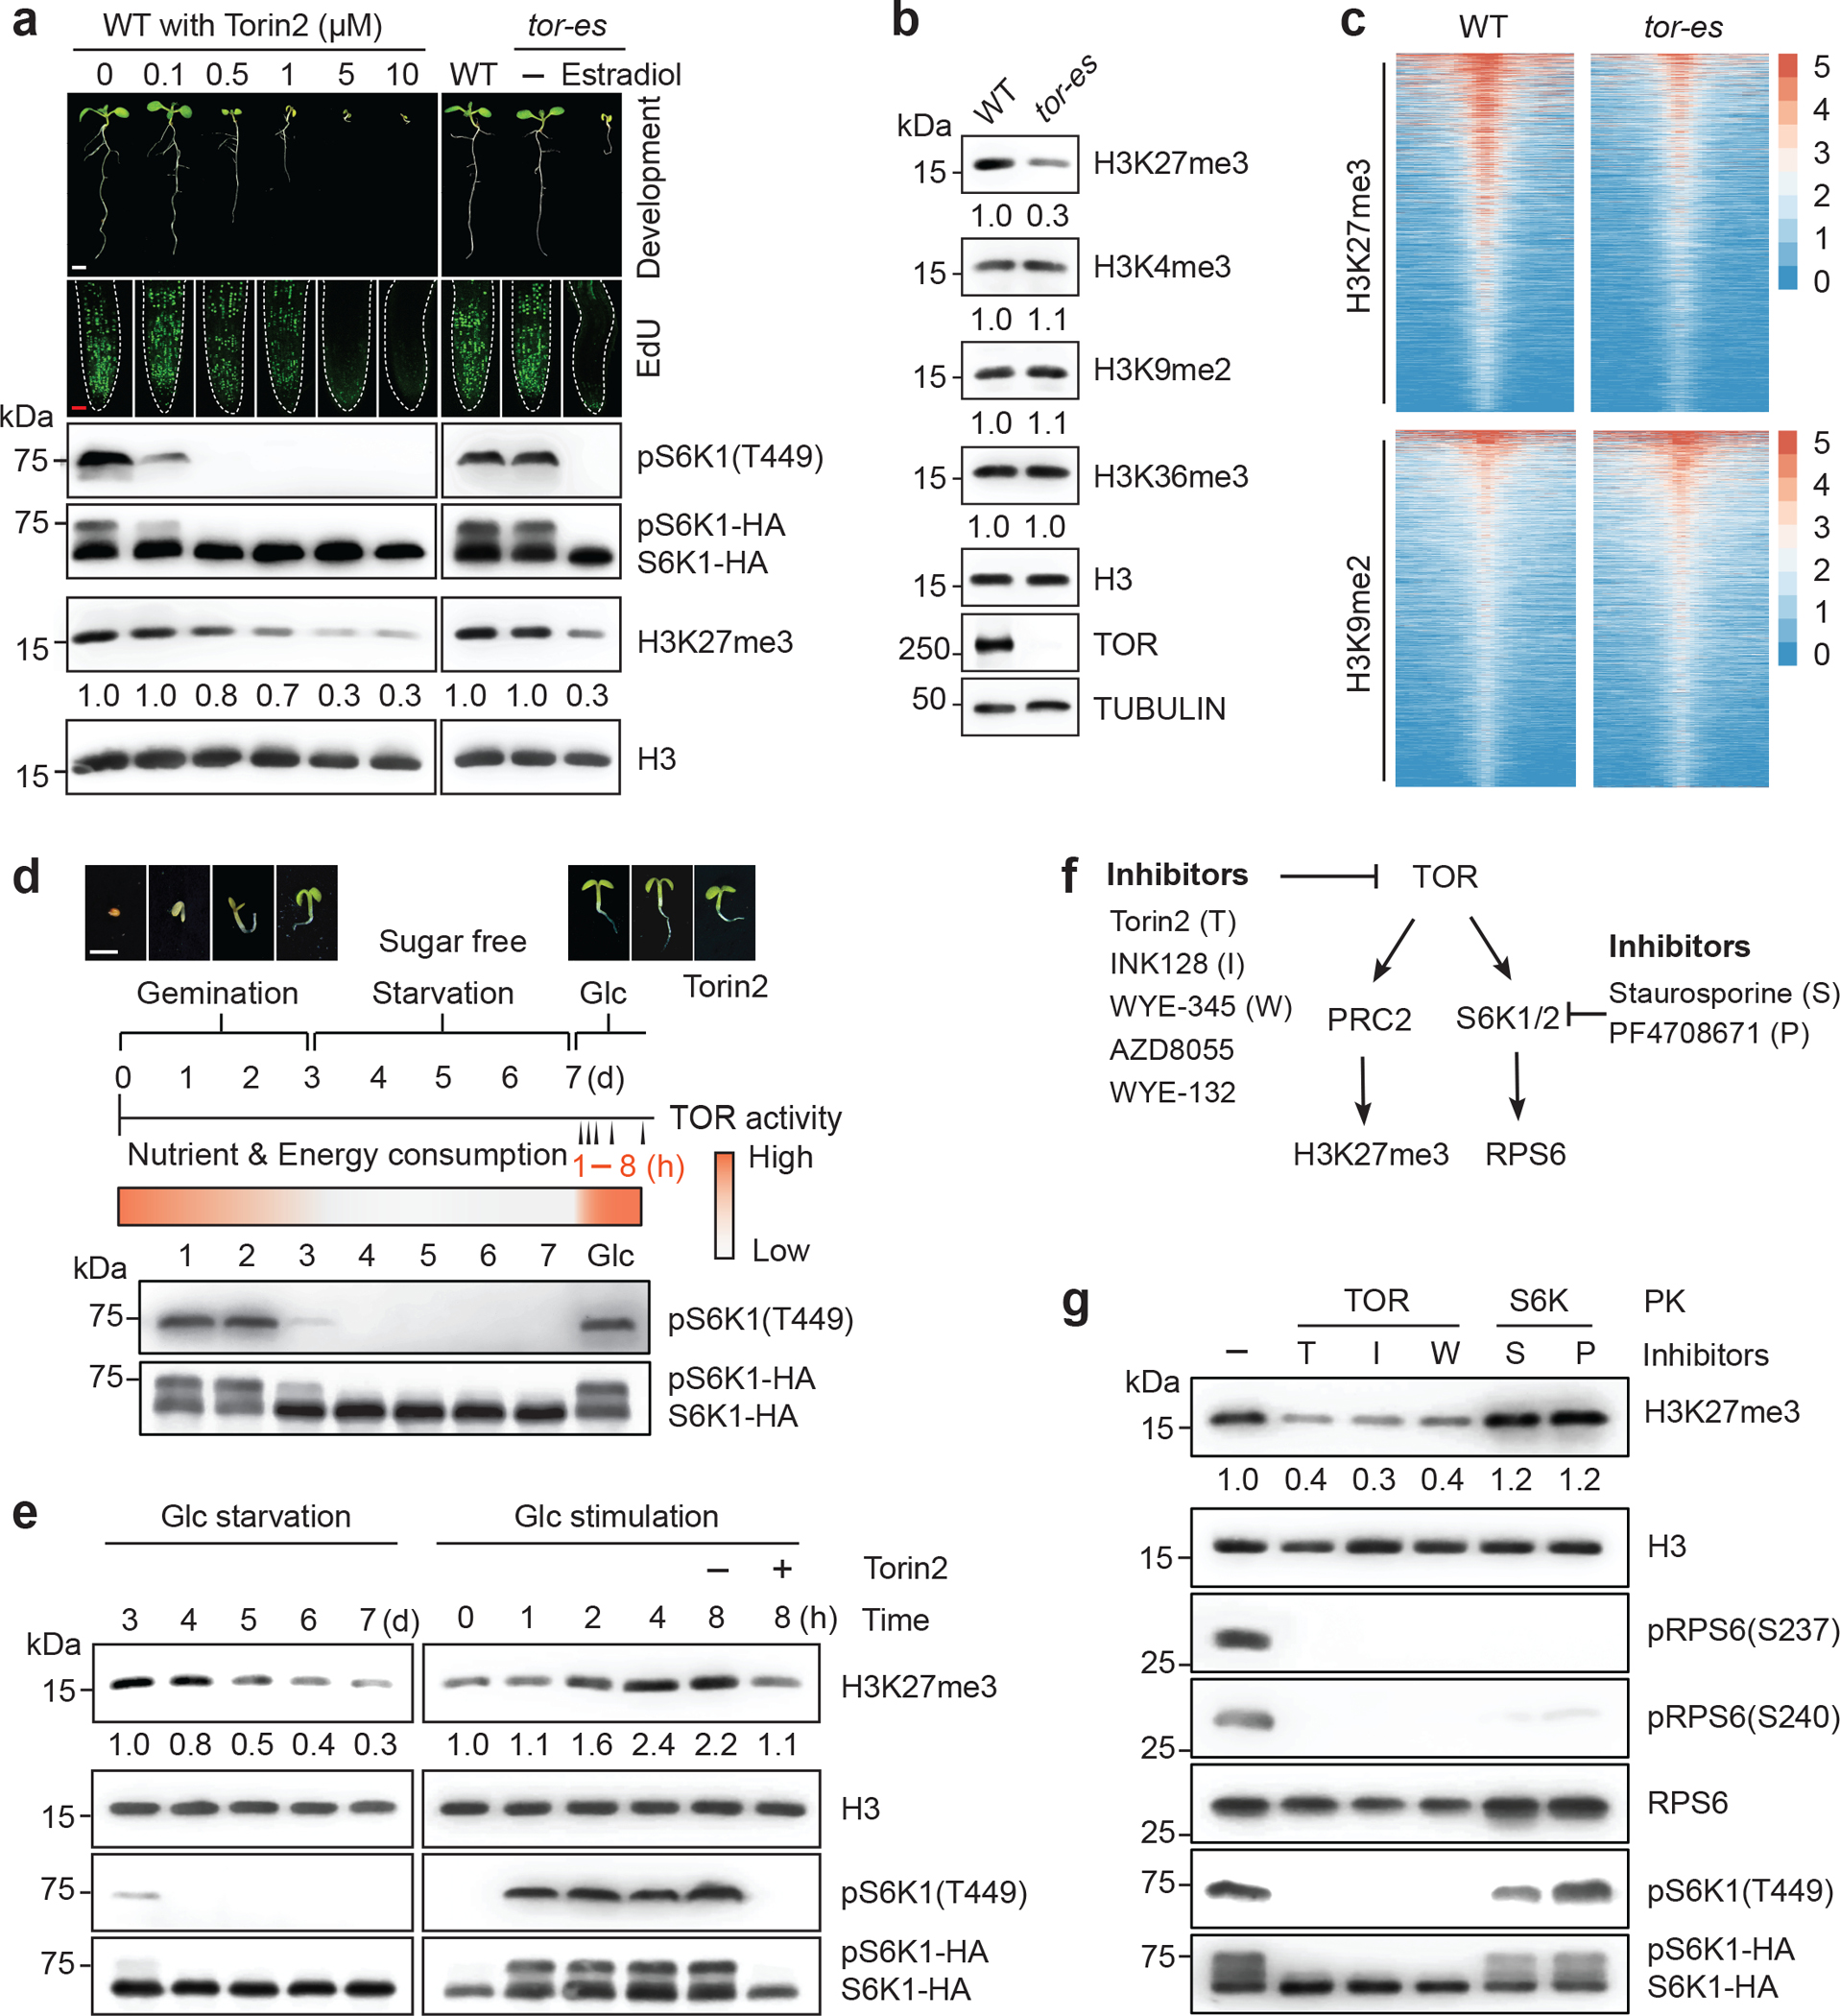
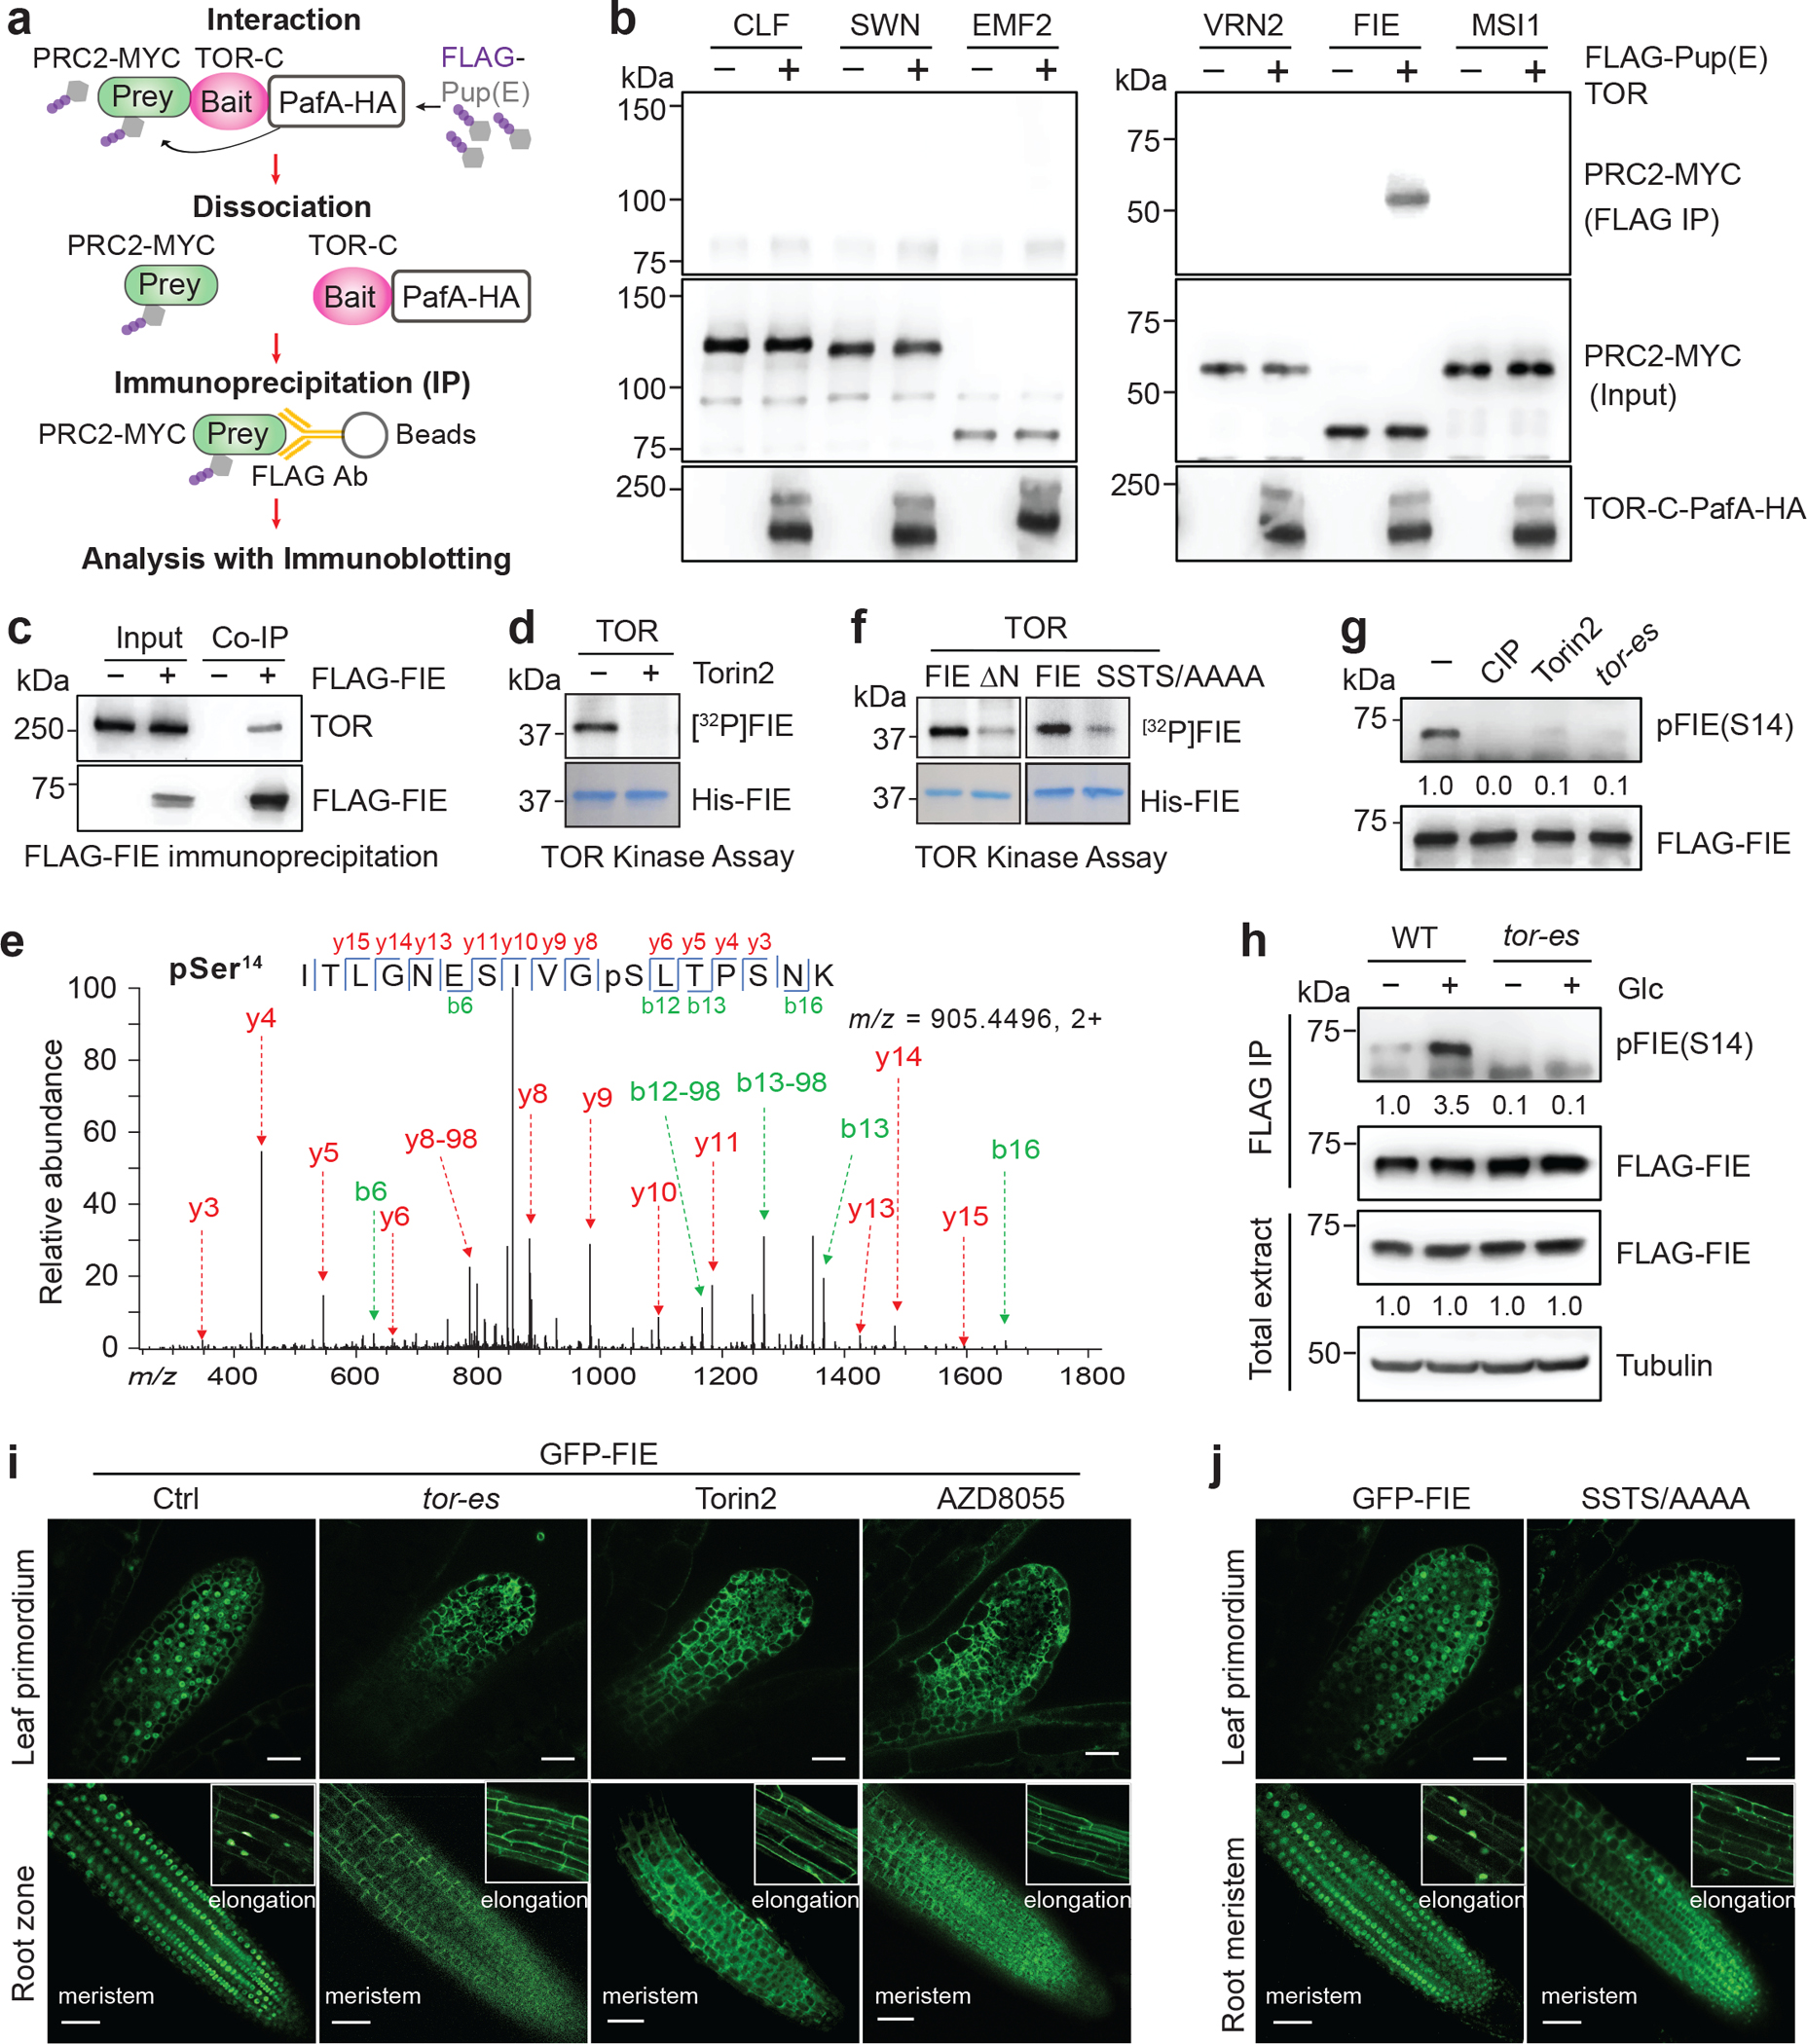
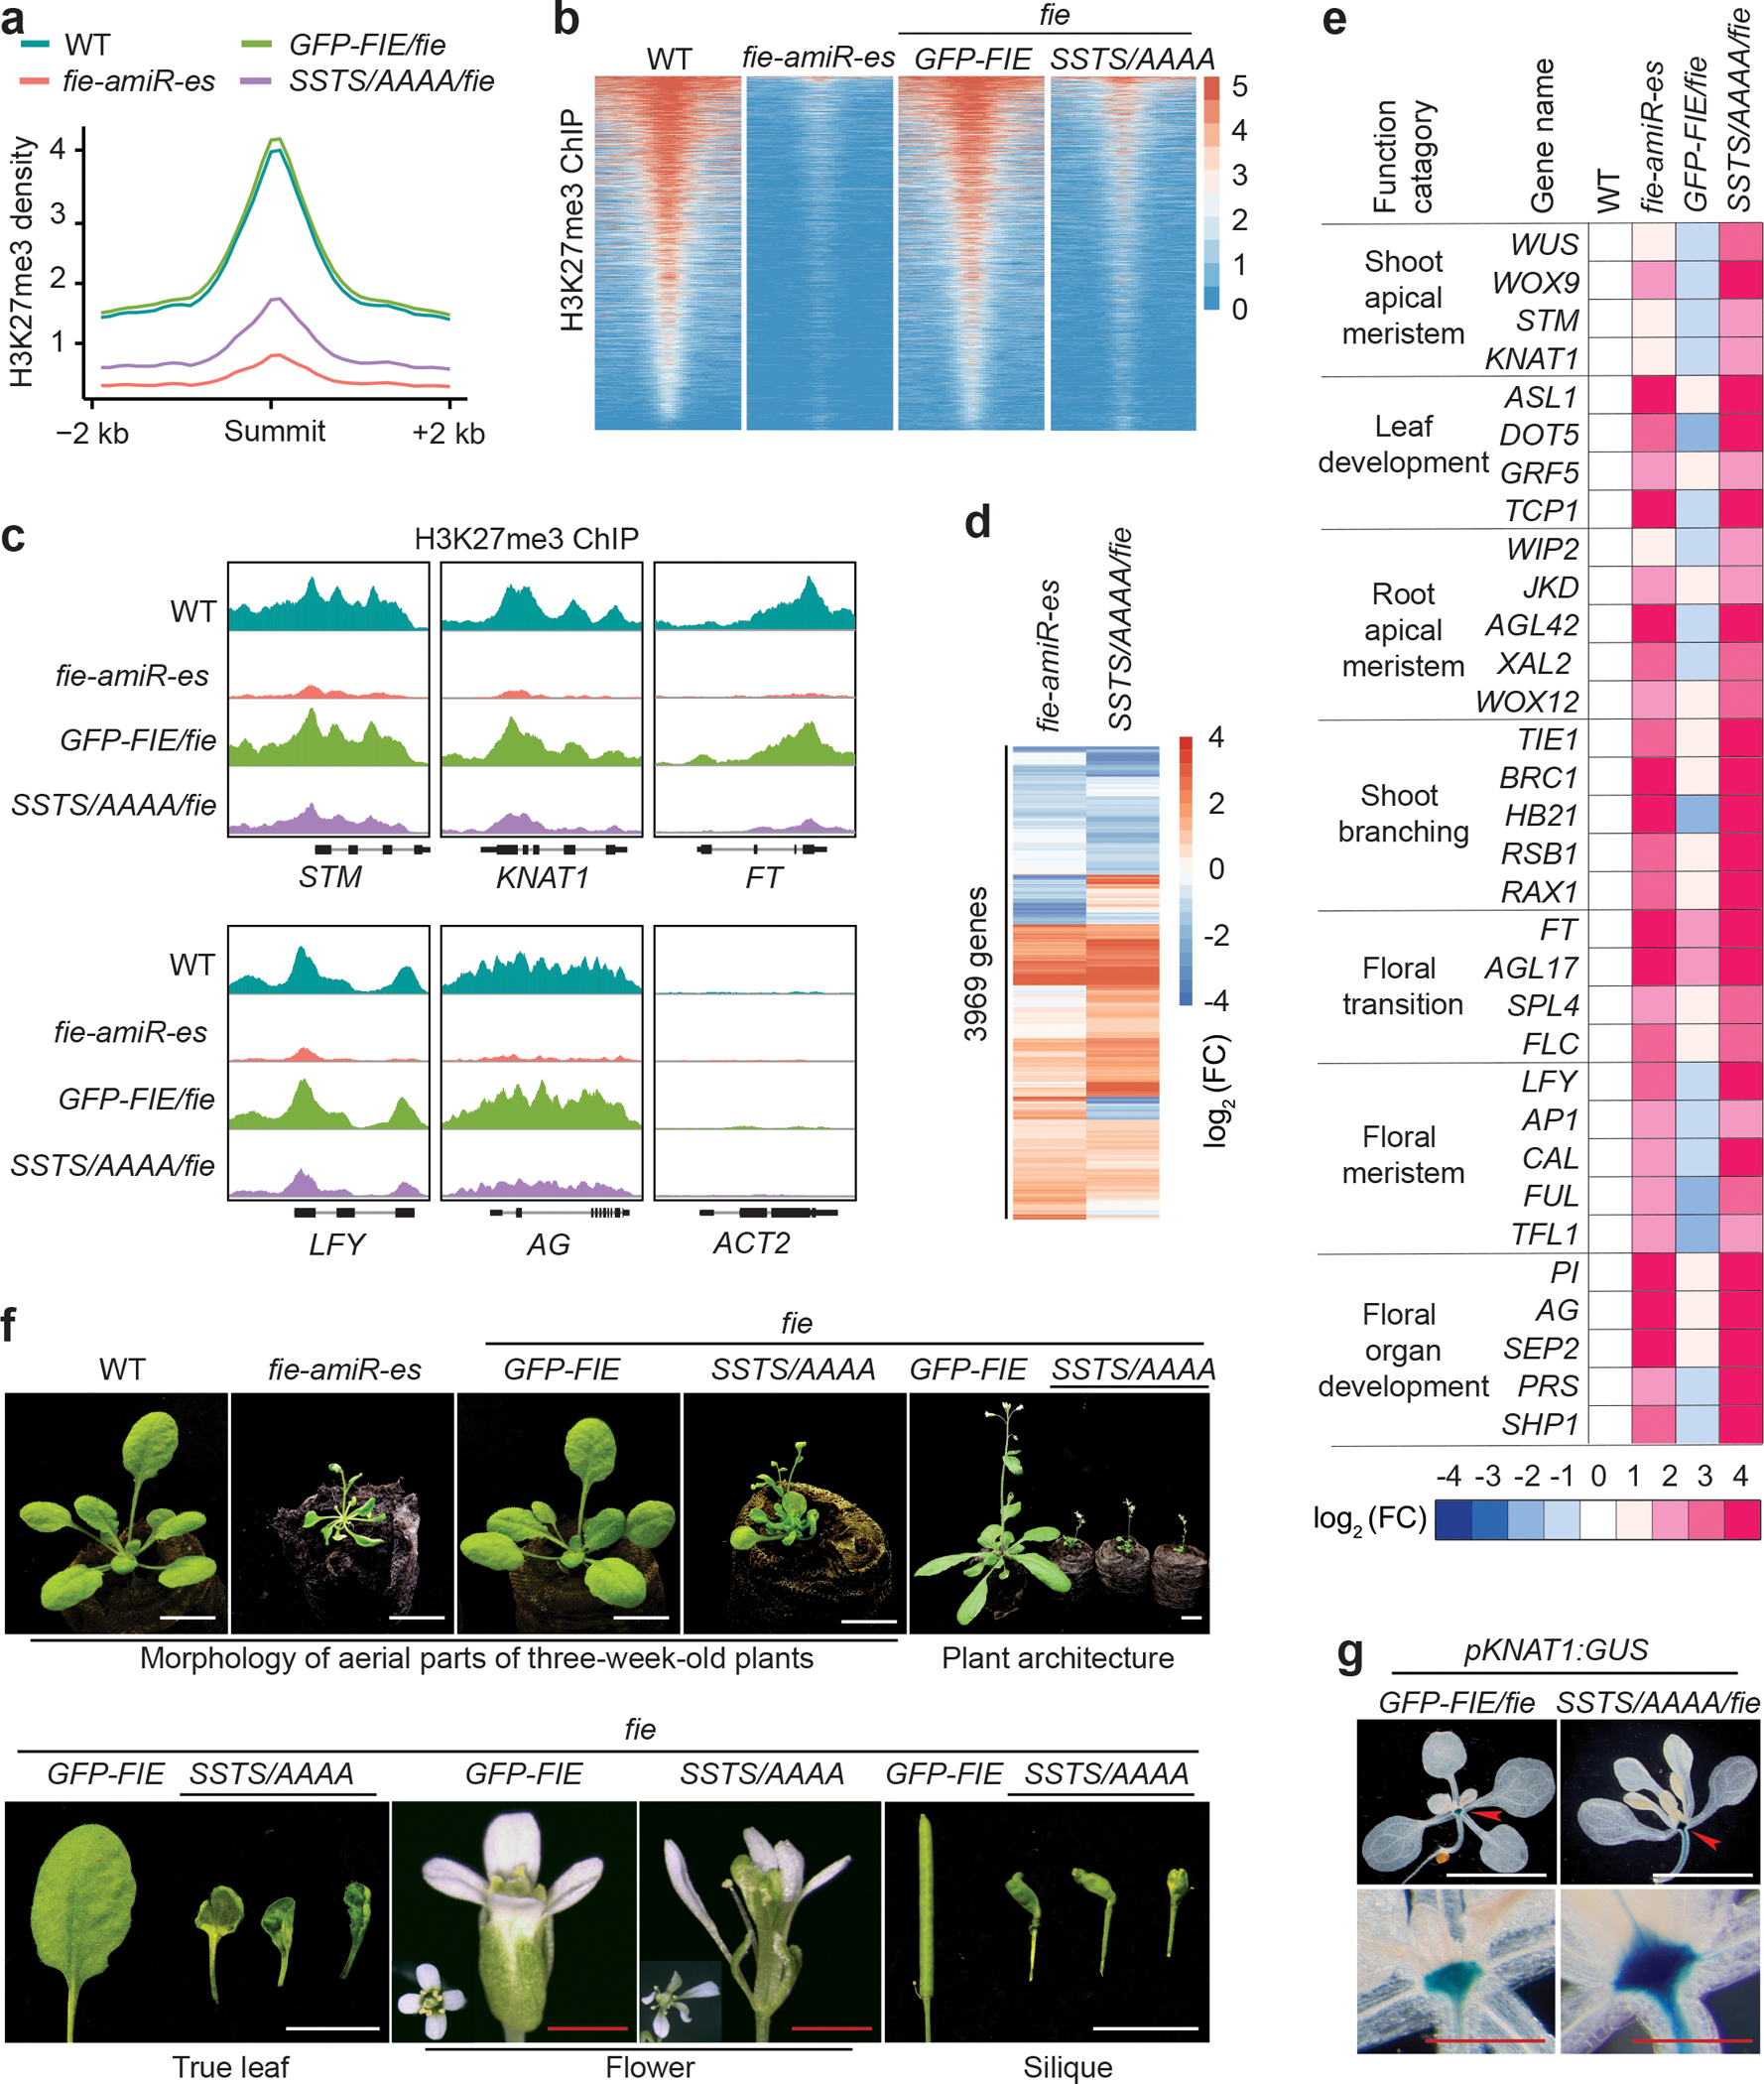
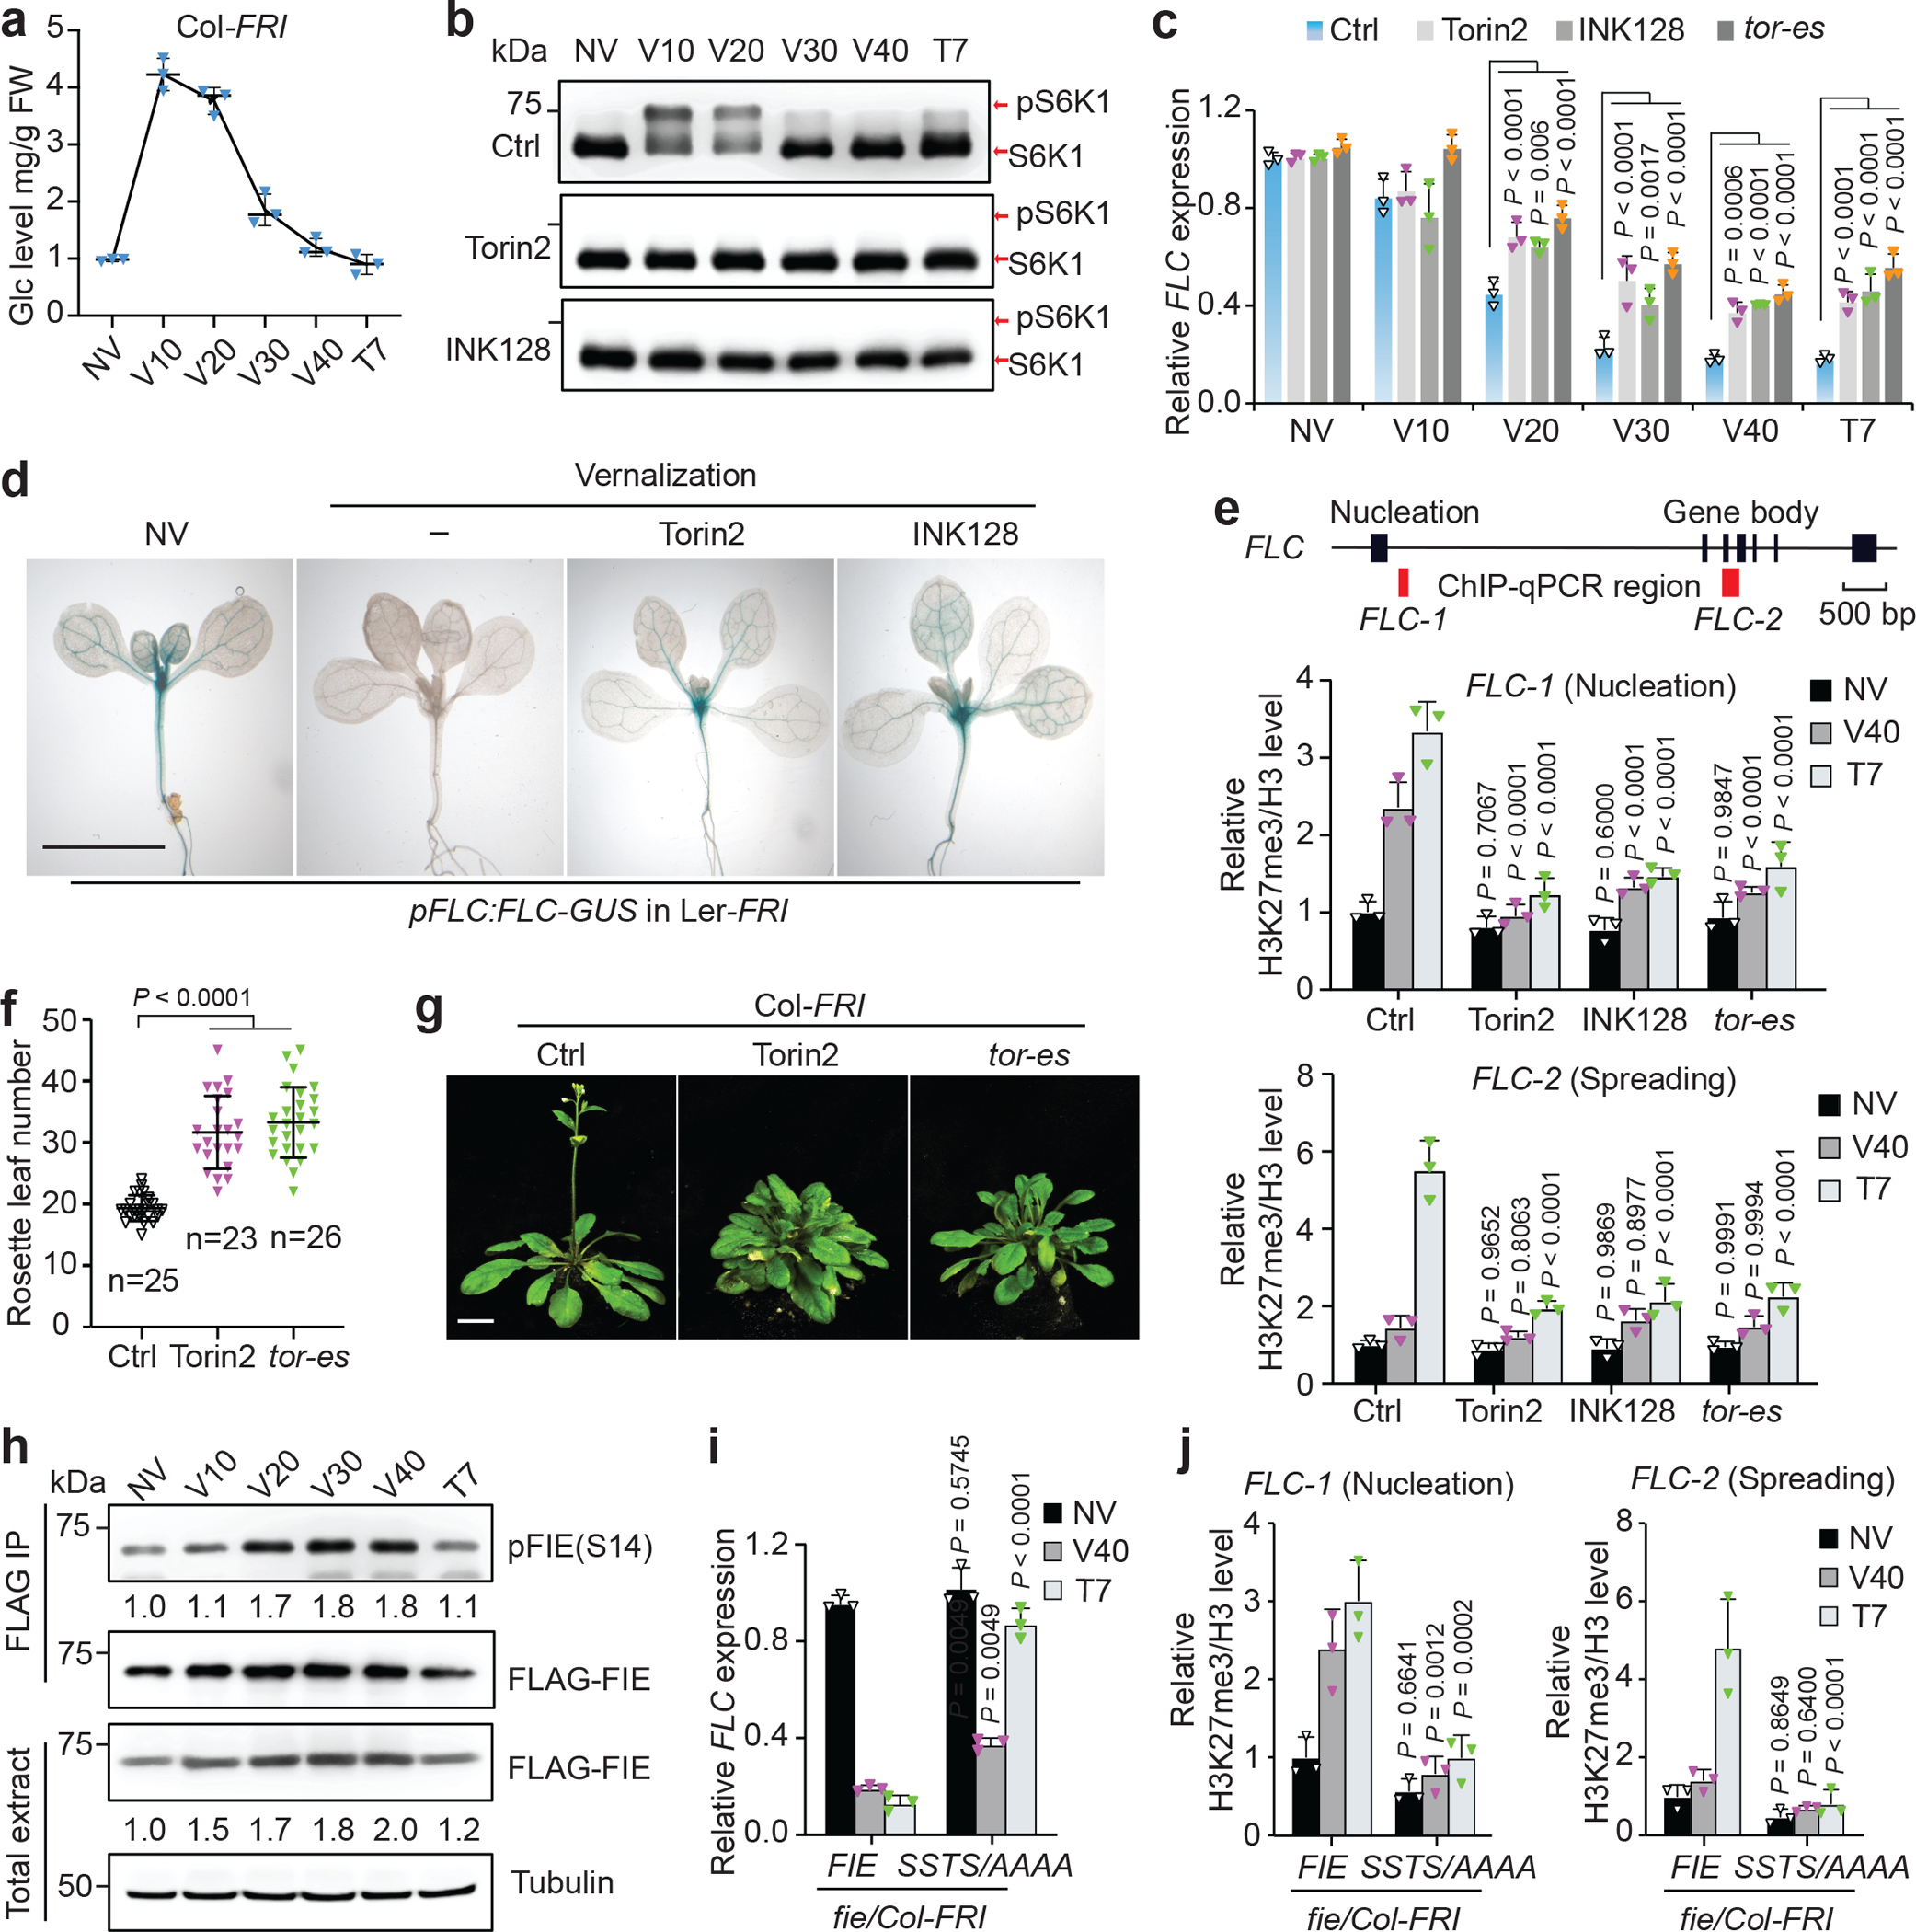
Nutrients and energy have emerged as central modulators of developmental programmes in plants and animals1-3. The evolutionarily conserved target of rapamycin (TOR) kinase is a master integrator of nutrient and energy signalling that controls growth. Despite its key regulatory roles in translation, proliferation, metabolism and autophagy2-5, little is known about how TOR shapes developmental transitions and differentiation. Here we show that glucose-activated TOR kinase controls genome-wide histone H3 trimethylation at K27 (H3K27me3) in Arabidopsis thaliana, which regulates cell fate and development6-10. We identify FERTILIZATION-INDEPENDENT ENDOSPERM (FIE), an indispensable component of Polycomb repressive complex 2 (PRC2), which catalyses H3K27me3 (refs. 6-8,10-12), as a TOR target. Direct phosphorylation by TOR promotes the dynamic translocation of FIE from the cytoplasm to the nucleus. Mutation of the phosphorylation site on FIE abrogates the global H3K27me3 landscape, reprogrammes the transcriptome and disrupts organogenesis in plants. Moreover, glucose-TOR-FIE-PRC2 signalling modulates vernalization-induced floral transition. We propose that this signalling axis serves as a nutritional checkpoint leading to epigenetic silencing of key transcription factor genes that specify stem cell destiny in shoot and root meristems and control leaf, flower and silique patterning, branching and vegetative-to-reproduction transition. Our findings reveal a fundamental mechanism of nutrient signalling in direct epigenome reprogramming, with broad relevance for the developmental control of multicellular organisms.


Conflict of interest statement

Competing interests The authors declare no competing interests.

Figures

Extended Data Fig. 1 |
Extended Data Fig. 1 |. TOR controls the global H3K27me3 level and development.
a, TOR differentially regulates seedling biomass. WT seedlings treated with different concentrations of Torin2 or tor-es seedlings at 8 days after germination. (n = 6 seedlings). b, Distinct TOR activity thresholds regulate DNA replication. Quantification of EdU staining in roots (n = 5 seedlings). c, Metaplots showing ChIP-Rx-seq read density. H3K27me3 and H3K9me2 in 7-day WT and tor-es. The ChIP-seq data are normalized with an exogenous reference genome. The peak summits ±2 kb is shown. d, Genome browser view of H3K27me3 and H3K9me2 ChIP-seq read densities in WT and tor-es. The Arabidopsis genome region within Chr3:15900000..17800000 is shown. An enlarged view of a selected region is shown on the top. e, The H3K27me3 level in plants grown in sugar-containing medium. d, day. Values are the relative level of H3K27me3 compared with the corresponding H3 control, with immunoblot signals in day3 set as 1.0. Experiments were conducted in three biological repeats with similar results. Data in a, b show mean ± s.d., one-way ANOVA with Tukey’s multiple comparisons test.
Extended Data Fig. 2 |
Extended Data Fig. 2 |. TOR controls the global H3K27me3 level.
a-d, TOR regulates global H3K27me3 levels. a, TOR but not S6K regulates global H3K27me3 levels. WT or S6K1-HA transgenic seedlings were treated with 10 μM of different inhibitors for 3 days. At 7 days, TOR activity was monitored by pS6K1(T449) and the band shift of pS6K1-HA. S6K activity was monitored by pRPS6(S237) and pRPS6(S240). The intensity of each immunoblot was quantified by ImageJ. Values are the relative level of H3K27me3 compared with the corresponding H3 control, with immunoblots in mock set as 1.0. b, Heatmap of H3K27me3 enrichment in plants with or without TOR inhibitor treatment. The colour scale indicates reference-adjusted RPM (RRPM) surrounding peak summit from the ChIP-Rx-seq data. c, Metaplots showing H3K27me3 ChIP-Rx-seq read density in plants with or without TOR inhibitor treatment. The ChIP-seq data are normalized with an exogenous reference genome. The peak summits ±2 kb is shown. d, Genome browser view of H3K27me3 ChIP-seq read densities. The Arabidopsis genome region within Chr3:15800000..18000000 is shown. e, Differential regulation of S6K and H3K27me3 in rap1 and lst8–1 mutants. The restoration of H3K27me3 was induced by 25 mM glucose for 6 h in 7-d sugar-starved seedlings. TOR-S6K activity was monitored by pRPS6(S237) and pRPS6(S240). The intensity of each immunoblot was quantified by ImageJ. Values for H3K27me3 are the relative level of H3K27me3 compared with the corresponding H3 control, with immunoblots in WT before glucose stimulation set as 1.0. Values for RPS6 phosphorylation are the relative level of pRPS6(S237) and pRPS6(S240) compared with the corresponding RPS6 control, with immunoblots in WT after glucose stimulation set as 1.0. Data in a and e are representatives of three biological replicates each.
Extended Data Fig. 3 |
Extended Data Fig. 3 |. The transcript and protein levels of PRC2 components are not regulated by TOR.
a, Evolutionarily conserved core PRC2 subunits in Arabidopsis, Drosophila and mammals. PRC2 components regulating plant postembryonic development are shown. b, RT-qPCR analysis of genes encoding PRC2 components in 7-day WT and tor-es. ACT2 transcripts served as an internal control for normalization. Data show mean ± s.d. from 4 biological replicates. Data were analysed by unpaired two-sided Student’s t test. c, GFP-tagged PRC2 components are not regulated by TOR. Torin2 (10 μM) was added for 24 h in 7-d seedlings. Tubulin was used for the loading control for the immunoblot analyses. Experiments were conducted in three biological repeats with similar results.
Extended Data Fig. 4 |
Extended Data Fig. 4 |. TOR directly interacts with and phosphorylates FIE.
a, Glucose enhances the interaction between TOR and FIE in vivo. Coimmunoprecipitation (Co-IP) of FLAG-tagged FIE with TOR from starved (7 d) and glucose stimulated (2 h) plants. Glc, Glucose. b, Summary of the TOR phosphorylation sites of FIE identified by LC-MS/MS analysis. The corresponding phosphopeptides and its covered regions are listed. Expected, the expect value indicates the probability that the peptide is matched by chance. Smaller value indicates more significance of the peptide identification. Score, the score value represents a calculation of how well the observed spectrum fits to the identified peptide. Higher value indicates higher confidence of the peptide identification. No. of matches, the total number of matched peptides with the same modifications and sites from three biological repeats. Validated in vivo, the modified peptides were identified from in vivo FLAG-FIE immunoprecipitation. c, Mass spectrometric analysis of pS10 peptide from in vitro TOR kinase assay. d, Mass spectrometric analysis of pS14 peptide from in vitro TOR kinase assay. e, Mass spectrometric analysis of pT16 peptide from in vitro TOR kinase assay. f, Mass spectrometric analysis of pS18 peptide from in vivo FLAG-FIE immunoprecipitation. g, The predicted FIE structure. The N-terminal 34 aa sequence is shown with phosphorylation sites (red) identified by mass spectrometry and the basic residues (blue). The predicted 3D structure of FIE by modelling is shown with the flexible N-terminal domain highlighted in green (right). h, TOR phosphorylation of FIE variants by in vitro kinase assays. Single or quadruple mutants of FIE protein was used as the substrate. Phosphorylation of His-FIE by TOR is shown with autoradiography (top). Protein loading control is shown by Coomassie blue staining (bottom). Experiments were conducted in three biological repeats with similar results.
Extended Data Fig. 5 |
Extended Data Fig. 5 |. Conservation of the key TOR phosphorylation sites in plant FIE and animal orthologs.
a, Phosphosite conservation was analysed by multiple sequence alignment of FIE proteins from reference organisms using PLAZA 4.0 Dicots (https://bioinformatics.psb.ugent.be/plaza/versions/plaza_v4_dicots/). The selection of reference organisms includes Arabidopsis, Brassica, soybean, rice, maize and wheat. The four arrow heads indicate the potential phosphorylation residues. b, N-terminal sequences of Drosophila ESC (residues 1–60) and human EED (residues 21–80) are shown. Highly conserved positions of S/T-rich and basic regions are indicated. c, Immunoblot validation of pFIE(S14) specific antibody using the in vitro TOR-FIE kinase assay. d, Glucose enhances pFIE(S14) levels. Immunoblot analysis of pFIE(S14) after IP with anti-FLAG in starved (7 d) transgenic FLAG-GFP-FIE seedlings and stimulated by different concentrations of glucose for 2 h. e, GFP-FIE protein levels are not regulated in tor-es or Torin2 treated 7-d seedlings. A specific TOR antibody was used to detect endogenous TOR by immunoblot analysis. Tubulin served as the loading control. Values are the relative level of GFP-FIE over Tubulin, with blots in mock treatment set as 1.0. f, In vitro histone methyltransferase assays using H3 substrate and recombinant Arabidopsis PRC2 complexes from insect Sf9 cells. The complexes stained by Coomassie blue were purified with FLAG-tagged WT or the mutant form (SSTS/AAAA) of FIE. The * indicates a nonspecific protein from insect cells. The H3K27me3 was detected by immunoblot and quantified by comparing to the corresponding H3 control.
Extended Data Fig. 6 |
Extended Data Fig. 6 |. Glucose-TOR specifically promotes the cytoplasm-to-nucleus translocation of FIE to enhance the PRC2 activity in the nucleus.
a, A proposed model for the cytoplasm-to-nucleus translocation of FIE regulated by TOR. FIE mainly localizes in the cytoplasm at low TOR activity and its phosphorylation by glucose-activated TOR stimulates its nuclear entry to enhance PRC2 activity. Blocking TOR activity or mutation of the phosphorylation sites inhibited the nuclear translocation of FIE. b, Quantitative confocal imaging of GFP-FIE and GFP-FIE(SSTS/AAAA) in leaf primordia and roots. The cytoplasm/nucleus (C/N) signal intensity ratio of GFP-FIE or GFP-FIE(SSTS/AAAA) at the single-cell level was measured by quantitative confocal imaging using the Leica LAS-X software. WT seedlings (5 d) expressing GFP-FIE without (Ctrl) or with 10 μM of Torin2 or AZD treatment (24 h) or tor-es (10 μM estradiol for 3 d) were examined. Root elongation zone and root meristem zone are illustrated. c, Confocal images of GFP-tagged PRC2 components in the meristem zone of roots. Plants were imaged with or without (Mock) Torin2 treatment. d, Confocal images of GFP-tagged FIE and mutants in protoplasts. BF, bright field. NLS–mC denotes nuclear HY5–mCherry as a control for protoplasts co-transfection and nuclear localization. Scale bars, 10 μm. Images are representative of 10 protoplasts from three biological repeats. e, Immunoblot analysis of GFP-tagged FIE variants expressed in protoplast and transgenic plants. Tubulin was used for the loading control. Data are representatives of three biological replicates. f, g, The dynamics of GFP-FIE during glucose starvation. f, Confocal images of GFP-FIE from 2–6 d in the root elongation zone in glucose-free medium. g, Quantitative confocal imaging of GFP-FIE C/N ratio. h, i, j, Glucose stimulates dynamic nuclear translocation of GFP-FIE after starvation in the root elongation zones. h, Confocal images of GFP-FIE without or with 25 mM glucose stimulation for 6 h in starved seedlings (5 d). i, Quantitative confocal imaging of GFP-FIE C/N ratio. j, Time-lapse live imaging of glucose stimulated nuclear translocation of GFP-FIE in the root elongation zone. Representative images were taken from Supplementary movie at 1–4 h time points after 25 mM glucose stimulation. The experiment was repeated three times with similar results. b, f, i, In the boxplots, data were analysed from more than 15 cells from three experiments, and are expressed as mean ± s.d. Centre line, median; box limits, 25th and 75th percentiles; the whiskers indicate data’s minimum and maximum; the points represent each individual value. Statistical significance was determined by unpaired two-sided Student’s t test. c, g, h, j, Images are representative of six seedlings from three biological repeats. Scale bar, 25 μm.
Extended Data Fig. 7 |
Extended Data Fig. 7 |. Generation and characterization of estradiol-inducible fie-amiR-es and SSTS/AAAA/fie mutants.
a, Screening of optimal amiRNA in the protoplast system. Empty amiRNA expression vector as a control (Ctrl) or each of the eight amiRNA candidate plasmids was co-transfected with a heat shock promoter-driven FIE-FLAG plasmid. The HBT-GFP-HA plasmid serves as an internal control for all co-transfection experiments. Immunoblot analysis indicated similar GFP-HA protein levels. The most potent amiRNA4 abolished FIE-FLAG expression and was chosen to generate estradiol-inducible fie-amiR-es transgenic plants. b, RT-qPCR analysis of FIE transcripts in 14-day transgenic fie-amiR-es lines without or with 10 μM of estradiol treatment. UBQ10 transcripts served as an internal control for normalization. Data show mean ± s.d. from 3 biological replicates. Data were analysed by unpaired two-sided Student’s t test. c, Protein blot analysis of FIE protein levels in 14-day transgenic fie-amiR-es lines. Three independent fie-amiR-es lines were crossed to the FLAG-GFP-FIE transgenic plant. The FLAG-GFP-FIE protein was eliminated with 10 μM of estradiol treatment. Tubulin was used for the loading control. d, The development phenotype of the fie-amiR-es lines was similar to that of the SSTS/AAAA/fie mutant. Three independent fie-amiR-es lines and the SSTS/AAAA/fie mutant showed small, narrow and curled leaves. The GFP-FIE/fie plant showed normal development. Scale bar, 10 mm. Experiments were conducted in three biological repeats with similar results. e, The H3K27me3 level was greatly decreased in 14-day fie mutant plants. Values are the relative level of H3K27me3 compared with the corresponding H3 control, with immunoblot signals in WT set as 1.0. f, Genome browser view of H3K27me3 ChIP-seq read densities. The Arabidopsis genome region within Chr3:15800000..18000000 is shown. g, Venn diagram of H3K27me3 target genes in Arabidopsis from three independent genome wide analyses. The H3K27me3 targets in our study cover 79.7% of genes from Zhang et al. and 84.5% of genes from Bouyer et al.. Data in a, c, and e are representatives of three biological replicates each.
Extended Data Fig. 8 |
Extended Data Fig. 8 |. The TOR-FIE-PRC2-TR relay plays a central role in diverse developmental programs.
a, TOR-FIE-PRC2 target genes. These genes are marked by H3K27me3 and upregulated in the SSTS/AAAA/fie mutant. b, Gene Ontology enrichment analysis of TOR-FIE-PRC2 target genes in biological process terms related to transcriptional regulation and development. Fisher’s exact test was used by the BiNGO to identify GO terms that are significantly over-represented with the compiled gene list. FDR, false discovery rate. The categories in biological process with fold enrichment > 2 and FDR< 10−10 were selected and presented. c, PRC2 target genes are transcription regulators upregulated in fie mutants (14d). UBQ10 or ACT2 transcripts served as an internal control for normalization. d, f, RT-qPCR analysis of TOR-FIE-PRC2 target genes in WT and tor-es. (d) In sugar-containing medium or (f) in sugar-free medium and without or with 25 mM glucose stimulation for 6 h after starvation (7 d). UBC21 transcripts served as an internal control for normalization. e, g, ChIP-qPCR analysis of H3K27me3 enrichment on TOR-FIE-PRC2 target genes in 7-day WT and tor-es. (e) in sugar-containing medium or (g) in sugar-free medium and without and with 25 mM glucose stimulation for 6 h after starvation (7 d). ChIP-qPCR data were normalized to percentage of input DNA. c-g, Data show mean ± s.d. from 3 biological replicates. Data were analysed by unpaired two-sided Student’s t test.
Extended Data Fig. 9 |
Extended Data Fig. 9 |. VIN3 expression, H3K27me3 enrichment at FLC, and GFP-FIE nuclear translocation during vernalization.
a, VIN3 Induction by vernalization is not regulated by TOR. Seedlings were treated at 4°C to induce vernalization for the indicated days without (Ctrl) or with TOR inhibitors (1 μM Torin2 and INK128), or in the inducible tor-es mutant. Data are relative to the UBC21 (At5g25760) expression as a control gene and normalized to non-vernalized (NV) levels of ctrl plants. Data show mean ± s.d. from 3 biological replicates, two-way ANOVA with Tukey’s multiple comparisons test. b, TOR deficiency reduces H3K27me3 levels at FLC. Relative H3K27me3/H3 level normalized to that of ctrl plants under non-vernalized (NV) condition as 1. Black boxes, exons. Red boxes, selected regions for H3K27me3 ChIP-qPCR analyses. bp, base pairs. FLC-3 and FLC-4,5 are located in the nucleation and spreading regions of H3K27me3 at FLC, respectively. c, d, Prolonged cold treatment prompts the nuclear localization of GFP-FIE in the elongation zones of roots. c, Confocal images of GFP-FIE during vernalization. Images are representative of six seedlings from three biological repeats. Scale bar, 25 μm. d, Quantitative confocal imaging of GFP-FIE in the root elongation zone. The cytoplasm/nucleus (C/N) signal intensity ratio of GFP-FIE at the single-cell level was measured by quantitative confocal imaging using the Leica LAS-X software. In the boxplot, data were analysed from more than 15 cells from three experiments, and are expressed as mean ± s.d. Centre line, median; box limits, 25th and 75th percentiles; the whiskers indicate data’s minimum and maximum; the points represent each individual value. Statistical significance was determined by unpaired two-sided Student’s t test. e, Vernalization induced H3K27me3 levels at FLC are compromised in AAAA/fie-FRI. Relative H3K27me3/H3 level was normalized to that of fie/Col-FRI plants under non-vernalized (NV) condition as 1. Data in b, e show mean ± s.d. from 3 biological replicates, two-way ANOVA with Tukey’s multiple comparisons test; NV, non-vernalized. V, vernalization days at 4°C. T, postcold days at 22°C.
Extended Data Fig. 10 |
Extended Data Fig. 10 |. Model of the Glucose-TOR-FIE-PRC2 signalling network governing diverse developmental programs.
a, The Glucose-TOR-FIE-PRC2 signalling network. Optimal photosynthesis in source leaves produces sugars that are transported to energy demanding sinks, including apical and lateral meristems, developing leaf primordia and young leaves, roots, flowers, fruits and seeds, to support their growth and development. In the sink, glucose derived from local or systemic carbon sources is metabolized to activate TOR kinase, which interacts with and phosphorylates FIE in the cytoplasm. The phosphorylated FIE is translocated into the nucleus to enhance PRC2 activity, which are recruited to the specific chromatin loci by transcription factors (TF), cis-regulatory elements (orange bar), and noncoding RNAs (blue waving lines) to deposit H3K27me3 and silence master transcription regulators controlling diverse developmental programs. This molecular mechanism orchestrates plant developmental fates, organogenesis, patterning and provides a direct and global mechanistic connection between glucose-TOR signalling and development. b, The Glucose-TOR-FIE-PRC2-FLC relay overrides the default vegetative developmental program to promote flowering. This molecular mechanism may underly the link between glucose and vernalization-mediated floral transition stimulated by prolonged cold exposure.
Fig. 1 |
Fig. 1 |. Glucose-TOR Signalling specifically regulates global H3K27me3 dynamics.
a, Distinct TOR activity thresholds regulate plant development. Seedling development, EdU staining, pS6K1(T449) phosphorylation, and H3K27me3 quantification in WT treated with different concentrations of Torin2 or in tor-es at 8 days after germination in rich medium. Images are representative of 10 seedlings. White scale bar, 2 mm. Red scale bar, 25 μm. b, Specific reduction of H3K27me3 levels in 7-d tor-es (10 μM estradiol for 3 d). c, Heatmap of H3K27me3 or H3K9me2 enrichment in WT and tor-es. The colour scale indicates reference-adjusted RPM (RRPM) surrounding peak summit from the ChIP-Rx-seq data. d, e, Glucose-TOR signalling rapidly regulates H3K27me3 dynamics. (d) Schematic presentation of experimental design for glucose regulation of TOR activity. d, day. h, hour. White scale bar, 2 mm. f, g, TOR but not S6K regulates global H3K27me3 levels. Torin2 (T), INK128 (I), and WYE-354 (W) are specific TOR inhibitors. Staurosporine (S) and PF4708671 (P) inhibit S6K1/2 activity. S6K activity is monitored by pRPS6(S237) and pRPS6(S240). Values are the relative level of histone modifications compared with the corresponding H3 control, with blot signals in WT set as 1.0. Experiments were conducted in three biological repeats with similar results. The samples derive from the same experiment and gels/blots were processed in parallel.
Fig. 2 |
Fig. 2 |. Direct TOR phosphorylation promotes cytoplasm-to-nucleus translocation of FIE.
a, Schematic presentation of the proximity-tagging system PUP-IT. PafA, a bacterial Pup ligase, is fused to the C-terminus (1226–2480) of TOR (TOR-C) (bait). TOR-C-PafA-HA as a bait ligates 3XFLAG-Pup(E) to the K residue of interacting proteins (prey). The subunits of PRC2 were screened for interaction with TOR-C-PafA-HA by pupylation. b, Specific FIE and TOR interaction. Immunoblot analysis of PUP-IT screening of MYC-tagged PRC2 components with TOR-C-PafA-HA. c, TOR interacts with FIE in vivo. Coimmunoprecipitation (Co-IP) of FLAG-tagged FIE with TOR from formaldehyde crosslinked plants. Non-transgenic WT plants served as the control. d, TOR directly phosphorylates FIE in vitro. Phosphorylation of His-FIE by endogenous TOR from IP is shown with autoradiography (top). Protein loading control is shown by Coomassie blue staining (bottom). Torin2 specifically inhibits TOR kinase. e, S14 in FIE is phosphorylated by TOR in vivo by tandem mass spectrometry. f, Critical TOR phosphorylation sites in FIE. In vitro TOR kinase assays were conducted with FIE and mutants. ΔN, N-terminus deletion. SSTS/AAAA, the phosphorylation site mutant. g, Detection of FIE phosphorylation in vivo. CIP, calf Intestinal alkaline phosphatase. Values are the relative level of phosphorylation over the FLAG-GFP-FIE by IP, with blots in mock treatment set as 1.0. h, Glucose enhances pFIE(S14) levels. Immunoblot analysis of pFIE(S14) in FLAG-GFP-FIE by IP from 7-day starved and 25 mM glucose stimulated (2 h) WT and tor-es plants. i, j, Confocal images of GFP-FIE and GFP-FIE(SSTS/AAAA) in leaf primordia and roots. WT without (Ctrl) or with 10 μM of Torin2 or AZD treatment or tor-es (10 μM estradiol for 3 d). Inset, GFP images in the root elongation zone. Scale bar, 25 μm. Images are representative of six seedlings from three biological repeats. Data in b-g, and h are representatives of three biological replicates each. The samples derive from the same experiment and gels/blots were processed in parallel.
Fig. 3 |
Fig. 3 |. The targeted FIE phosphorylation mutation abrogates global H3K27me3 landscape to reprogram transcriptome and disrupt organogenesis.
a, Significant reduction of global H3K27me3 levels in 14-day fie mutant plants. Metaplots show ChIP-Rx-seq read density of H3K27me3 ±2 kb from their peak summits. The ChIP-seq data are normalized with an exogenous reference genome. b, Depletion of H3K27me3 in fie mutants. Heatmap of H3K27me3 enrichment are shown. The colour scale indicates RRPM surrounding peak summit from the ChIP-Rx-seq data. c, The IGV browser view of H3K27me3 occupancy at PRC2 target genes. ACT2, a non-PRC2-target gene, serves as a negative control. d, Transcriptome reprogramming in 14-day fie mutants. Heatmap shows transcriptomic changes of fie-amiR-es (verse WT) and SSTS/AAAA (verse GFP-FIE) by RNA-seq analyses. e, Comparative expression analyses of key transcription factor genes in diverse developmental programs. A heatmap of RNA-seq data from triplicate biological samples prepared from WT, fie-amiR-es, GFP-FIE/fie, and SSTS/AAAA/fie plants is shown. The RNA expression data were normalized to the value in WT. f, The fie mutants display broad developmental aberrance. The fie-amiR-es and SSTS/AAAA/fie mutants exhibit small, narrow and curled leaves and flower prematurely (21d). The SSTS/AAAA/fie mutants develop thin, short and terminal inflorescence with aborted flower buds, narrow, split and twisted sepals and petals, enlarged carpel, as well as short, bulged and contorted siliques (30d). g, Histochemical staining of the 14-day pKNAT1-GUS transgenic plants in GFP-FIE/fie and SSTS/AAAA/fie. Red arrowhead, the shoot apical meristem. Three biological replicates, n > 10 plants in each experiment. White scale bar, 10 mm. Red scale bar, 1 mm.
Fig. 4 |
Fig. 4 |. Glucose-TOR-FIE signalling stimulates vernalization-mediated floral transition.
a, Vernalization induces glucose accumulation in Col-FRI plants. NV, non-vernalized. V, vernalization days at 4°C. T, postcold days at 22°C. (n = 3 biological repeats). b, Vernalization stimulates TOR activity. TOR activity is monitored by the band shift of S6K1-HA, indicating phosphorylated S6K1 (pS6K1). c, TOR promotes FLC repression by vernalization. d, TOR inhibitors prevent vernalization-mediated repression of the FLC reporter. Histochemical staining of the pFLC:FLC-GUS (Ler-FRI) transgenic plant before and after vernalization without or with TOR inhibitors (1 μM Torin2, INK128). Scale bar, 10 mm. e, TOR deficiency reduces H3K27me3 levels at FLC. Black boxes, exons. Red boxes, selected regions for H3K27me3 ChIP-qPCR analyses. bp, base pairs. FLC-1 and FLC-2 are located in the nucleation and spreading regions of H3K27me3 at FLC, respectively. f, TOR is required for vernalization. Flowering time analyses by counting rosette leaf numbers when bolting after vernalization. Data are shown as mean ± s.d. (n = individual plants). g, Representative flowering phenotype of the indicated plant at bolting after vernalization. Scale bar, 10 mm. h, Phosphorylated FIE is elevated during vernalization. Immunoblot analysis of the total and phosphorylated FIE proteins upon vernalization treatment. Values are the relative level of phosphorylated FIE/FLAG-FIE by IP. NV is set as 1.0. i, Repression of FLC by vernalization is diminished in SSTS/AAAA/fie/Col-FRI plants. j, Vernalization induced H3K27me3 levels during two silencing phases at FLC are compromised. c, i, Relative FLC/UBC21 expression normalized to the non-vernalized (NV) level of ctrl or fie/Col-FRI plants. e, j, Relative H3K27me3/H3 level normalized to that of ctrl or fie/Col-FRI plants under non-vernalized (NV) condition as 1. Data in c, e, i, j show mean ± s.d. from 3 biological replicates, two-way ANOVA with Tukey’s multiple comparisons test; f, one-way ANOVA with Tukey’s multiple comparisons test. Data in b and h are representatives of three biological replicates each. The samples derive from the same experiment and gels/blots were processed in parallel.

Comment in

References

    1. Krejci A & Tennessen JM Metabolism in time and space - exploring the frontier of developmental biology. Development 144, 3193–3198, doi: 10.1242/dev.150573 (2017). - DOI - PubMed
    1. Shi L, Wu Y & Sheen J TOR signaling in plants: conservation and innovation. Development 145, doi: 10.1242/dev.160887 (2018). - DOI - PMC - PubMed
    1. Li L, Liu KH & Sheen J Dynamic Nutrient Signaling Networks in Plants. Annu Rev Cell Dev Biol 37, 341–367, doi: 10.1146/annurev-cellbio-010521-015047 (2021). - DOI - PMC - PubMed
    1. Xiong Y et al. Glucose-TOR signalling reprograms the transcriptome and activates meristems. Nature 496, 181–186, doi: 10.1038/nature12030 (2013). - DOI - PMC - PubMed
    1. Dobrenel T et al. TOR Signaling and Nutrient Sensing. Annu Rev Plant Biol 67, 261–285, doi: 10.1146/annurev-arplant-043014-114648 (2016). - DOI - PubMed

Publication types

MeSH terms