. 2023 Jan;114(1):306-320.
doi: 10.1111/cas.15584. Epub 2022 Sep 29.

AIM2 upregulation promotes metastatic progression and PD-L1 expression in lung adenocarcinoma

Affiliations

AIM2 upregulation promotes metastatic progression and PD-L1 expression in lung adenocarcinoma

Jing-Quan Zheng et al. Cancer Sci. 2023 Jan.

Abstract

Cancer metastasis leading to the dysfunction of invaded organs is the main cause of the reduced survival rates in lung cancer patients. However, the molecular mechanism for lung cancer metastasis remains unclear. Recently, the increased activity of inflammasome appeared to correlate with the metastatic progression and immunosuppressive ability of various cancer types. Our results showed that the mRNA levels of absence in melanoma 2 (AIM2), one of the inflammasome members, are extensively upregulated in primary tumors compared with normal tissues derived from the TCGA lung adenocarcinoma (LUAD) database. Moreover, Kaplan-Meier analysis demonstrated that a higher mRNA level of AIM2 refers to a poor prognosis in LUAD patients. Particularly, AIM2 upregulation is closely correlated with smoking history and the absence of EGFR/KRAS/ALK mutations in LUAD. We further showed that the endogenous mRNA levels of AIM2 are causally associated with the metastatic potentials of the tested LUAD cell lines. AIM2 knockdown suppressed but overexpression promoted the migration ability and lung colony-forming ability of tested LUAD cells. In addition, we found that AIM2 upregulation is closely associated with an increased level of immune checkpoint gene set, as well as programmed cell death-ligand 1 (PD-L1) transcript, in TCGA LUAD samples. AIM2 knockdown predominantly repressed but overexpression enhanced PD-L1 expression via altering the activity of PD-L1 transcriptional regulators NF-κB/STAT1 in LUAD cells. Our results not only provide a possible mechanism underlying the AIM2-promoted metastatic progression and immune evasion of LUAD but also offer a new strategy for combating metastatic/immunosuppressive LUAD via targeting AIM2 activity.

Keywords: AIM2 inflammasome; PD-L1; cancer metastasis; epithelial-mesenchymal transition; lung cancer.


Figures

FIGURE 1
FIGURE 1
AIM2 is highly expressed in primary tumors compared with normal tissues and correlates with a shorter disease‐free interval in lung adenocarcinoma (LUAD). Heatmap (A) and boxplot (B) for the transcriptional profiling of inflammasome family in normal lung tissues and primary tumors from TCGA lung cancer database. C, The mRNA levels of NLRP7, NLRP11, and AIM2 in the paired normal adjacent tissue and primary tumor derived from clinical lung cancer patients in TCGA database. D, Boxplot for the mRNA levels of AIM2 in the normal tissues and primary tumors from patients with LUAD or lung squamous cell carcinoma (LUSC). P‐values (B, D), Student t test. E, The mRNA levels of AIM2 in the paired normal adjacent tissue and primary tumor derived from patients with LUAD and LUSC. P‐values (C, E), paired t test. F, Scatchard plots for the mRNA levels of AIM2 and disease‐free intervals in TCGA LUAD and LUSC. p‐value, Pearson correlation test. The symbols *, ** and *** denote p < 0.01, p < 0.05 and p < 0.001, respectively.
FIGURE 2
FIGURE 2
AIM2 upregulation correlates with poor outcomes in lung adenocarcinoma (LUAD). A, Cox regression test using univariate model for AIM2 mRNA levels (high vs. low) against different lung cancer datasets deposited in PrognoScan database. *p < 0.01, **p < 0.05, ***p < 0.001. Kaplan‐Meier analyses for AIM2 transcripts under the condition of first progression‐free survival (FPS) (B) and recurrence‐free survival (RFS) (C) probability in the unclassified lung cancer patients and the patients with LUAD and lung squamous cell carcinoma (LUSC) from K‐M Plotter database and with LUAD from the GSE31210 dataset, respectively. D, Cox regression test using univariate and multivariate modes against age, gender, smoker, stage, EGFR/ALK/KRAS mutations, and AIM2 mRNA levels under the condition of RFS probability in GSE31210 LUAD patients. E, Boxplots for the AIM mRNA levels in the indicated stratifications. The inserts represent the median of AIM2 mRNA levels and number of patients. The statistical significances were analyzed by t test.
FIGURE 3
FIGURE 3
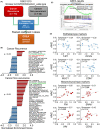
AIM2 upregulation correlates with the activation of epithelial‐mesenchymal transition (EMT) in the primary tumors derived from lung adenocarcinoma (LUAD) patients with cancer recurrence. A, The flowchart for generating the AIM2‐related gene signature from the primary tumors of GSE31210 LUAD patients and performing the computational simulation using the Gene Set Enrichment Analysis (GSEA) program against the Hallmark gene set. B, Histogram for the normalized enrichment scores derived from GSEA simulation against the correlation between AIM2‐related gene signature and Hallmark gene set. C, The plot of enrichment score was obtained from the correlation between the AIM2‐related gene signature and EMT‐related gene set in the GSEA simulation. D, Scatchard plots for the mRNA levels of AIM2‐ and EMT‐related genes TJP1, OCLN, MUC1, CDH1, FN1, SNAI1, VIM, and CDH2 in the primary tumors of GSE31210 LUAD patients with cancer recurrence as shown in (A). p‐values, Spearman correlation test.
FIGURE 4
FIGURE 4
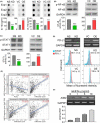
AIM2 knockdown suppresses the epithelial‐mesenchymal transition (EMT) progression and metastatic potentials of lung adenocarcinoma cells. RT‐PCR (upper) and Q‐PCR (lower) for the endogenous mRNA levels of AIM2 and GAPDH (A); Giemsa stain for the migrated cells (B); and histogram for the migrated cell number, presented as mean ± SEM, from three independent experiments of the 16‐h transwell culture (C) against the tested lung adenocarcinoma cell lines A549, H1355, HCC827, and PC9. p‐value, Friedman test. RT‐PCR and immunoblotting for the mRNA and protein levels of AIM2 and GAPDH (D); Giemsa stain for the migrated cells (E); and histogram for the migrated cell number from three independent experiments of the 16‐h transwell culture (F) against the parental (PT) A549 cells and A549 cells stably transfected with nonsilencing (NS) control or two independent AIM2 shRNAs. RT‐PCR and immunoblotting for the mRNA and protein levels of AIM2 and GAPDH (G); Giemsa stain for the migrated cells (H); and histogram for the migrated cell number from three independent experiments of the 16‐h transwell culture (I) against the parental (PT), vector control (VC), and AIM2‐overexpressing (OE) PC9 cells. J, Hematoxylin/eosin stain for the appearance of tumors in lungs derived from the xenotransplantation of IL2Rg null mice (n = 5) transplanted with the NS control or AIM2‐KD A549 cells for 4 wk (upper) and histogram for the number of lung colonies that are larger than 100 μm in diameter (lower). ***p < 0.001 (F, I, K) in the Mann‐Whitney U test. K, L, RT‐PCR (left) for the mRNA levels and Western blot analyses for the protein levels (right) of CDH1, CDH2, VIM, FN1, and GAPDH in the NS control/AIM2‐knockdown (KD) A549 cells (K) and VC control/AIM2‐OE PC9 cells (L). GAPDH was used as an internal control of experiments.
FIGURE 5
FIGURE 5
AIM2 upregulation correlates with an increased level of immune checkpoint genes in lung adenocarcinoma (LUAD). A, The plot of enrichment scores for the correlation of AIM2‐related gene signatures with the gene set for interferon gamma (IFN‐γ) response in the indicated GSE31210 LUAD samples. B, C, Scatchard plots for the mRNA levels of AIM2 versus IFN‐γ response gene set (B) and AIM2 versus PD‐L1 (C) in the GSE31210 LUAD samples. D, E, Heatmap (D) and Scatchard plots (E) for the transcriptional profiling of AIM2 versus IFN‐γ response gene set immune checkpoint (ICP) gene set using TCGA LUAD samples derived from patients recorded as smoker and harboring wild‐type (WT) EGFR/KRAS/ALK. F, Scatchard plot for the mRNA levels of AIM2 versus PD‐L1 in TCGA LUAD samples shown in (D) and (E). P‐values (B, C, E, F), Pearson correlation test.
FIGURE 6
FIGURE 6
AIM2 knockdown suppresses the inflammasome‐related signaling axis and IFN‐γ responsive pathway in lung adenocarcinoma (LUAD) cells. A, Dot blot analysis (upper) and ELISA (lower) for the protein levels of secreted IL‐1β and IL‐18 in the culture media from the three independent cultivation of NS control/AIM2‐KD A549 cells and VC control/AIM2‐OE PC9 cells. B, C, Western blot analysis for the protein levels of phosphorylated NF‐κB (p‐NF‐κB), NF‐κB, p‐STAT1, STAT1, and GAPDH in the whole‐cell lysates (B, C, upper) and Luciferase‐reporter assay for the transcriptional regulator activity of NF‐κB and STAT1 (B, C, lower) from the indicated A549 and PC9 cell variants. In (A‐C), data from three independent experiments were presented as mean ± SEM. ***p < 0.001 in the Mann‐Whitney U test. D, RT‐PCR for the mRNA levels of PD‐L1 and GAPDH and flow‐cytometric analyses for cell surface levels of PD‐L1 in the indicated A549 and PC9 cell variants. E, The correlation among AIM2 mRNA levels, tumor purity, and infiltration levels of CD8+ T cells, M1 macrophage, and NK cells in TCGA LUAD samples. Spearman correlation test was used to estimate the statistical significance. F, RT‐PCR (upper) and Q‐PCR (lower) analyses for the mRNA levels of AIM2 and GAPDH in A549 cells treated with recombinant human IFN‐γ (rehIFN‐γ, Sino Biological) at indicated concentrations for 24 h.
FIGURE 7
FIGURE 7
Targeting AIM2 inflammasome pathway mitigates the PD‐L1–mediated immunosuppression in lung adenocarcinoma (LUAD). A, Kaplan‐Meier analyses under recurrence‐free survival (RFS) for GSE31210 LUAD cohort (upper) and first progression‐free survival (FPS) for K‐M Plotter cohort (lower) conditions against the PD‐L1 mRNA levels combined without (left) or with (right) AIM2 mRNA levels. B, RT‐PCR for the mRNA levels of CDH1, CDH2, PD‐L1, and GAPDH in the vector control (VC) and AIM2‐overexpressing (OE) PC9 cells treated without or with NF‐κB inhibitor BAY 11‐7082 at 3 and 10 μM. C, Flow cytometry analysis for the cell death of NS control A549 cells without (w/o) coculture with the activated Jurkat T cells and Jurkat T cell cytotoxicity against the NS control and AIM2‐KD A549 cells. The proportions of apoptotic cells (CFSE+/PI+) from three independent experiments were presented as mean ± SEM. D, The illustration of a possible mechanism for the AIM2‐fostered epithelial‐mesenchymal transition (EMT) progression and PD‐L1 expression in metastatic/immunosuppressive LUAD.

References

    1. Araujo A, Ribeiro R, Azevedo I, et al. Genetic polymorphisms of the epidermal growth factor and related receptor in non‐small cell lung cancer – a review of the literature. Oncologist. 2007;12:201‐210. - PubMed
    1. Wu K, House L, Liu W, Cho WCS. Personalized targeted therapy for lung cancer. Int J Mol Sci. 2012;13:11471‐11496. - PMC - PubMed
    1. Tamura T, Kurishima K, Nakazawa K, et al. Specific organ metastases and survival in metastatic non‐small‐cell lung cancer. Mol Clin Oncol. 2015;3:217‐221. - PMC - PubMed
    1. Mantovani A, Allavena P, Sica A, Balkwill F. Cancer‐related inflammation. Nature. 2008;454:436‐444. - PubMed
    1. Bremnes RM, Al‐Shibli K, Donnem T, et al. The role of tumor‐infiltrating immune cells and chronic inflammation at the tumor site on cancer development, progression, and prognosis: emphasis on non‐small cell lung cancer. J Thorac Oncol. 2011;6:824‐833. - PubMed