. 2022 Sep 5:28:100401.
doi: 10.1016/j.pacs.2022.100401. eCollection 2022 Dec.

Multi-gas quartz-enhanced photoacoustic sensor for environmental monitoring exploiting a Vernier effect-based quantum cascade laser

Affiliations

Multi-gas quartz-enhanced photoacoustic sensor for environmental monitoring exploiting a Vernier effect-based quantum cascade laser

Andrea Zifarelli et al. Photoacoustics. .

Abstract

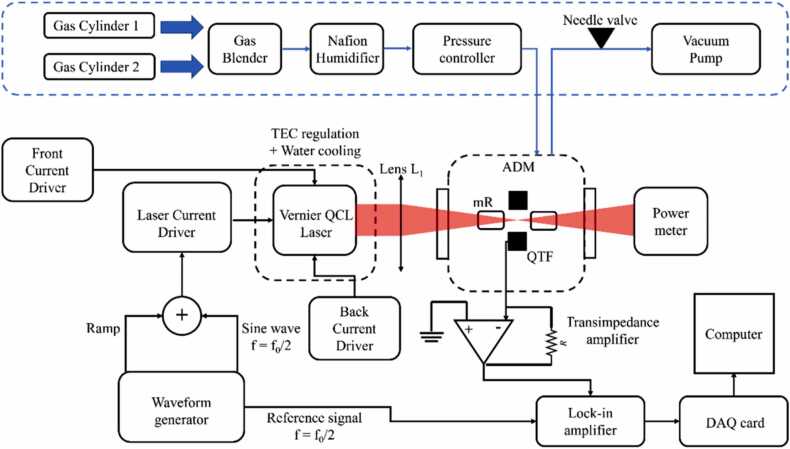
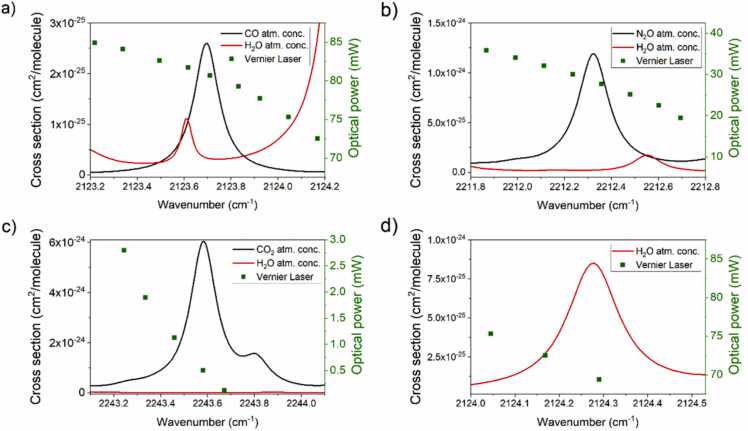
We report on a gas sensor based on quartz-enhanced photoacoustic spectroscopy (QEPAS) able to detect multiple gas species for environmental monitoring applications, by exploiting a Vernier effect-based quantum cascade laser as the excitation source. The device emission spectrum consists of ten separated emission clusters covering the range from 2100 up to 2250 cm-1. Four clusters were selected to detect the absorption features of carbon monoxide (CO), nitrous oxide (N2O), carbon dioxide (CO2), and water vapor (H2O), respectively. The sensor was calibrated with certified concentrations of CO, N2O and CO2 in a wet nitrogen matrix. The H2O absorption feature was used to monitor the water vapor within the gas line during the calibration. Minimum detection limits of 6 ppb, 7 ppb, and 70 ppm were achieved for CO, N2O and CO2, respectively, at 100 ms of integration time. As proof of concept, the QEPAS sensor was tested by continuously sampling indoor laboratory air and monitoring the analytes concentrations.

Keywords: Environmental monitoring; Multi-gas sensing; QEPAS; Widely tunable QCL.


Conflict of interest statement

The authors declare that they have no known competing financial interests or personal relationships that could have appeared to influence the work reported in this paper.

Figures

Fig. 1
Fig. 1
(a) Laser emission at IL = 840 mA and different values of IB: 450 mA (red curve), 850 mA (blue curve), 1100 mA (black curve), while IF = 0; (b) Laser emission at IL = 840 mA and different values of IF: 450 mA (red curve), 750 mA (blue curve), 1050 mA (black curve), while IB = 0; (c) Optical emission power as a function of the laser peak emission wavenumber for configurations employing the Front Section (black dots), the Back Section (red dots) and the QCL section (green dots).
Fig. 2
Fig. 2
Schematic of the employed experimental setup. QTF, quartz tuning fork; mR, resonator tube; ADM, acoustic detection module.
Fig. 3
Fig. 3
Absorption cross section of target analytes at atmospheric concentration simulated using the HITRAN database (solid curve) and laser optical power within the simulation spectral ranges (green squares). a) 150 ppb of CO (black curve) and 1.19 % of H2O (red curve) in N2; b) 310 ppb of N2O (black curve) and 1.19 % of H2O (red curve) in N2; c) 330 ppm of CO2 (black curve) and 1.19 % of H2O (red curve) in N2; and d) 1.19 % of H2O (red curve) in N2. All the spectra were simulated at atmospheric pressure.
Fig. 4
Fig. 4
(a) 2f-QEPAS spectral scan of the H2O absorption feature at 2 % concentration in N2; (b) peak values from a 75-min-long acquisition of QEPAS signal for 2 % H2O in N2.
Fig. 5
Fig. 5
(a) 2f-QEPAS spectral scans of the CO absorption feature at eight CO concentrations; (b) 2f-QEPAS spectral scans of the N2O absorption features at eight N2O concentrations; (c) 2f-QEPAS spectral scans of the CO2 absorption peaks at eight CO2 concentrations.
Fig. 6
Fig. 6
(a) QEPAS peak signals as a function of the CO concentration (black squares) and the corresponding best linear fit (black dashed line); (b) QEPAS peak signals as a function of the N2O concentration (red triangles) and the corresponding best linear fit (red dashed line); (c) QEPAS peak signals as a function of the CO2 concentration (blue dots) and the corresponding best linear fit (blue dashed line).
Fig. 7
Fig. 7
(a) 2f-QEPAS spectral scan of CO absorption feature at atmospheric concentration in indoor environment; (b) 2f-QEPAS spectral scan of N2O absorption feature at atmospheric concentration in indoor environment; (c) 2f-QEPAS spectral scan of CO2 absorption feature at atmospheric concentration in indoor environment. 2f-QEPAS spectral scan of H2O at a concentration of 2 % can be observed in Figs. (a) and (b).
Fig. 8
Fig. 8
Target gases concentrations estimated during the long-term monitoring of indoor laboratory air. (a) Estimated CO concentration (black squares); (b) Estimated N2O concentration (red triangles); (c) Estimated CO2 concentration (blue dots).

References

    1. Almeida D.L., Pavanello A., Saavedra L.P., Pereira T.S., de Castro-Prado M.A.A., de Freitas Mathias P.C. Environmental monitoring and the developmental origins of health and disease. J. Dev. Orig. Health Dis. 2019;10:608–615. - PubMed
    1. Gray W.B., Shimshack J.P. The effectiveness of environmental monitoring and enforcement: a review of the empirical evidence. Rev. Environ. Econ. Policy. 2011;5:3–24.
    1. Saxena P., Naik V., editors. Air Pollution: Sources, Impacts and Controls. CABI; Wallingford: 2019.
    1. Hayat H., Griffiths T., Brennan D., Lewis R.P., Barclay M., Weirman C., Philip B., Searle J.R. The state-of-the-art of sensors and environmental monitoring technologies in buildings. Sensors. 2019;19:3648. - PMC - PubMed
    1. Bacco M., Delmastro F., Ferro E., Gotta A. Environmental monitoring for smart cities. IEEE Sens. J. 2017;17:7767–7774.