

Magnetization transfer imaging of ovarian cancer: initial experiences of correlation with tissue cellularity and changes following neoadjuvant chemotherapy
- PMID: 36105417
- PMCID: PMC9459873
- DOI: 10.1259/bjro.20210078
Magnetization transfer imaging of ovarian cancer: initial experiences of correlation with tissue cellularity and changes following neoadjuvant chemotherapy
Abstract
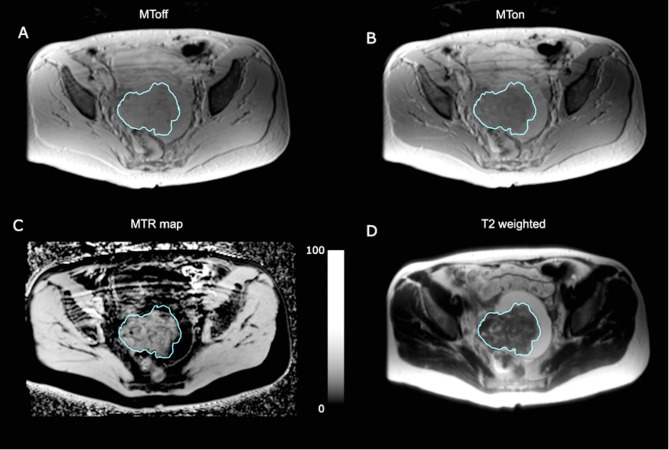
Objectives: To investigate the relationship between magnetization transfer (MT) imaging and tissue macromolecules in high-grade serous ovarian cancer (HGSOC) and whether MT ratio (MTR) changes following neoadjuvant chemotherapy (NACT).
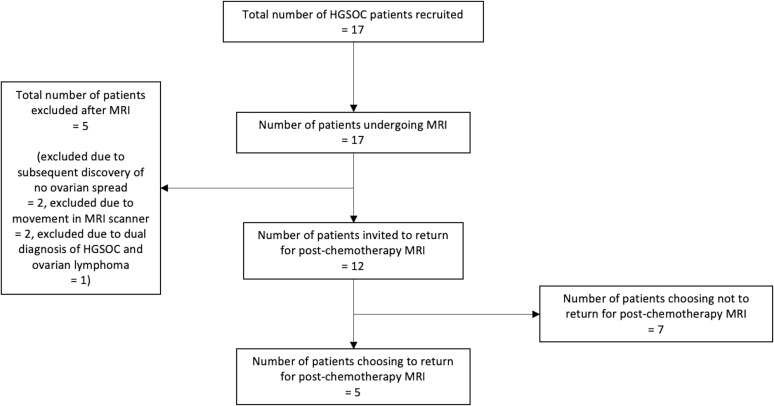
Methods: This was a prospective observational study. 12 HGSOC patients were imaged before treatment. MTR was compared to quantified tissue histology and immunohistochemistry. For a subset of patients (n = 5), MT imaging was repeated after NACT. The Shapiro-Wilk test was used to assess for normality of data and Spearman's rank-order or Pearson's correlation tests were then used to compare MTR with tissue quantifications. The Wilcoxon signed-rank test was used to assess for changes in MTR after treatment.
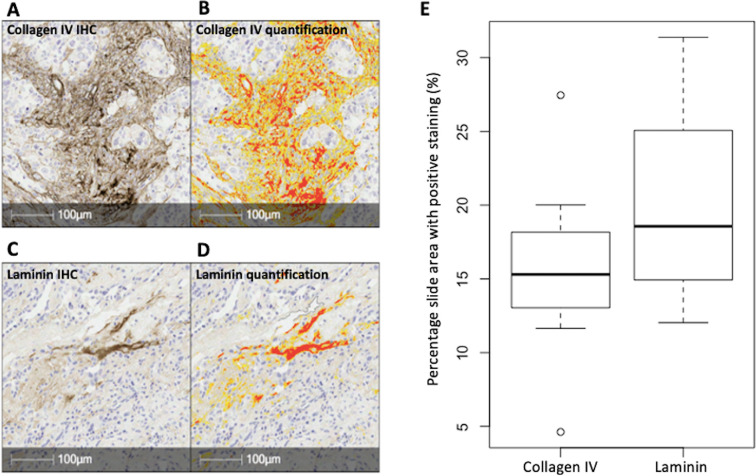
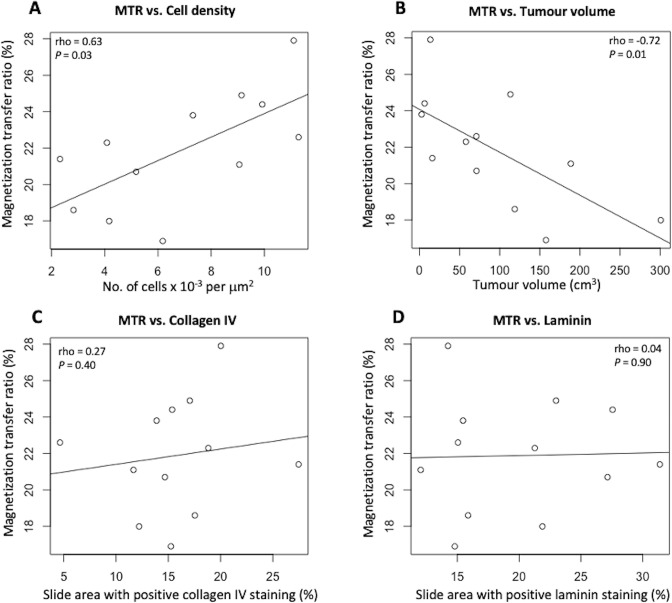
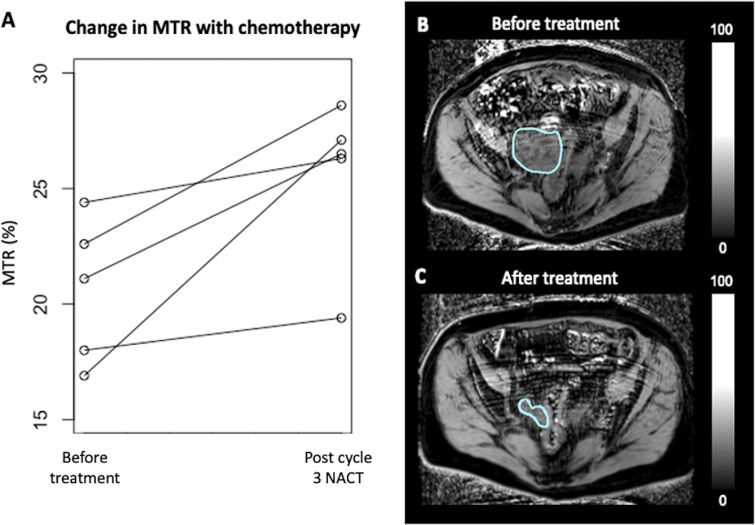
Results: Treatment-naïve tumour MTR was 21.9 ± 3.1% (mean ± S.D.). MTR had a positive correlation with cellularity, rho = 0.56 (p < 0.05) and a negative correlation with tumour volume, ρ = -0.72 (p = 0.01). MTR did not correlate with the extracellular proteins, collagen IV or laminin (p = 0.40 and p = 0.90). For those patients imaged before and after NACT, an increase in MTR was observed in each case with mean MTR 20.6 ± 3.1% (median 21.1) pre-treatment and 25.6 ± 3.4% (median 26.5) post-treatment (p = 0.06).
Conclusion: In treatment-naïve HGSOC, MTR is associated with cellularity, possibly reflecting intracellular macromolecular concentration. MT may also detect the HGSOC response to NACT, however larger studies are required to validate this finding.
Advances in knowledge: MTR in HGSOC is influenced by cellularity. This may be applied to assess for cell changes following treatment.
© 2022 The Authors. Published by the British Institute of Radiology.
Conflict of interest statement
Competing interests: The authors have no conflicts of interest to declare.
Figures
Similar articles
-
Sodium MRI with 3D-cones as a measure of tumour cellularity in high grade serous ovarian cancer.Eur J Radiol Open. 2019 Apr 19;6:156-162. doi: 10.1016/j.ejro.2019.04.001. eCollection 2019. Eur J Radiol Open. 2019. PMID: 31032385 Free PMC article.
-
Diffusion kurtosis MRI as a predictive biomarker of response to neoadjuvant chemotherapy in high grade serous ovarian cancer.Sci Rep. 2019 Jul 24;9(1):10742. doi: 10.1038/s41598-019-47195-4. Sci Rep. 2019. PMID: 31341212 Free PMC article.
-
Fast high-resolution brain imaging with balanced SSFP: Interpretation of quantitative magnetization transfer towards simple MTR.Neuroimage. 2012 Jan 2;59(1):202-11. doi: 10.1016/j.neuroimage.2011.07.038. Epub 2011 Jul 23. Neuroimage. 2012. PMID: 21820061
-
Uptake and Outcomes of Neoadjuvant Chemotherapy Among US Patients With Less Common Epithelial Ovarian Carcinomas.JAMA Netw Open. 2023 Jun 1;6(6):e2318602. doi: 10.1001/jamanetworkopen.2023.18602. JAMA Netw Open. 2023. PMID: 37326992 Free PMC article.
-
Magnetization transfer imaging of the spinal cord and the optic nerve in patients with multiple sclerosis.Neurology. 1999;53(5 Suppl 3):S46-8. Neurology. 1999. PMID: 10496211 Review.
References
Grants and funding
LinkOut - more resources
Full Text Sources
