. 2022 Sep 5:2022:7769355.
doi: 10.1155/2022/7769355. eCollection 2022.

Quercetin Protects against MPP+/MPTP-Induced Dopaminergic Neuron Death in Parkinson's Disease by Inhibiting Ferroptosis

Affiliations

Quercetin Protects against MPP+/MPTP-Induced Dopaminergic Neuron Death in Parkinson's Disease by Inhibiting Ferroptosis

Zhi-Hao Lin et al. Oxid Med Cell Longev. .

Abstract

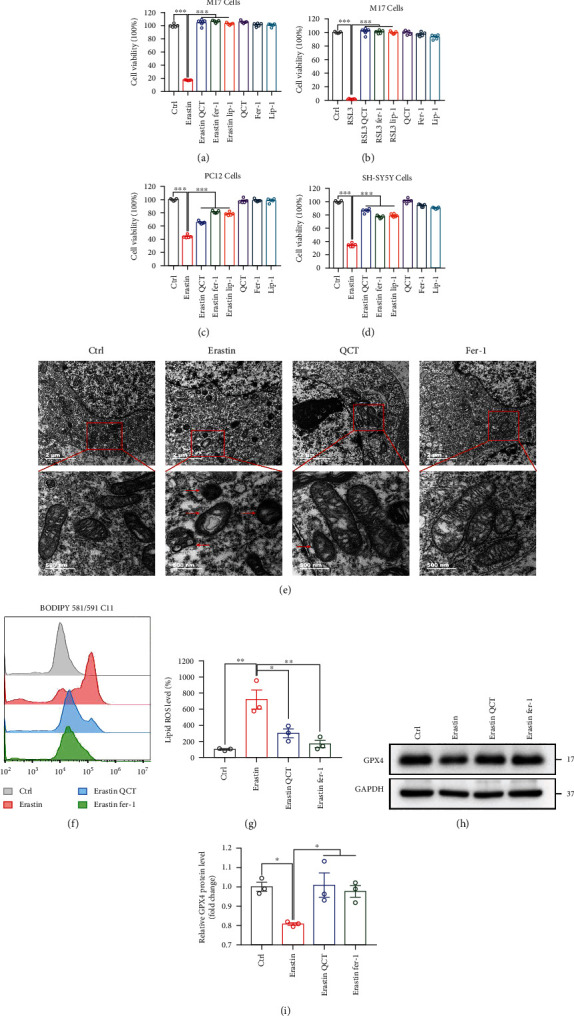
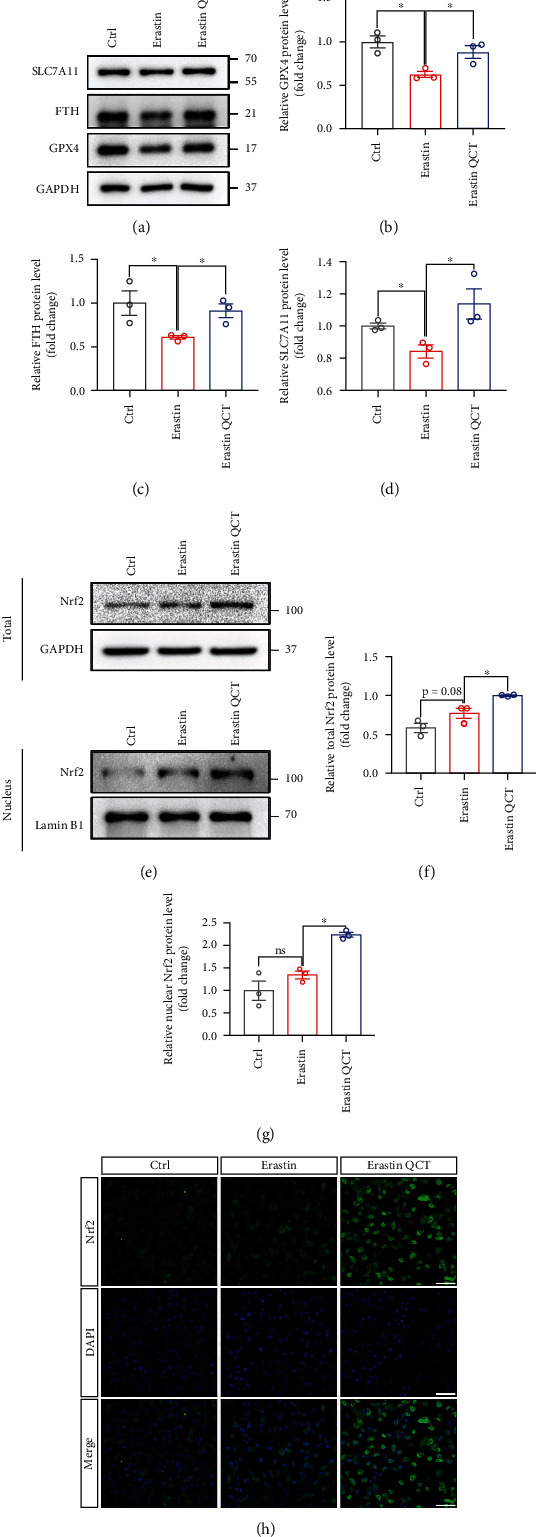
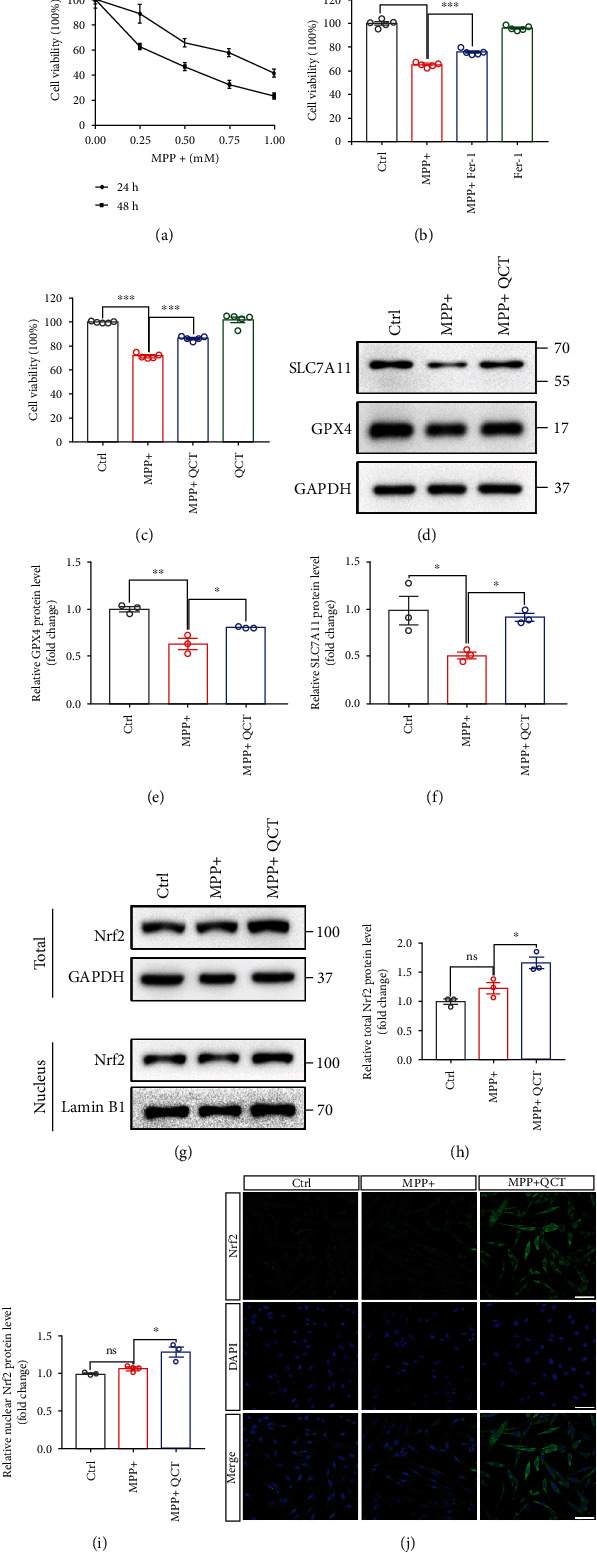
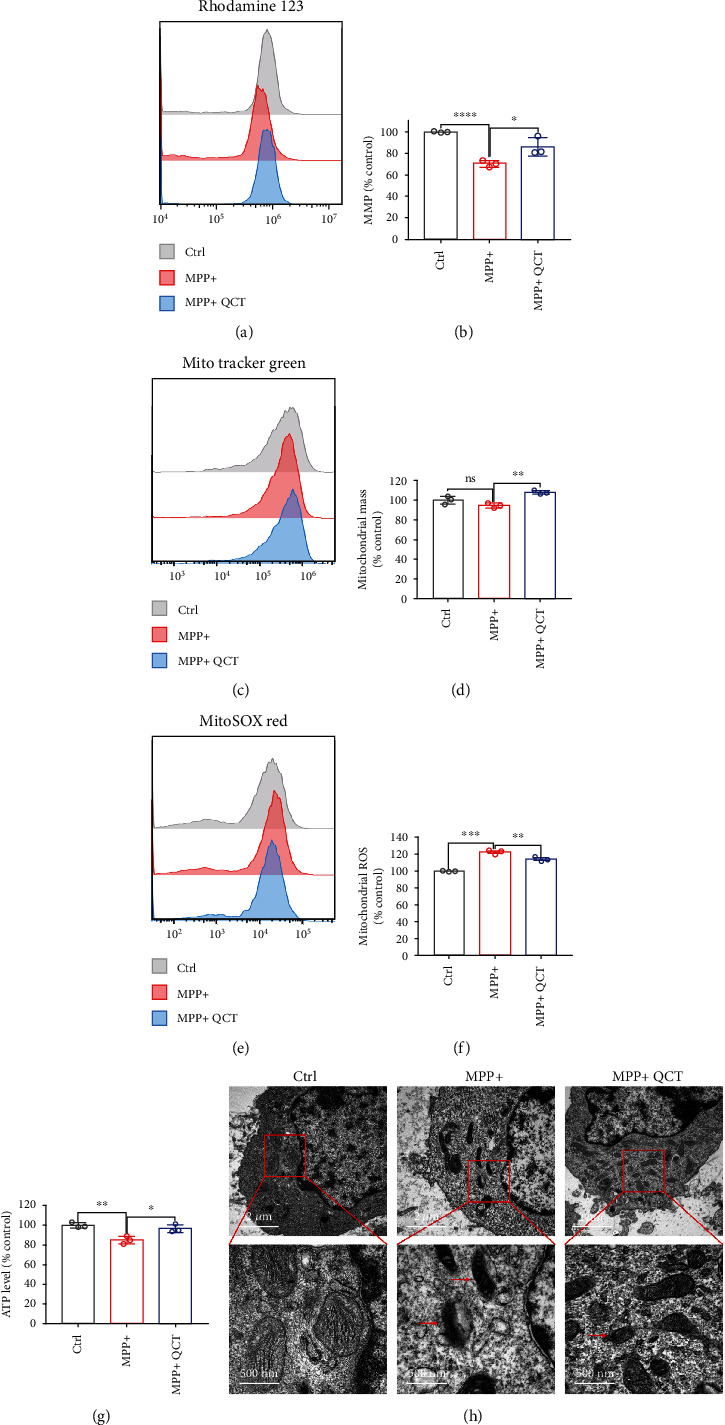
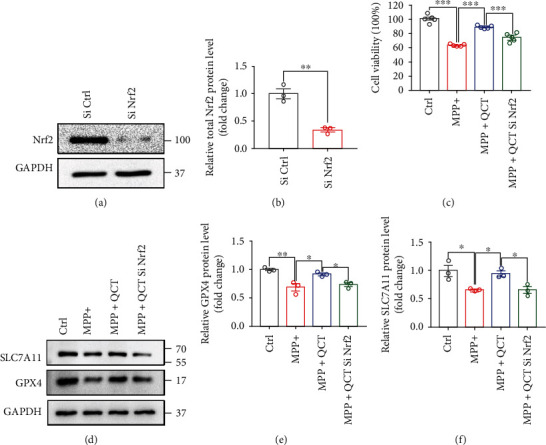
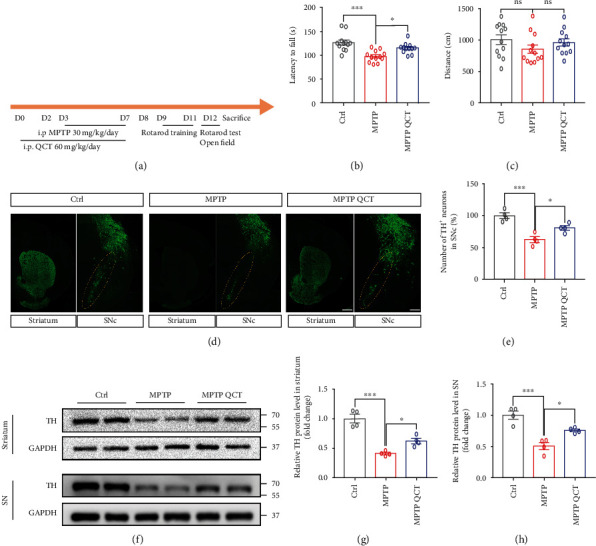
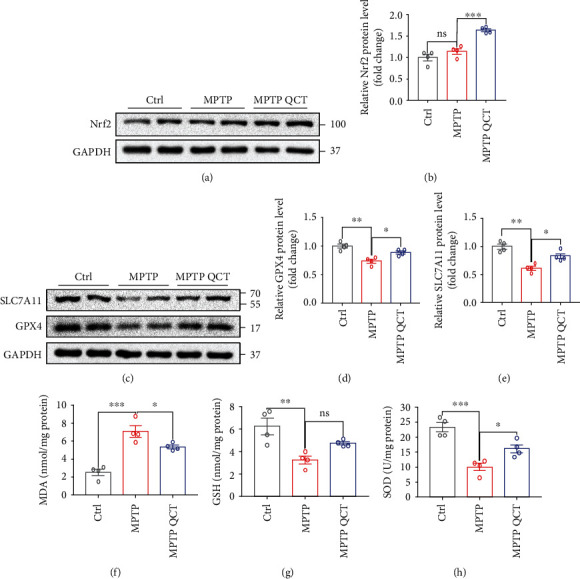
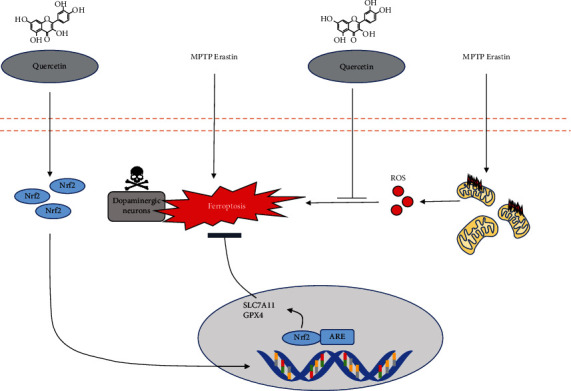
Ferroptosis, a novel form of regulated cell death, is caused by accumulation of lipid peroxides and excessive iron deposition. This process has been linked to the death of dopaminergic neurons in substantia nigra compacta (SNc) of Parkinson's disease (PD) patients. Quercetin (QCT), a natural flavonoid, has multiple pharmacological activities. However, it has not been established whether QCT can protect against dopaminergic neuron death by inhibiting ferroptosis. In this study, we investigated the potential antiferroptotic effects of QCT in cellular models established using specific ferroptosis inducers (Erastin and RSL-3) and MPP+. The effects were also explored using MPTP-induced PD mouse models. The cell counting kit-8 (CCK-8) assay was performed to assess cell viability. Variations in mitochondrial morphology were evaluated by transmission electron microscopy (TEM) while the mitochondrial membrane potential, mass, and ROS were measured by fluorescent probes. Lipid peroxidation levels were assayed through measurement of lipid ROS, MDA, GSH, and SOD levels. The effects of QCT on MPTP-induced behavioral disorders were examined by rotarod and open field tests. In vitro and in vivo, QCT significantly inhibited ferroptosis by activating the nuclear factor erythroid 2-related factor 2 (Nrf2) protein. Additionally, QCT ameliorated motor behavioral impairments and protected against the loss of dopaminergic neurons in MPTP-induced PD models. Interestingly, Nrf2 knockdown alleviated the protective effects of QCT against ferroptosis. In conclusion, these results demonstrate that ferroptosis is involved in MPP+/MPTP-induced PD, and QCT inhibits ferroptosis by activating the Nrf2 protein. Therefore, QCT is a potential agent for preventing the loss of dopaminergic neurons by targeting ferroptosis.


Conflict of interest statement

The authors declare no conflicts of interest.

Figures

Figure 1
Figure 1
QCT significantly inhibited Erastin- and RSL3-induced ferroptosis in M17, PC12, and SH-SY5Y cells. (a–d) Viabilities of M17, PC12, and SH-SY5Y cells after treatment with QCT (10 μM), Fer-1 (1 μM), and Lip-1 (200 nM) for 1 h, respectively, followed by Erastin (1 μM, 24 h) or RSL3 (1 μM, 12 h) treatments (n = 5). (e) Representative transmission electron microscope images for M17 cells treated with or without QCT (10 μM) or Fer-1 (1 μM, 1 h), followed by Erastin (2 μM, 12 h) treatment. Red arrows indicate shrunken mitochondria. Scale bars as indicated. (f, g) The M17 cells were treated with QCT (10 μM) or Fer-1 (1 μM) for 1 h, followed by Erastin (2 μM) for 24 h, and the lipid ROS assayed by flow cytometry using C11-BODIPY (n = 3). (h) Representative immunoblots of the GPX4 protein from M17 cells treated with or without QCT (10 μM, 1 h), or Fer-1 (1 μM, h), followed by Erastin (1 μM, 12 h) treatment. (i) Quantification of GPX4 protein levels (n = 3). Data are presented as mean ± SEM. One-way ANOVA followed by Tukey's post hoc test. p < 0.05, ∗∗p < 0.01, and ∗∗∗p < 0.001.
Figure 2
Figure 2
QCT inhibited Erastin-induced ferroptosis in M17 cells by activating the Nrf2 pathway. (a) Representative immunoblots for SLC7A11, FTH, and GPX4 proteins from M17 cells treated with or without QCT (10 μM, 1 h), followed by Erastin (1 μM, 12 h) treatment. (b–d) Quantification of SLC7A11, FTH, and GPX4 protein levels (n = 3). (e, f) Representative immunoblots for nuclear and total Nrf2 protein levels from M17 cells treated with or without QCT (10 μM, 1 h), followed by Erastin (1 μM, 12 h) treatment. (f, g) Quantification of nuclear and total Nrf2 protein levels (n = 3). Immunofluorescence analysis of M17 cells treated with or without QCT (10 μM, 1 h), followed by Erastin (1 μM, 12 h) treatment, stained with Nrf2 antibody (green) and DAPI (blue). Scale bar = 50 μm. Data are presented as mean ± SEM. One-way ANOVA followed by Tukey's post hoc test. p < 0.05, ∗∗p < 0.01, and ∗∗∗p < 0.001; ns: no significant difference.
Figure 3
Figure 3
QCT inhibited MPP+-induced ferroptosis in PC12 cells by activating the Nrf2 pathway. (a) Viabilities of PC12 cells treated with 0.25, 0.5, 0.75, and 1 mM MPP+ for 24 h or 48 h (n = 5). (b) Viability of PC12 cells treated with or without Fer-1 (1 μM, 1 h), followed by MPP+ (0.5 mM, 24 h) treatment (n = 5). (c) Viability of PC12 cells treated with or without QCT (10 μM, 1 h), followed by MPP+ (0.5 mM, 24 h) treatment (n = 5). (d) Representative immunoblots for SLC7A11 and GPX4 proteins from PC12 cells treated with or without QCT (10 μM, 1 h), followed by MPP+ treatment (0.5 mM, 24 h). (e, f) Quantification of SLC7A11 and GPX4 protein levels (n = 3). (g) Representative immunoblots for nuclear and total Nrf2 proteins from PC12 cells treated with or without QCT (10 μM, 1 h), followed by MPP+ (0.5 mM, 24 h) treatment. (h, i) Quantification of nuclear and total Nrf2 protein levels (n = 3). (j) Immunofluorescent analysis from PC12 cells treated with or without QCT (10 μM, 1 h), followed by MPP+ (0.5 mM, 24 h) treatment. Scale bar = 50 μm. Data are presented as mean ± SEM. One-way ANOVA followed by Tukey's post hoc test. p < 0.05, ∗∗p < 0.01, and ∗∗∗p < 0.001; ns: no significant difference.
Figure 4
Figure 4
QCT alleviated mitochondrial dysfunction in MPP+-treated PC12 cells. (a, b) Mitochondrial membrane potential was assayed by flow cytometry using Rhodamine 123 (n = 3). (c, d) Mitochondrial mass was assayed by flow cytometry using MitoTracker Green (n = 3). (e, f) Mitochondrial ROS was assayed by flow cytometry using MitoSOX Red (n = 3). (G) Intracellular ATP levels in PC12 cells treated with or without QCT (10 μM, 1 h), followed by MPP+ (0.5 mM, 24 h) treatment, were assayed by the ATP Assay Kit (n = 3). (h) Representative transmission electron microscopy images for PC12 cells treated with or without QCT (10 μM, 1 h), followed by MPP+(0.5 mM, 24 h) treatment. Red arrows indicate shrunken mitochondria. Scale bars as indicated. Data are presented as the mean ± SEM. One-way ANOVA followed by Tukey's post hoc test. p < 0.05, ∗∗p < 0.01, and ∗∗∗p < 0.001.
Figure 5
Figure 5
Nrf2 knockdown compromised the protective effects of QCT. (a) Representative immunoblots for PC12 cells transfected with Ctrl siRNA or Nrf2 siRNA. (b) Quantification of Nrf2 protein levels (n = 3). (c) Cell viability was assayed for transfected PC12 cells subjected to QCT (10 μM, 1 h), before being treated with MPP+ (0.5 mM, 24 h) (n = 5). (d) Representative immunoblots for SLC7A11 and GPX4 proteins from PC12 cells transfected with Nrf2 siRNA for 48 h and then treated with QCT (10 μM, 1 h) before being subjected to MPP+ (0.5 mM, 24 h). (e, f) Quantification of SLC7A11 and GPX4 protein levels (n = 3). Data are presented as the mean ± SEM. Student's t-test and one-way ANOVA followed by Tukey's post hoc test. p < 0.05, ∗∗p < 0.01, and ∗∗∗p < 0.001.
Figure 6
Figure 6
QCT attenuated behavioral disorders and protected the dopaminergic neurons in PD mouse models. (a) Diagram of the experimental procedure. Mice were intraperitoneally (i.p.) injected with MPTP (30 mg/kg/day) or saline for 5 consecutive days. Three days before treatment with MPTP, mice received QCT (60 mg/kg/day, i.p.) treatment. All animals were trained for 3 days and tested on day 12. (b) Rotarod tests were conducted for Ctrl, MPTP, and MPTP QCT groups (n = 12). (c) Open field test was conducted for Ctrl, MPTP, and MPTP QCT groups (n = 12). (d) Representative immunofluorescent staining of tyrosine hydroxylase (TH) in the substantia nigra compacta (SNc) and striatum. Scale bar = 200 μm. (e) Quantification of relative TH-neurons in SNc (n = 4). (f) Representative immunoblots of the TH protein in SN and striatum. (g, h) Quantification of TH protein levels in SNc and striatum (n = 4). Data are presented as the mean ± SEM. One-way ANOVA followed by Tukey's post hoc test. p < 0.05, ∗∗p < 0.01, and ∗∗∗p < 0.001; ns: no significant difference.
Figure 7
Figure 7
QCT inhibited ferroptosis in PD mouse models by elevating Nrf2 expressions. (a) Representative immunoblots for the Nrf2 protein in SN of Ctrl, MPTP, and MPTP QCT groups. (b) Quantification of Nrf2 proteins in SN (n = 4). (c) Representative immunoblots for SLC7A11 and GPX4 proteins in SN of Ctrl, MPTP, and MPTP QCT groups. (d, e) Quantification of SLC7A11 and GPX4 proteins in SN (n = 4). (f, g) MDA, GSH, and SOD levels in SN tissues of Ctrl, MPTP, and MPTP QCT groups (n = 4). Data are presented as mean ± SEM. One-way ANOVA followed by Tukey's post hoc test. p < 0.05, ∗∗p < 0.01, and ∗∗∗p < 0.001; ns: no significant difference.
Figure 8
Figure 8
Schematic hypothesis of the antiferroptosis effect of QCT in Parkinson's disease. MPP+- and MPTP-induced ferroptosis is involved in midbrain dopaminergic neuronal death. QCT positively regulated SLC7A11 and GPX4 protein levels by activating the Nrf2 pathway. Furthermore, QCT alleviates mitochondrial dysfunction and decreases mitochondrial ROS generation, which is a core factor for ferroptosis.

References

    1. Przedborski S. The two-century journey of Parkinson disease research. Nature Reviews. Neuroscience . 2017;18(4):251–259. doi: 10.1038/nrn.2017.25. - DOI - PubMed
    1. Dunn A. R., O'Connell K. M. S., Kaczorowski C. C. Gene-by-environment interactions in Alzheimer's disease and Parkinson's disease. Neuroscience and Biobehavioral Reviews . 2019;103:73–80. doi: 10.1016/j.neubiorev.2019.06.018. - DOI - PMC - PubMed
    1. Poewe W., Seppi K., Tanner C. M., et al. Parkinson disease. Parkinson disease. Nature Reviews Disease Primers . 2017;3(1):p. 17013. doi: 10.1038/nrdp.2017.13. - DOI - PubMed
    1. Dionisio P. A., Amaral J. D., Rodrigues C. M. P. Oxidative stress and regulated cell death in Parkinson's disease. Ageing Research Reviews . 2021;67, article 101263 doi: 10.1016/j.arr.2021.101263. - DOI - PubMed
    1. Dixon S. J., Lemberg K. M., Lamprecht M. R., et al. Ferroptosis: an iron-dependent form of nonapoptotic cell death. Cell . 2012;149(5):1060–1072. doi: 10.1016/j.cell.2012.03.042. - DOI - PMC - PubMed

MeSH terms

Substances