

Axonal architecture of the mouse inner retina revealed by second harmonic generation
- PMID: 36106183
- PMCID: PMC9463061
- DOI: 10.1093/pnasnexus/pgac160
Axonal architecture of the mouse inner retina revealed by second harmonic generation
Abstract
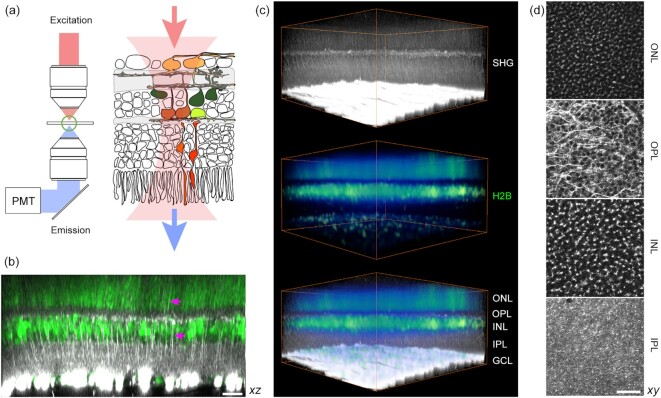
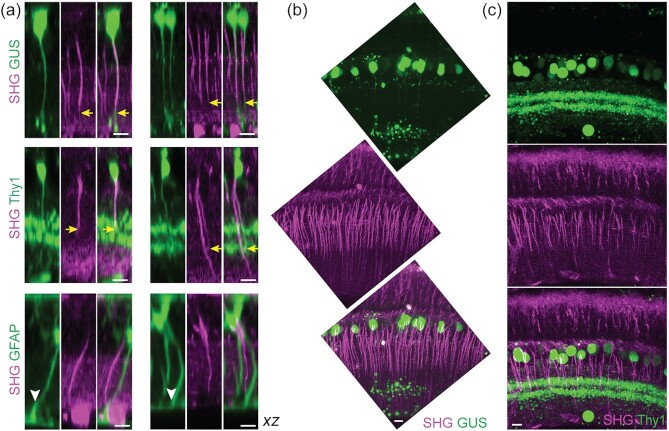
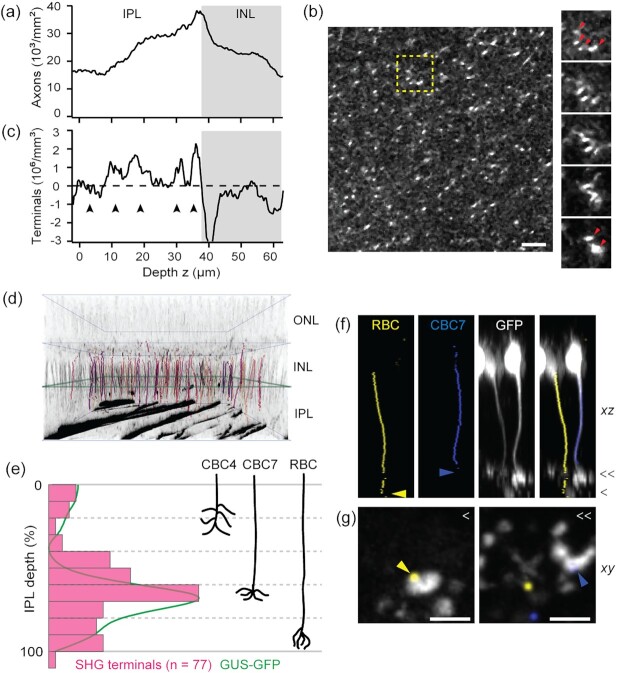
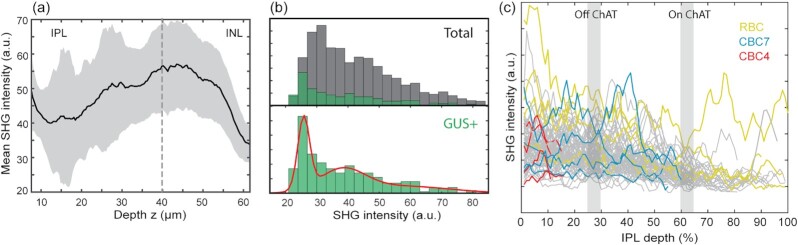
We describe a novel method for visualizing the network of axons in the unlabeled fresh wholemount retina. The intrinsic radiation of second harmonic generation (SHG) was utilized to visualize single axons of all major retinal neurons, i.e., photoreceptors, horizontal cells, bipolar cells, amacrine cells, and the retinal ganglion cells. The cell types of SHG+ axons were determined using transgenic GFP/YFP mice. New findings were obtained with retinal SHG imaging: Müller cells do not maintain uniformly polarized microtubules in the processes; SHG+ axons of bipolar cells terminate in the inner plexiform layer (IPL) in a subtype-specific manner; a subset of amacrine cells, presumably the axon-bearing types, emits SHG; and the axon-like neurites of amacrine cells provide a cytoskeletal scaffolding for the IPL stratification. To demonstrate the utility, retinal SHG imaging was applied to testing whether the inner retina is preserved in glaucoma, using DBA/2 mice as a model of glaucoma and DBA/2-Gpnmb+ as the nonglaucomatous control. It was found that the morphology of the inner retina was largely intact in glaucoma and the presynaptic compartments to the retinal ganglion cells were uncompromised. It proves retinal SHG imaging as a promising technology for studying the physiological and diseased retinas in 3D.
Keywords: amacrine cell; axon; bipolar cell; glaucoma; second harmonic generation.
© The Author(s) 2022. Published by Oxford University Press on behalf of the National Academy of Sciences.
Figures
Similar articles
-
Microtubule Imaging Reveals Cytoskeletal Deficit Predisposing the Retinal Ganglion Cell Axons to Atrophy in DBA/2J.Invest Ophthalmol Vis Sci. 2018 Nov 1;59(13):5292-5300. doi: 10.1167/iovs.18-24150. Invest Ophthalmol Vis Sci. 2018. PMID: 30383181 Free PMC article.
-
Axon-bearing amacrine cells of the macaque monkey retina.J Comp Neurol. 1989 Jun 8;284(2):275-93. doi: 10.1002/cne.902840210. J Comp Neurol. 1989. PMID: 2754037
-
Circuitry and role of substance P-immunoreactive neurons in the primate retina.J Comp Neurol. 1998 Apr 20;393(4):439-56. J Comp Neurol. 1998. PMID: 9550150
-
Synaptology of the inner plexiform layer in the anuran retina.Microsc Res Tech. 2000 Sep 1;50(5):394-402. doi: 10.1002/1097-0029(20000901)50:5<394::AID-JEMT8>3.0.CO;2-Q. Microsc Res Tech. 2000. PMID: 10941175 Review.
-
Substance P: a neurotransmitter of amacrine and ganglion cells in the vertebrate retina.Histol Histopathol. 1995 Oct;10(4):947-68. Histol Histopathol. 1995. PMID: 8574015 Review.
Cited by
-
Imaging the eye as a window to brain health: frontier approaches and future directions.J Neuroinflammation. 2024 Nov 29;21(1):309. doi: 10.1186/s12974-024-03304-3. J Neuroinflammation. 2024. PMID: 39614308 Free PMC article. Review.
-
From Soma to Synapse: Imaging Age-Related Rod Photoreceptor Changes in the Mouse with Visible Light OCT.Ophthalmol Sci. 2023 Apr 29;3(4):100321. doi: 10.1016/j.xops.2023.100321. eCollection 2023 Dec. Ophthalmol Sci. 2023. PMID: 37388138 Free PMC article.
References
-
- Badea TC, Nathans J. 2004. Quantitative analysis of neuronal morphologies in the mouse retina visualized by using a genetically directed reporter. J Comp Neurol. 480:331–351. - PubMed
-
- Siegert S, et al. 2009. Genetic address book for retinal cell types. Nat Neurosci. 12:1197–1204. - PubMed
-
- Horikawa K, Armstrong WE. 1988. A versatile means of intracellular labeling: injection of biocytin and its detection with avidin conjugates. J Neurosci Methods. 25:1–11. - PubMed
Grants and funding
LinkOut - more resources
Full Text Sources
