

Complex network analysis of volatility spillovers between global financial indicators and G20 stock markets
- PMID: 36106329
- PMCID: PMC9463059
- DOI: 10.1007/s00181-022-02290-w
Complex network analysis of volatility spillovers between global financial indicators and G20 stock markets
Abstract
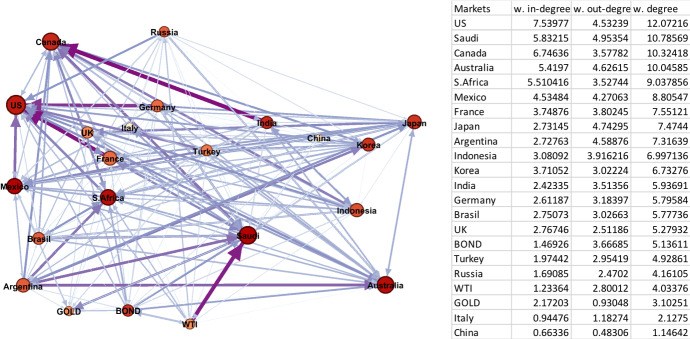
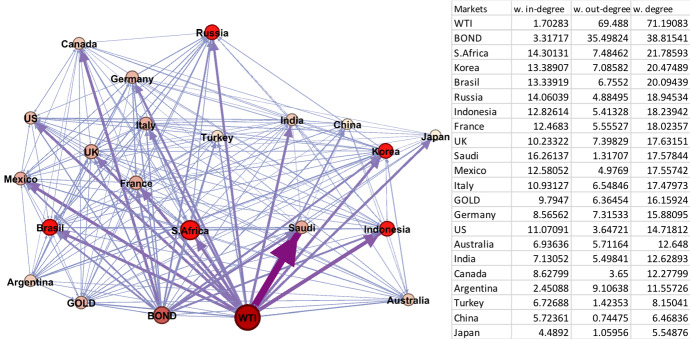
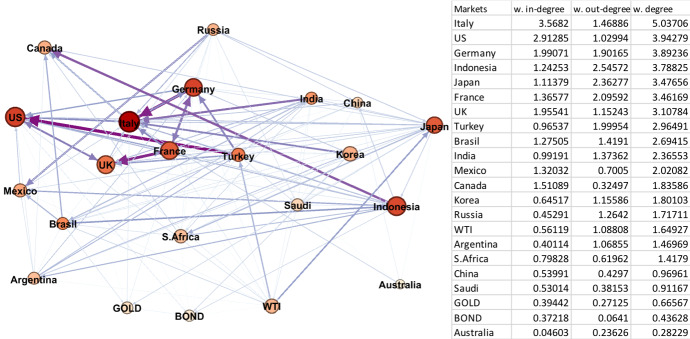
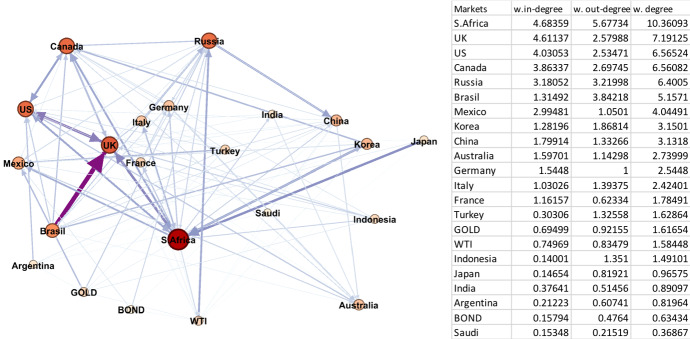
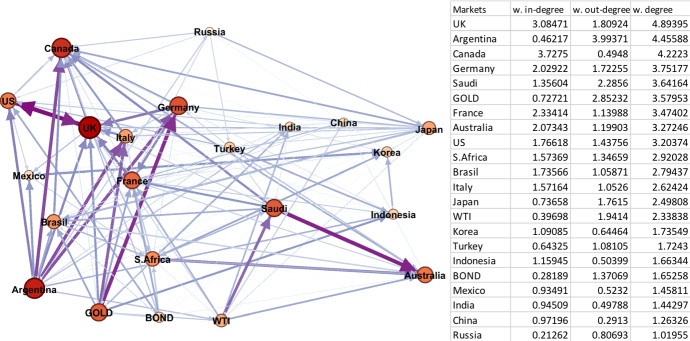
This paper analyses the dynamic transmission mechanism of volatility spillovers between key global financial indicators and G20 stock markets. To examine volatility spillover relations, we combine a bivariate GARCH-BEKK model with complex network theory. Specifically, we construct a volatility network of international financial markets utilising the spatial connectedness of spillovers (consisting of nodes and edges). The findings show that spillover relations between global variables and G20 markets vary significantly across five identified sub-periods. Notably, networks are much denser in crisis periods compared to non-crisis periods. In comparing two crisis periods, Global Financial Crisis (2008) and COVID-19 Crisis (2020) periods, the network statistics suggest that volatility spillovers in the latter period are more transitive and intense than the former. This suggests that financial volatility spreads more rapidly and directly through key financial indicators to the G20 stock markets. For example, oil and bonds are the largest volatility senders, while the markets of Saudi Arabia, Russia, South Africa, and Brazil are the main volatility receivers. In the former crisis, the source of financial volatility concentrates primarily in the USA, Australia, Canada, and Saudi Arabia, which are the largest volatility senders and receivers. China emerges as generally the least sensitive market to external volatility.
Keywords: Complex network theory; G20 stock markets; GARCH-BEKK; Global financial indicators; Volatility spillover.
© The Author(s) 2022.
Conflict of interest statement
Conflict of interestAll authors declare no conflict of interest.
Figures
Similar articles
-
Key market identification, mechanism transmission, and extreme shock during the risk spillover process: an empirical study of the G20 FOREX markets.Empir Econ. 2023 May 22:1-34. doi: 10.1007/s00181-023-02436-4. Online ahead of print. Empir Econ. 2023. PMID: 37361950 Free PMC article.
-
The source of financial contagion and spillovers: An evaluation of the covid-19 pandemic and the global financial crisis.PLoS One. 2022 Jan 14;17(1):e0261835. doi: 10.1371/journal.pone.0261835. eCollection 2022. PLoS One. 2022. PMID: 35030202 Free PMC article.
-
Price-switching spillovers between gold, oil, and stock markets: Evidence from the USA and China during the COVID-19 pandemic.Resour Policy. 2021 Oct;73:102217. doi: 10.1016/j.resourpol.2021.102217. Epub 2021 Jul 6. Resour Policy. 2021. PMID: 36567727 Free PMC article.
-
Contagion effect of cryptocurrency on the securities market: a study of Bitcoin volatility using diagonal BEKK and DCC GARCH models.SN Bus Econ. 2022;2(6):57. doi: 10.1007/s43546-022-00219-0. Epub 2022 May 20. SN Bus Econ. 2022. PMID: 35615335 Free PMC article. Review.
-
Testing volatility and relationship among BRICS stock market returns.SN Bus Econ. 2022;2(8):111. doi: 10.1007/s43546-022-00267-6. Epub 2022 Jul 28. SN Bus Econ. 2022. PMID: 35919285 Free PMC article. Review.
References
-
- An S, Gao X, An H, An F, Sun Q, Liu S. Windowed volatility spillover effects among crude oil prices. Energy. 2020;200:117521. doi: 10.1016/j.energy.2020.117521. - DOI
-
- An H, Zhong W, Chen Y, Li H, Gao X. Features and evolution of international crude oil trade relationships: a trading-based network analysis. Energy. 2014;74:254–259. doi: 10.1016/j.energy.2014.06.095. - DOI
-
- Bollerslev T. Modelling the coherence in short-run nominal exchange rates: a multivariate Generalized ARCH model. Rev Econ Stat. 1990;72:498–505. doi: 10.2307/2109358. - DOI
-
- Bollerslev T, Engle RF, Wooldridge JM. A capital asset pricing model with time varying covariances. J Polit Econ. 1988;96:116–131. doi: 10.1086/261527. - DOI
-
- Demirer M, Diebold FX, Liu L, Yilmaz K. Estimating global bank network connectedness. J Appl Economet. 2018;33:1–15. doi: 10.1002/jae.2585. - DOI
LinkOut - more resources
Full Text Sources