. 2022 Oct;36(10):e22546.
doi: 10.1096/fj.202200135RR.

The intestine is a major contributor to circulating succinate in mice

Affiliations

The intestine is a major contributor to circulating succinate in mice

Wenxin Tong et al. FASEB J. 2022 Oct.

Abstract

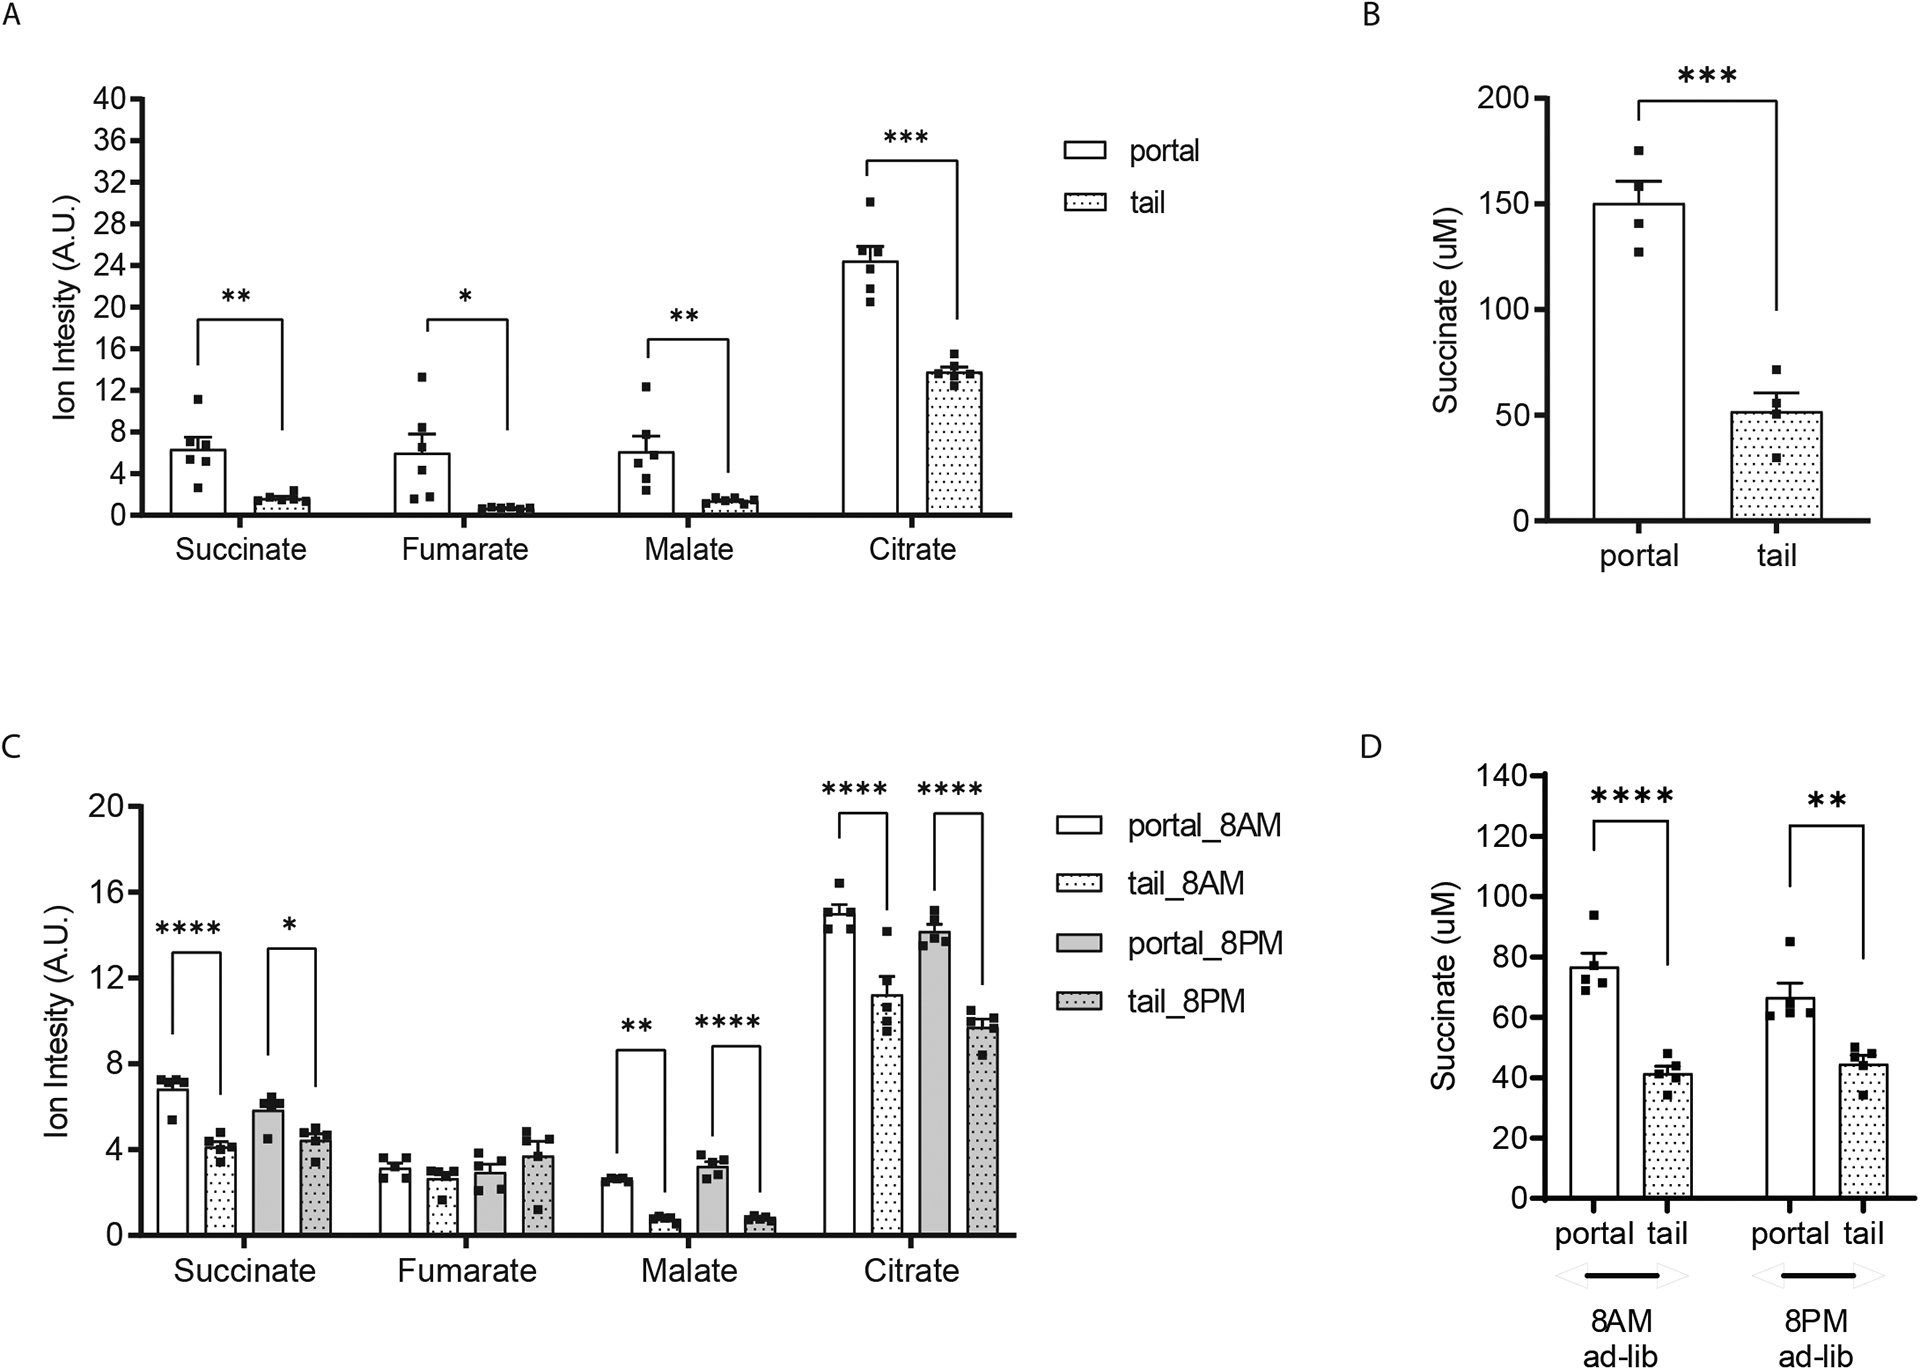
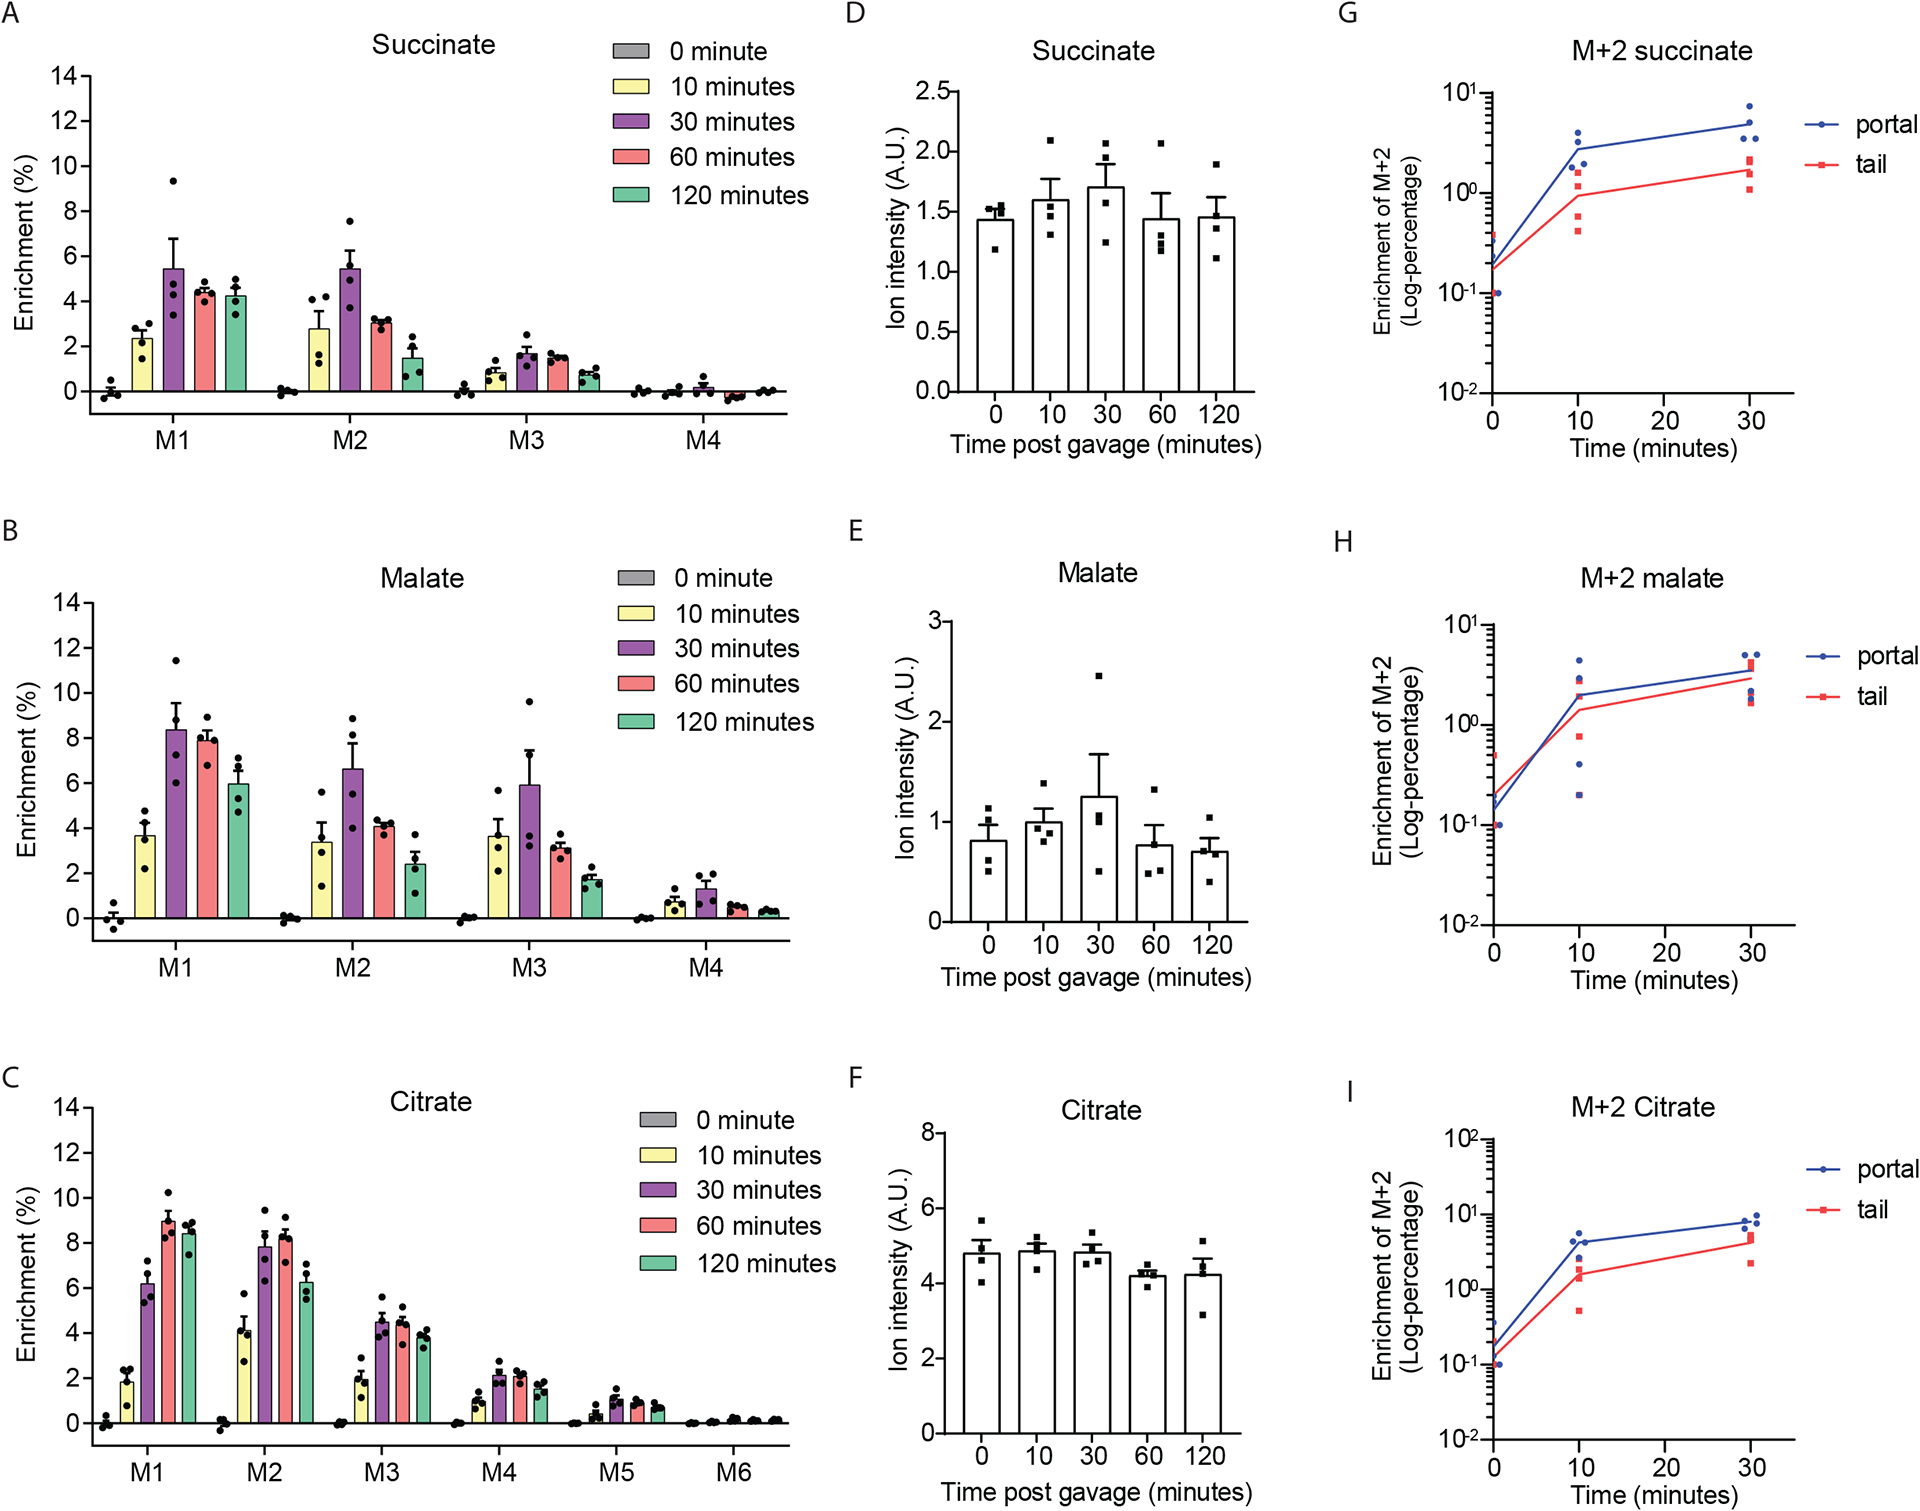
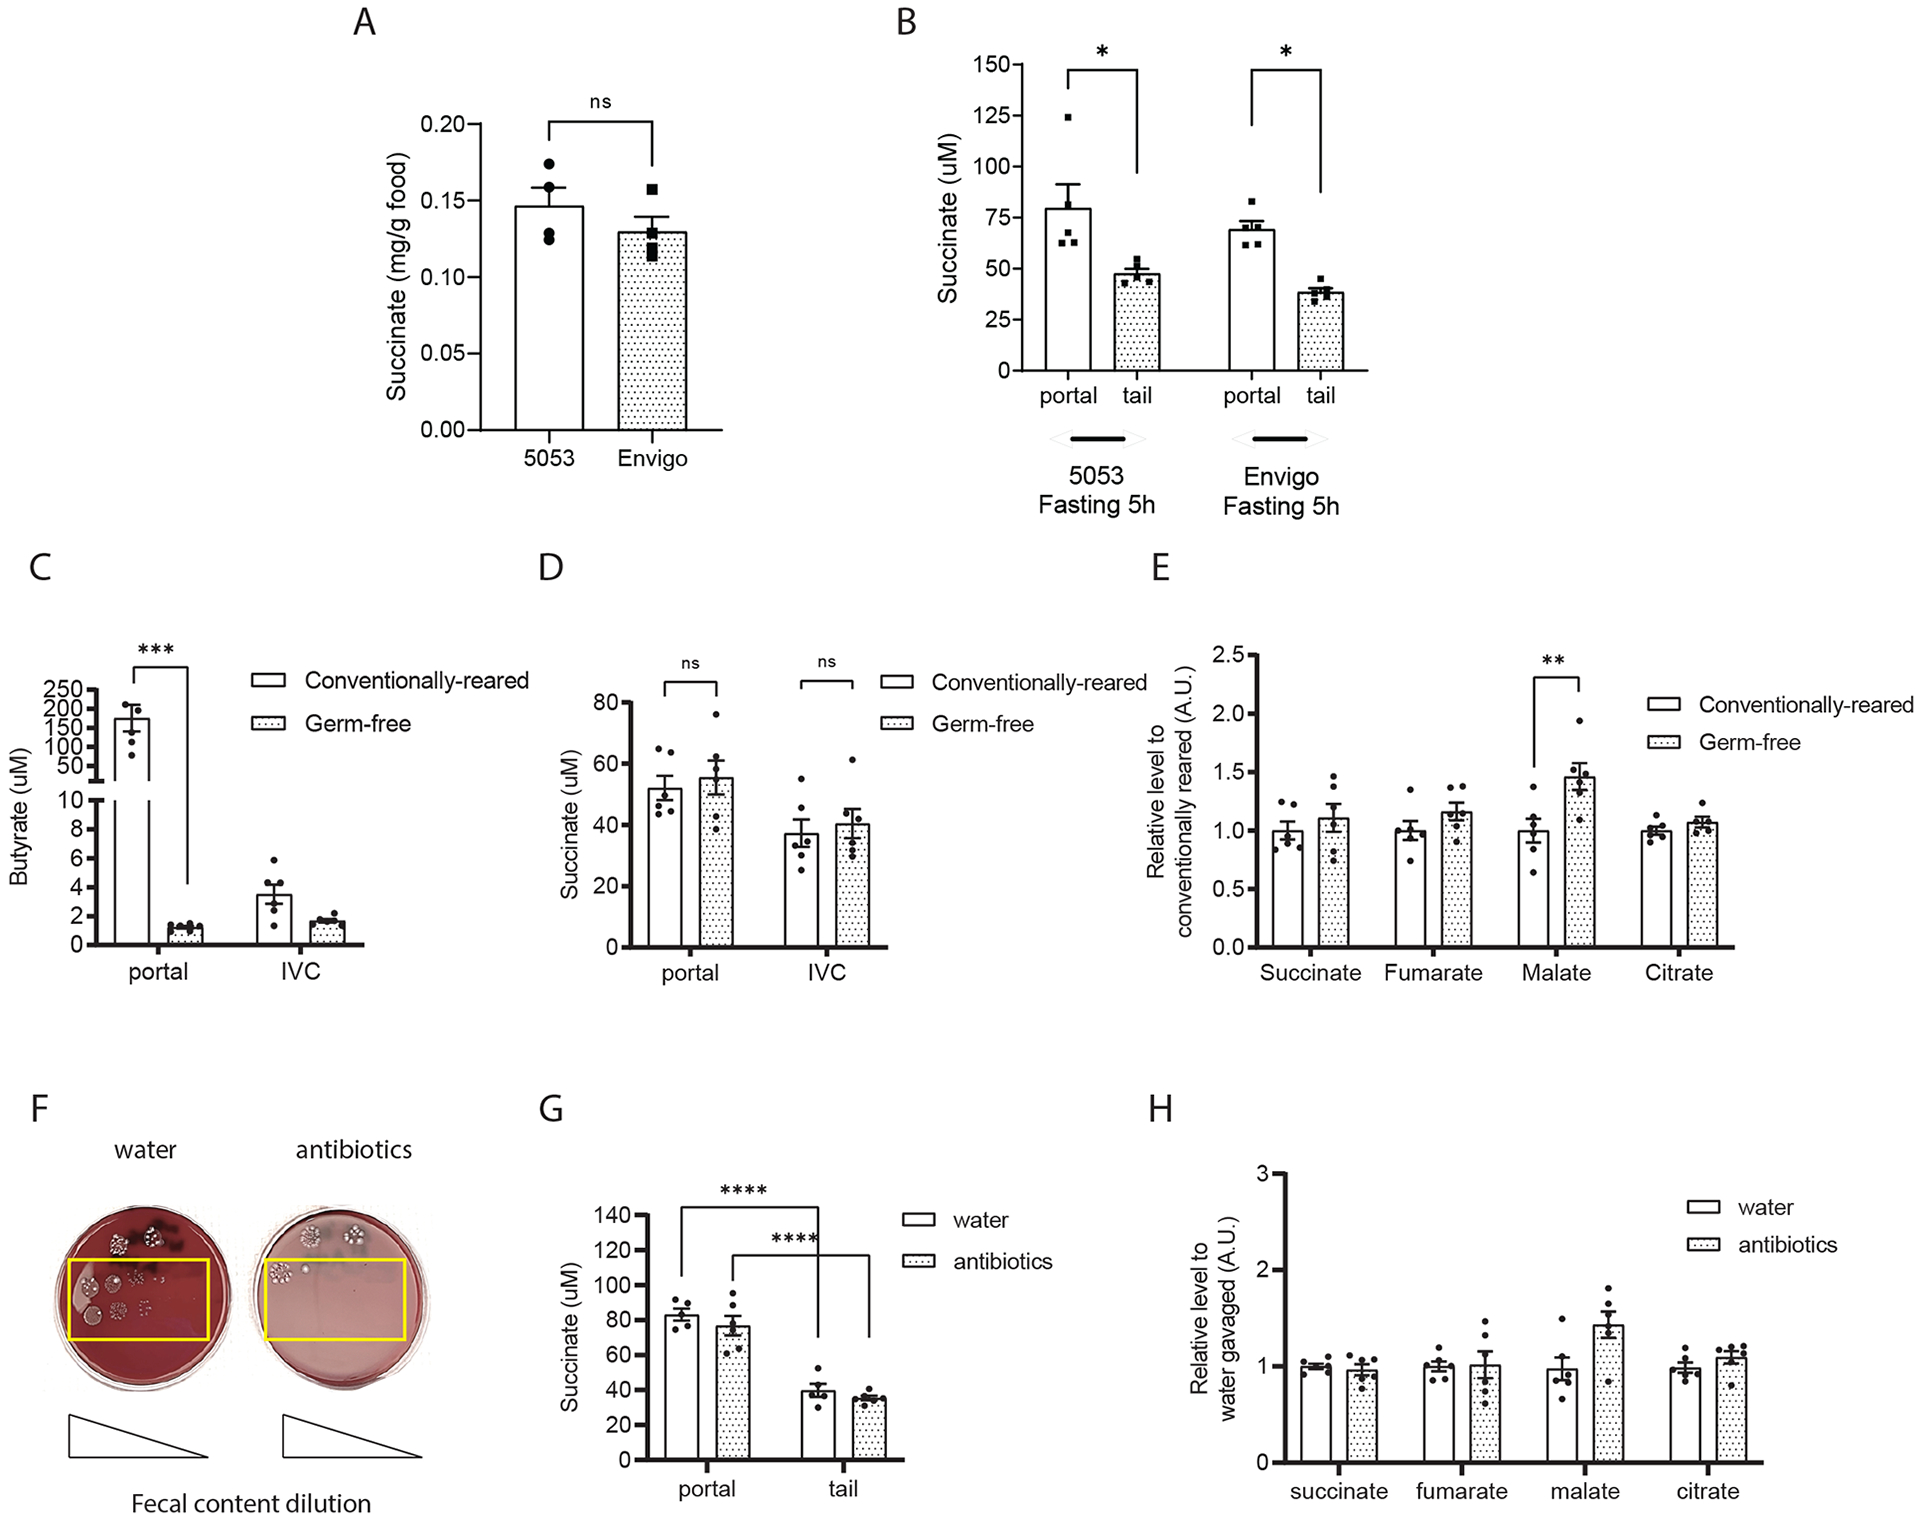
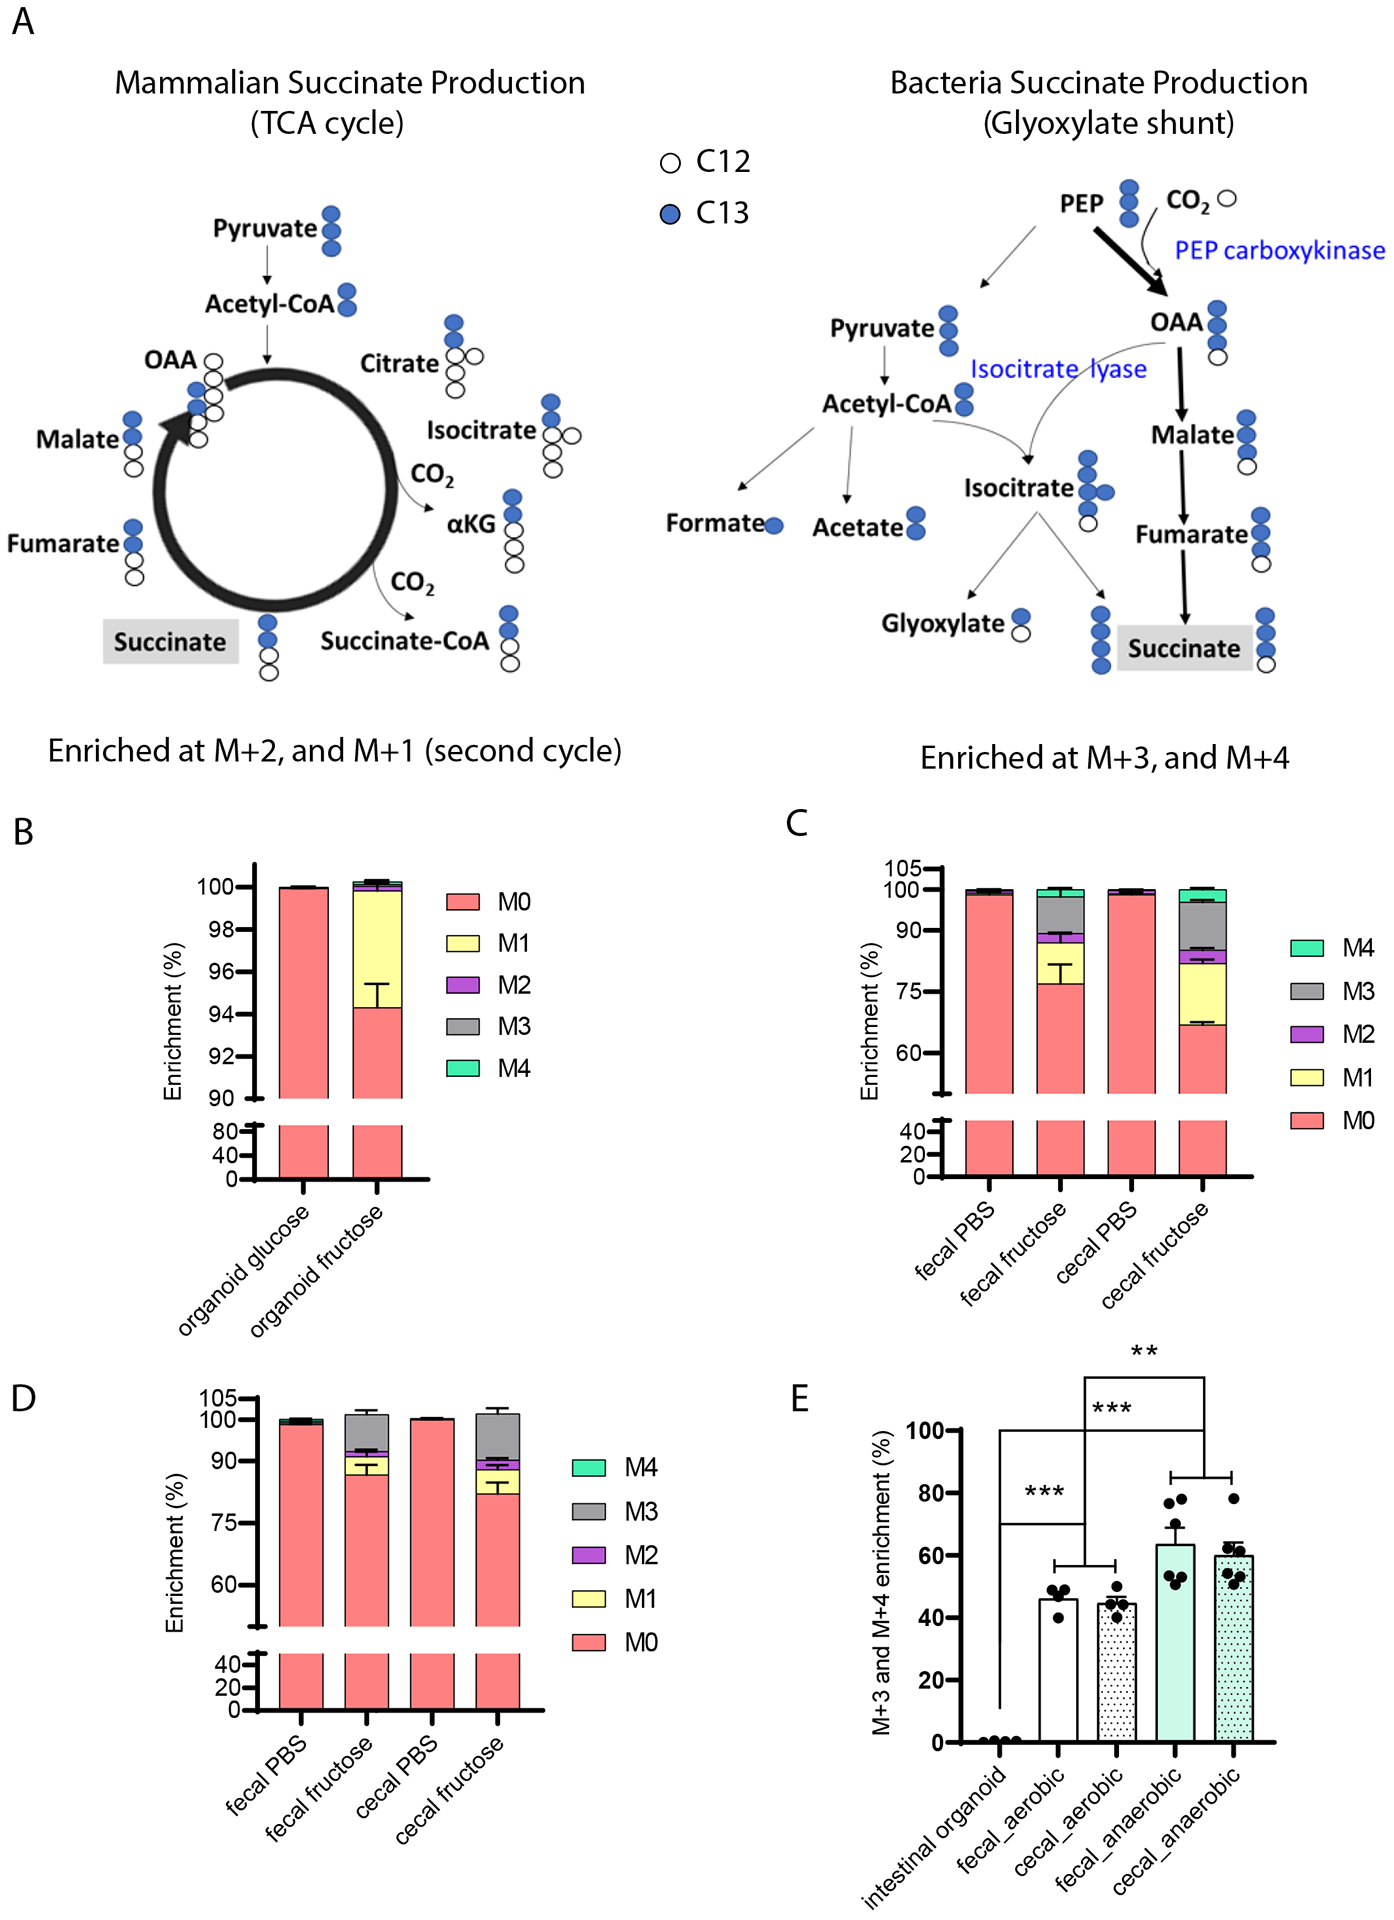
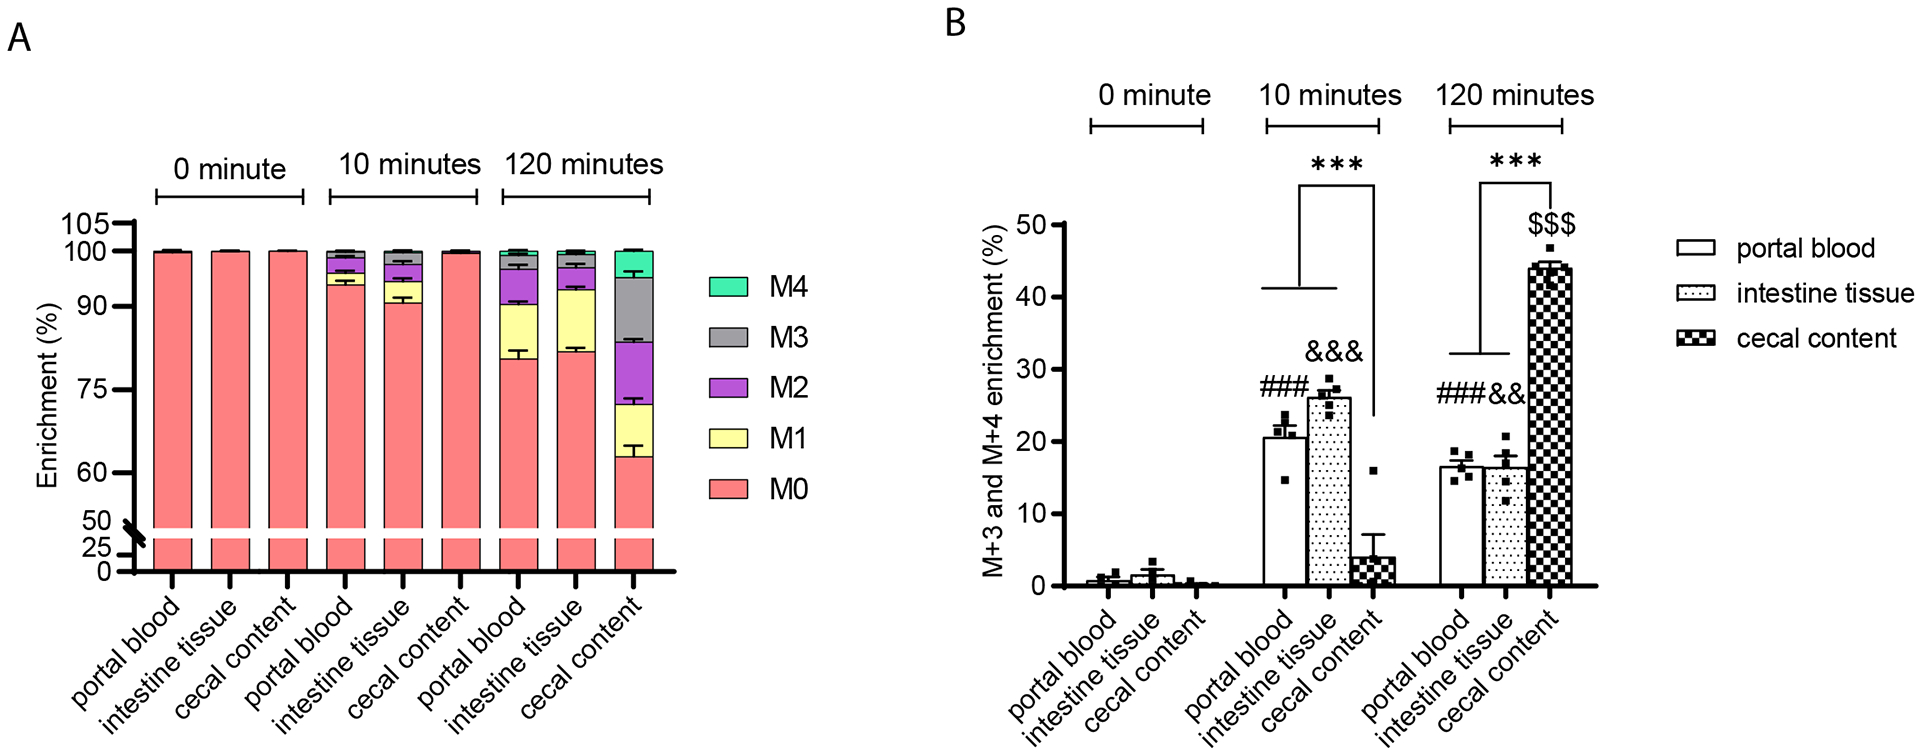
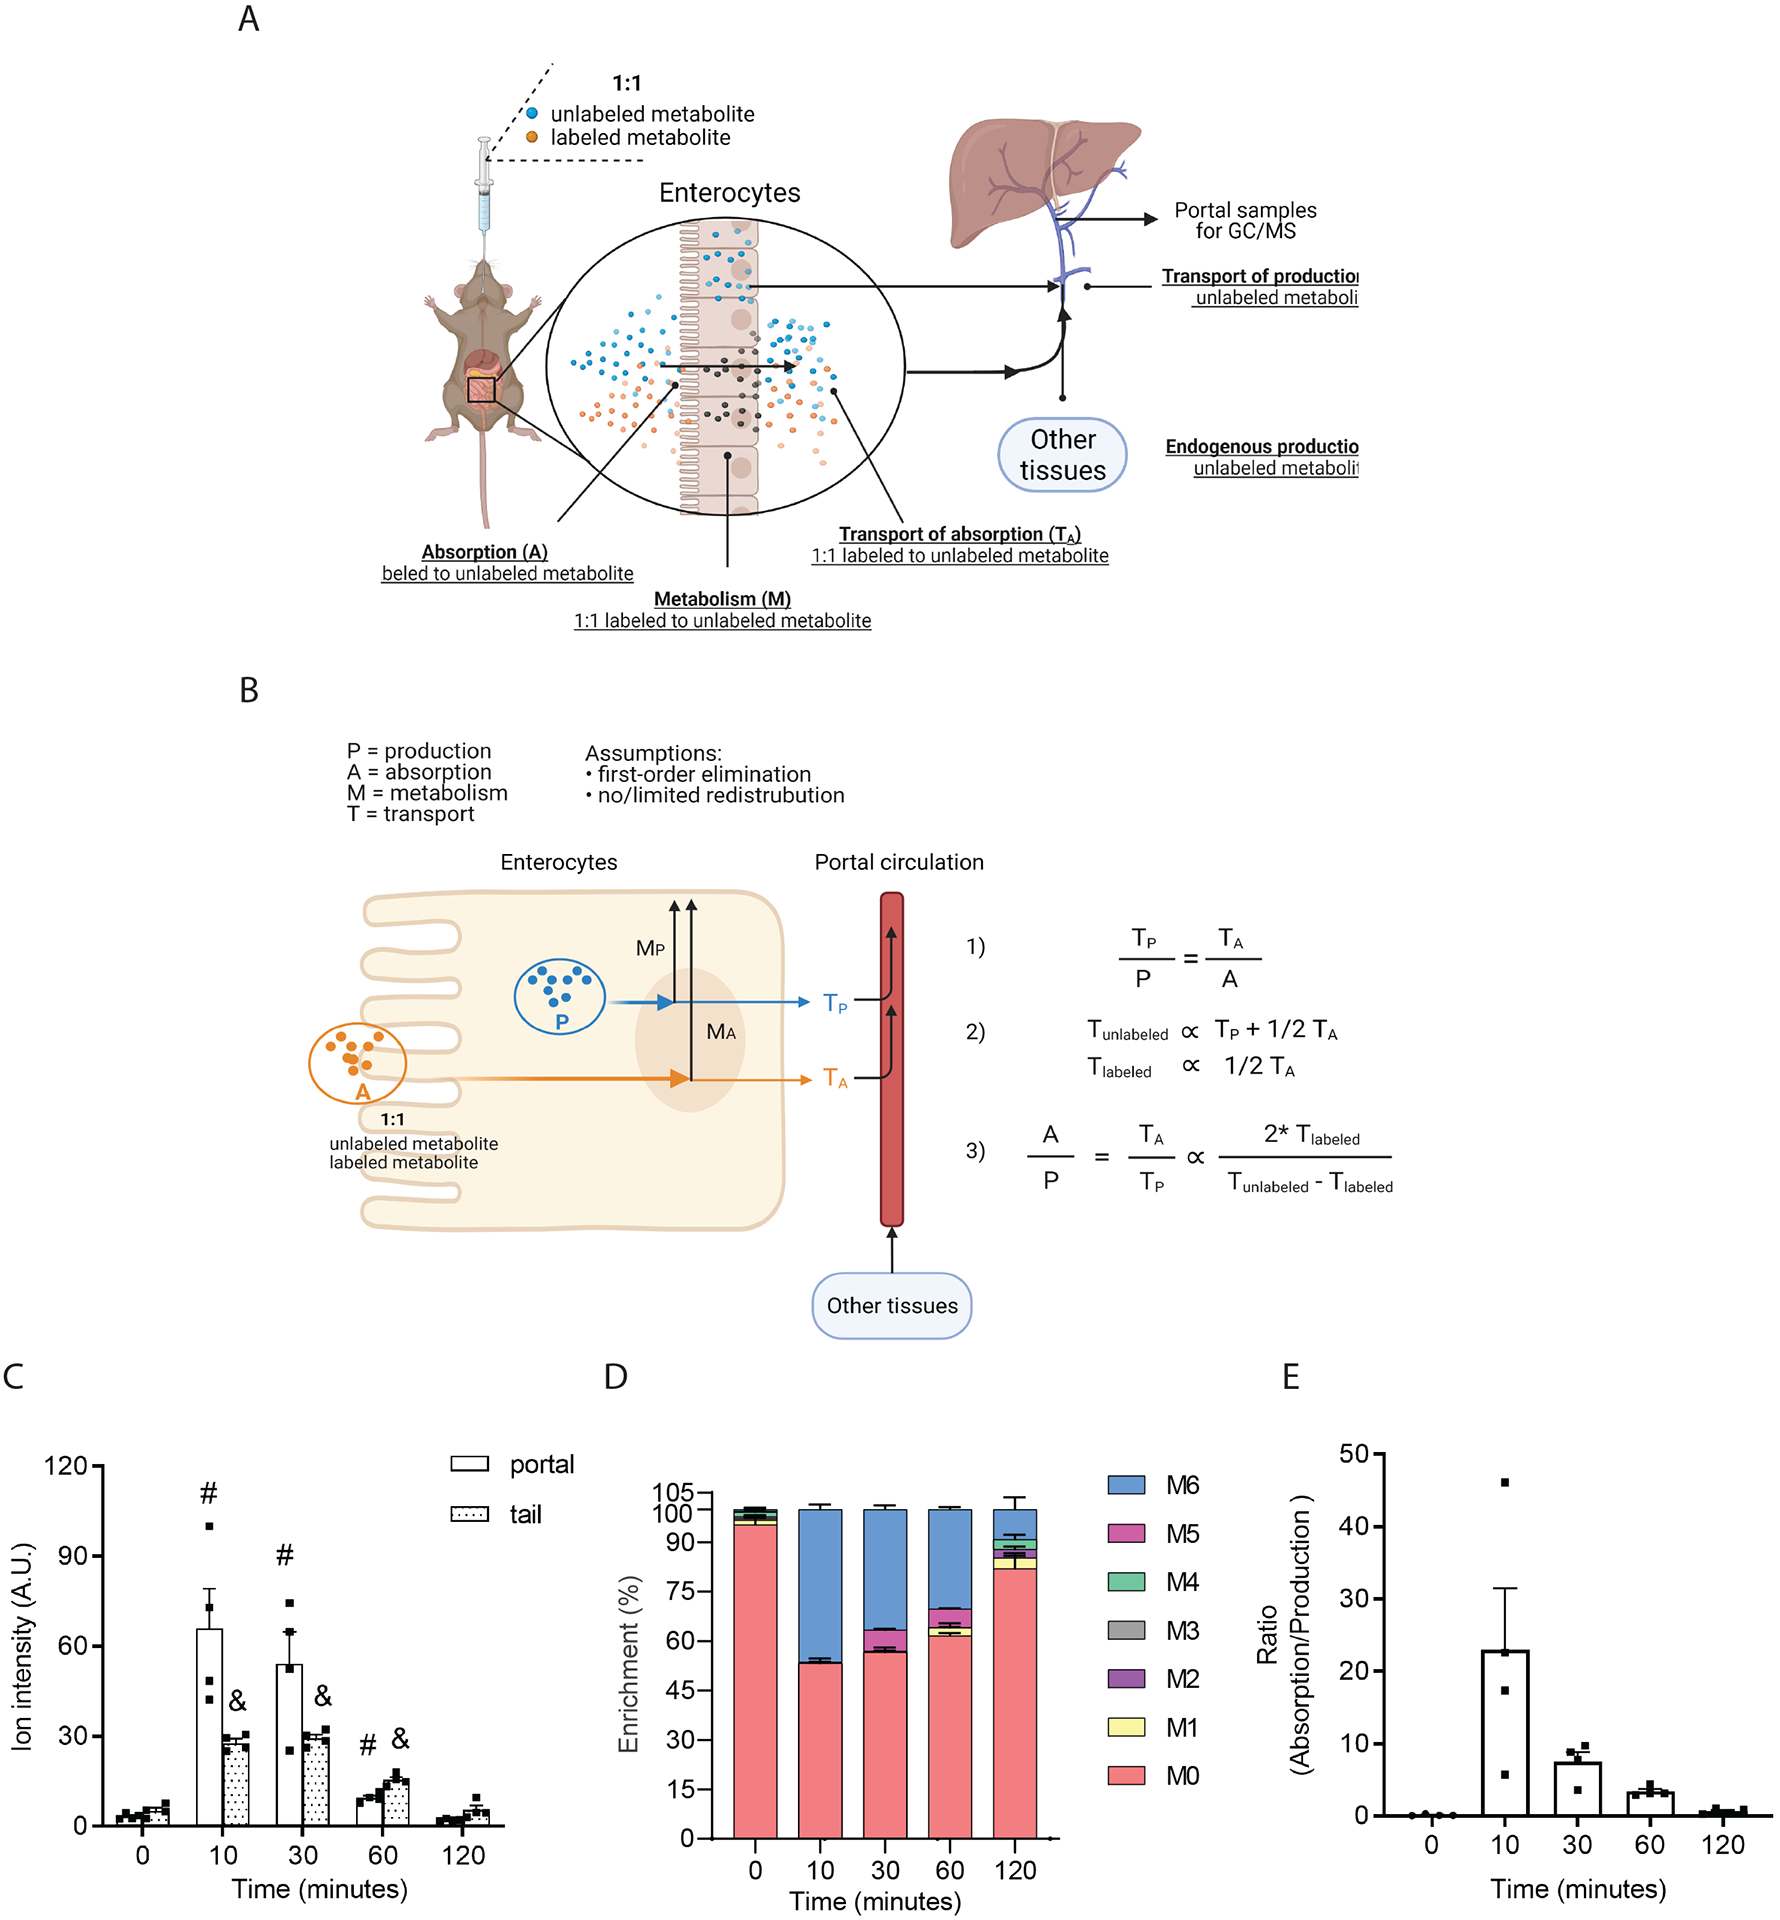
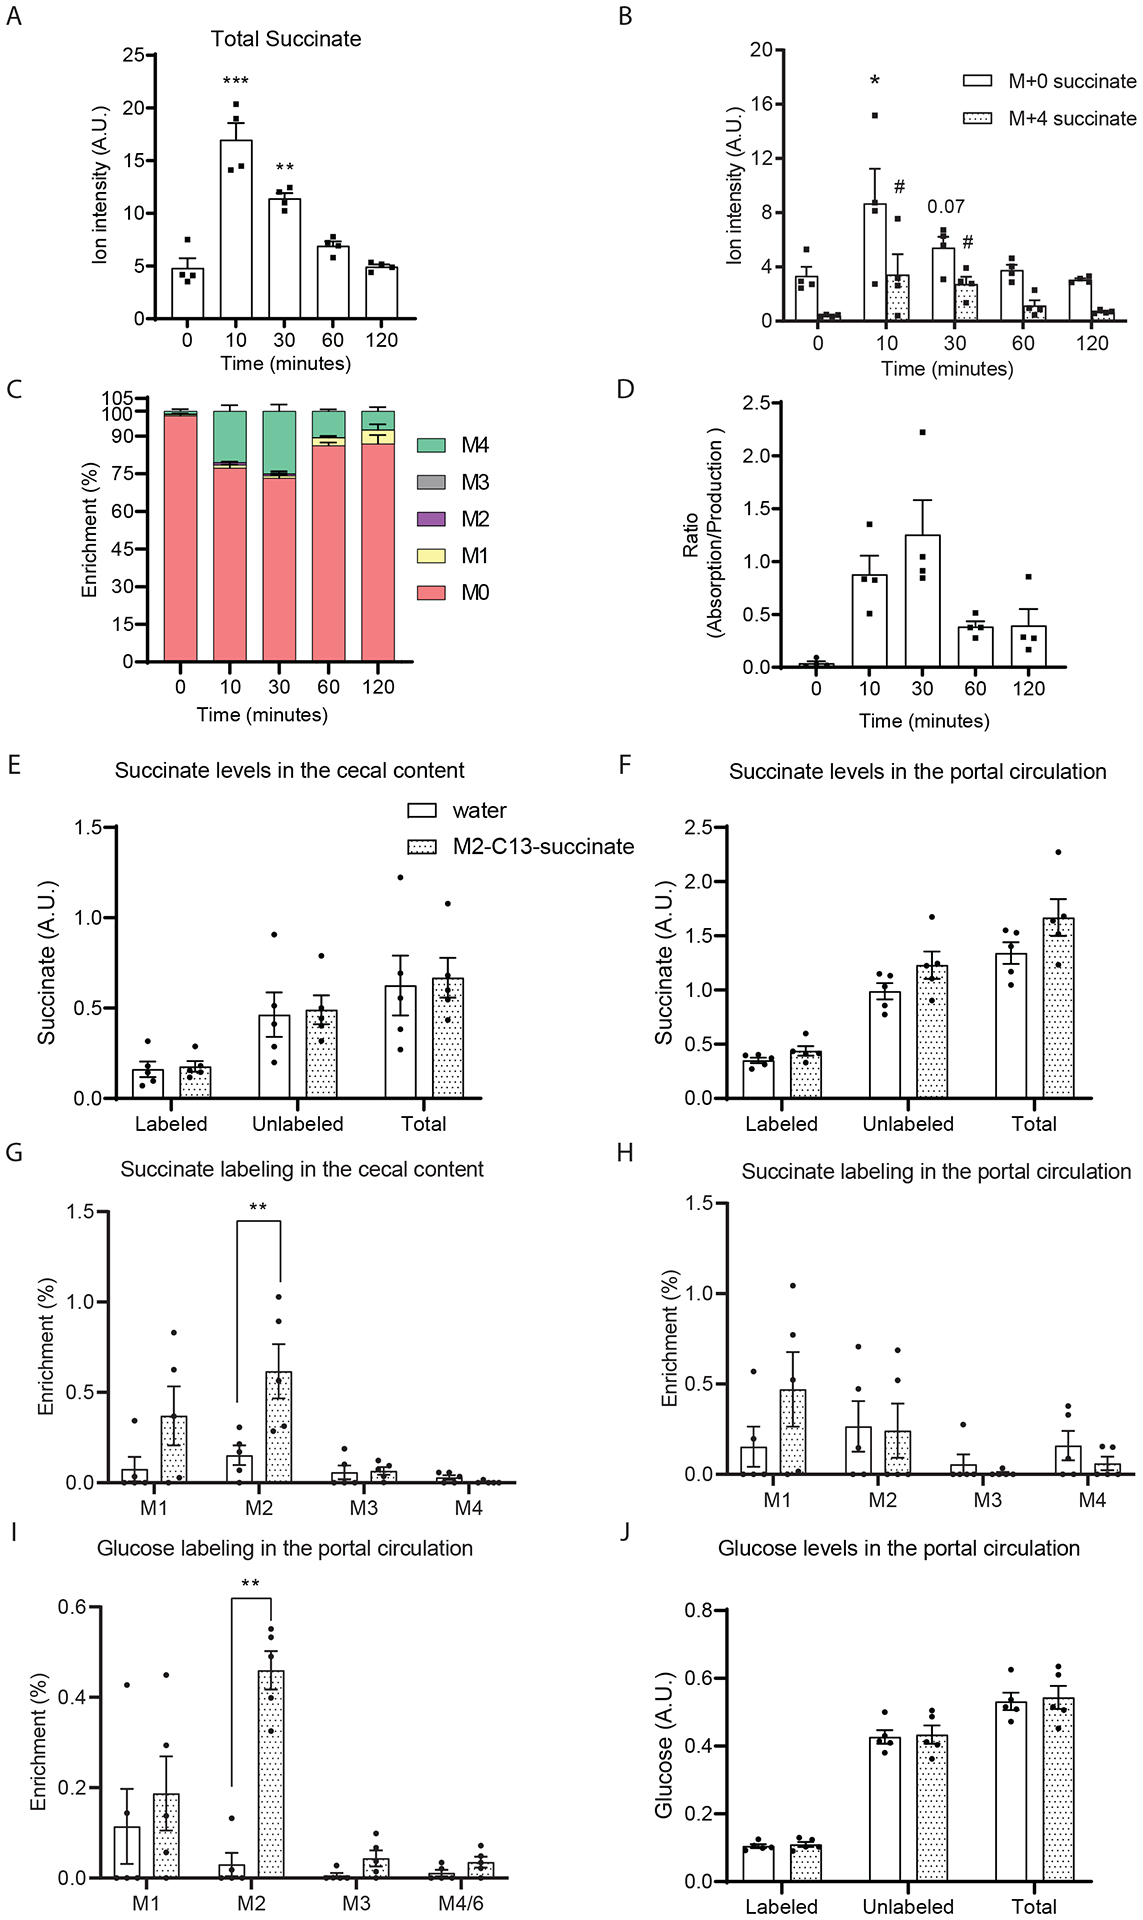
The tricarboxylic acid (TCA) cycle is the epicenter of cellular aerobic metabolism. TCA cycle intermediates facilitate energy production and provide anabolic precursors, but also function as intra- and extracellular metabolic signals regulating pleiotropic biological processes. Despite the importance of circulating TCA cycle metabolites as signaling molecules, the source of circulating TCA cycle intermediates remains uncertain. We observe that in mice, the concentration of TCA cycle intermediates in the portal blood exceeds that in tail blood indicating that the gut is a major contributor to circulating TCA cycle metabolites. With a focus on succinate as a representative of a TCA cycle intermediate with signaling activities and using a combination of gut microbiota depletion mouse models and isotopomer tracing, we demonstrate that intestinal microbiota is not a major contributor to circulating succinate. Moreover, we demonstrate that endogenous succinate production is markedly higher than intestinal succinate absorption in normal physiological conditions. Altogether, these results indicate that endogenous succinate production within the intestinal tissue is a major physiological source of circulating succinate. These results provide a foundation for an investigation into the role of the intestine in regulating circulating TCA cycle metabolites and their potential signaling effects on health and disease.

Keywords: TCA cycle intermediates; circulating biomarkers; intestine; succinate.


Figures

Figure 1.
Figure 1.. The gut is a contributor to circulating TCA cycle intermediates.
Relative quantification of TCA cycle metabolites (A) and absolute quantification of succinate (B) in portal versus tail plasma samples from 8-weeks old, male mice after 5 hours food removal. Relative quantification of TCA cycle metabolites (C) and absolute quantification of succinate (D) in portal versus tail plasma samples from ad-lib fed 8-weeks old, male mice on either 8AM or 8PM. Norvaline and D4-sodium succinate were used as internal standards for relative and absolute quantification measurement by GC/MS, respectively (n=6 per group in panel A and B; n=5 per group in panel C and D). * p<0.05; ** p<0.01; *** p<0.001. Analysis in A and B performed via paired student t-test. Analysis in panel C and D performed via two-way ANOVA Bonferroni analysis for post hoc comparisons.
Figure 2.
Figure 2.. Circulating levels of TCA cycle intermediates tend to remain relatively constant.
Enrichment (A, B, C) and relative quantification (D, E, F) of portal TCA cycle intermediates after oral-gavage in 8-weeks old male mice with U-C13-fructose (0.48 g/Kg body weight, n=4 per group). Enrichment of the M+2 TCA cycle intermediates (D, E, F) in the plasma from the portal vein versus tail vein from the same group. Time to log-transformed enrichment of the M+2 TCA cycle intermediates plots of the first 3 time points (D, E, F). Every number at each time points was added with 0.05 in panel D to F to avoid log-transform 0 which will lead to mathematic error. Data represent means ± SEM. Analysis performed via one-way ANOVA and Fisher’s LSD for post-hoc analysis comparing to baseline (0 minutes).
Figure 3.
Figure 3.. Intestinal microbiota are not a major source of circulating succinate.
(A) Succinate content in normal chow diets: Lab Diet 5053 (conventionally reared mice) and Envigo 2020SX (germ-free mice). (B) Succinate levels in the plasma from portal and tail vein of wildtype 8-week male mice fed on either Lab Diet 5053 and Envigo 2020SX for a week. Absolute quantification of butyrate (C) and succinate (D) in plasma from the portal vein versus inferior vena cava of 12-week-old germ-free male mice versus their conventionally reared mice. Relative quantification of portal TCA cycle intermediates levels in the germ-free and conventionally reared mice (E). Colony formation on the blood agar from fecal content harvested from 8-weeks old, male mice after treated with either water or antibiotic cocktails for 5 days (F). Absolute levels of portal versus tail succinate levels (G) and relative levels of portal TCA cycle intermediates levels (H) in the water versus antibiotic cocktails treated mice. Butyrate levels were measured by LC-MS/MS using D7-butyrate as internal standard. TCA cycle metabolites and absolute succinate levels were measured by GC/MS using norvaline and/or D4-succinate as internal standard (n=6 per group). Data represent means ± SEM. * p<0.05; ** p<0.01; *** p<0.001. Analysis in A and B performed via paired student t-test. Analysis in C to H were analyzed by two-way ANOVA and Bonferroni analysis for post hoc comparisons.
Figure 4.
Figure 4.. Intestinal organoids compared with cecal and fecal contents generate distinct succinate labeling patterns from labeled precursors.
(A) Theoretical isotope-labeling patterns of succinate produced from C13-labeled three carbon substrates in mammalian cells versus bacteria. Measured labeling pattern in (B) mammalian cells and (C, D) microbial enriched samples. Intestinal crypts and fresh cecal and fecal contents were harvested from 8-weeks-old male mice. Intestinal organoids were differentiated into enterocytes prior to treatment with 100 mM U-C13-fructose for 24 hours (n=3 per group). Freshly harvested cecal and fecal contents were cultured with 100 mM U-C13-fructose for 30 minutes in aerobic (C, n=4 per group) or anaerobic condition (D, n=6 per group). (E) Quantification of the ratio of M+3 and M+4 succinate to total labeled succinate in cultured intestinal organoids and cecal/fecal contents described in (B) and (C, D). Data represent means ± SEM. * p<0.05; ** p<0.01; *** p<0.001. Data were analyzed by two-way ANOVA and Bonferroni analysis for post hoc comparisons.
Figure 5.
Figure 5.. The succinate labelling pattern in portal plasma is similar to that in intestinal tissue while distinct from that in the cecal contents following gavage with U-C13-fructose.
(A) The enrichment and (B) the ratio of M+3 plus M+4 to total labeled succinate in the portal plasma, intestinal tissue, and cecal contents after gavage of 8-weeks-old male mice with U-C13-fructose (4g/Kg body weight) (n=4 per group at each time point). Data represent means ± SEM. * p<0.05; ** p<0.01; *** p<0.001. Data were analyzed by two-way ANOVA and Tukey’s test was applied for post hoc comparisons. # portal plasma comparisons across time points, & intestinal tissue comparisons across time points, $ cecal content comparisons across time points, * comparisons between tissues within time points.
Figure 6.
Figure 6.. Relative quantification of the ratio of intestinal fructose absorption to endogenous fructose production.
Diagram of the method (A) and model (B) for estimating the ratio of fructose absorption to fructose production. Quantification of fructose (C) and its enrichment (D) in portal plasma after gavage of 1:1 U-C13 fructose and unlabeled fructose (0.48 g/Kg body weight, n=4 per group). 2DG was used as internal standard. (E) The estimated ratio of intestinal fructose absorption to endogenous fructose production. Data represent means ± SEM. * p<0.05; ** p<0.01; *** p<0.001. Data in panel A were analyzed by two-way ANOVA with time and location as co-variable Bonferroni analysis for post hoc comparisons; # portal comparisons between time points, & tail comparisons between time points, * comparisons between tail and portal. Data in panel C were analyzed by one-way ANOVA and Fisher’s LSD for post-hoc analysis of the ratios of M+6 to M+0 fructose between baseline (0 minutes) and time points post fructose administration (10, 30, 60, 120 minutes).
Figure 7.
Figure 7.. The intestinal absorption of succinate is limited.
(A) Total succinate ion counts and (B) M+0 and M+4 isotopomers ion counts and (C) enrichment in portal plasma after gavage of 1:1 D-4 succinate and unlabeled succinate (1.46 g sodium succinate/Kg body weight). Norvaline was used as internal standard. (D) The estimated ratio of intestinal absorption to endogenous production of succinate. (n=4 at each time point). Measured succinate levels (E, F) and labeling (G, H) in the cecal content and portal circulation after supplementing drinking water with 0.5% 2,3-C13-sodium succinate for 3 days. Glucose labeling (I) and quantification (J) were also measured by GC/MS. Data represent means ± SEM. * or # p<0.05; ** or ## p<0.01; *** or ### p<0.001. In panel A to D, data were analyzed by one-way ANOVA and Fisher’s LSD for post-hoc analysis between baseline (0 minutes) and time points post D4-succinate administration; In panel B, * indicates the comparison of M+0 succinate and # indicates the comparison of M+4 succinate with the zero-time point. In panel E to F, data were analyzed by two-way ANOVA and Tukey’s test was applied for post hoc comparison.
Figure 8.
Figure 8.. Succinate is a poor substrate for intestinal glucose production.
8-week old wildtype mice were oral gavage with the same molar concentration of water, U-C13-fructose or 2,3-C13-sodium succinate after 5 hours food removal. (A) Glucose labeling in the plasma samples from portal vein or tail vein was measured by GC/MS. Average carbon 13 incorporation and adjusted carbon 13 incorporation were calculated. Data represent means ± SEM. * p<0.05; ** p<0.01; *** p<0.001. Data were analyzed by two-way ANOVA and Tukey’s test was applied for post hoc comparison.

References

    1. Owen OE, Kalhan SC, and Hanson RW (2002) The key role of anaplerosis and cataplerosis for citric acid cycle function. The Journal of biological chemistry 277, 30409–30412 - PubMed
    1. He W, Miao FJ, Lin DC, Schwandner RT, Wang Z, Gao J, Chen JL, Tian H, and Ling L (2004) Citric acid cycle intermediates as ligands for orphan G-protein-coupled receptors. Nature 429, 188–193 - PubMed
    1. Toma I, Kang JJ, Sipos A, Vargas S, Bansal E, Hanner F, Meer E, and Peti-Peterdi J (2008) Succinate receptor GPR91 provides a direct link between high glucose levels and renin release in murine and rabbit kidney. The Journal of clinical investigation 118, 2526–2534 - PMC - PubMed
    1. Lampropoulou V, Sergushichev A, Bambouskova M, Nair S, Vincent EE, Loginicheva E, Cervantes-Barragan L, Ma X, Huang SC, Griss T, Weinheimer CJ, Khader S, Randolph GJ, Pearce EJ, Jones RG, Diwan A, Diamond MS, and Artyomov MN (2016) Itaconate Links Inhibition of Succinate Dehydrogenase with Macrophage Metabolic Remodeling and Regulation of Inflammation. Cell metabolism 24, 158–166 - PMC - PubMed
    1. Rubic T, Lametschwandtner G, Jost S, Hinteregger S, Kund J, Carballido-Perrig N, Schwärzler C, Junt T, Voshol H, Meingassner JG, Mao X, Werner G, Rot A, and Carballido JM (2008) Triggering the succinate receptor GPR91 on dendritic cells enhances immunity. Nature immunology 9, 1261–1269 - PubMed

Publication types

LinkOut - more resources