. 2023 Feb 9;223(2):iyac128.
doi: 10.1093/genetics/iyac128.

Archetypes of inflorescence: genome-wide association networks of panicle morphometric, growth, and disease variables in a multiparent oat population

Affiliations

Archetypes of inflorescence: genome-wide association networks of panicle morphometric, growth, and disease variables in a multiparent oat population

Craig H Carlson et al. Genetics. .

Abstract

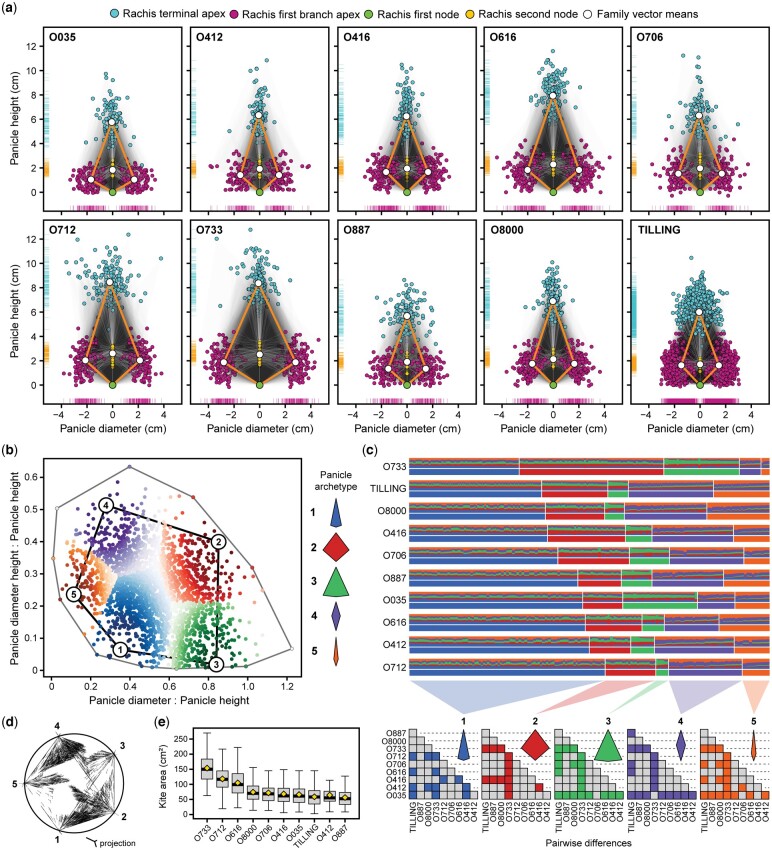
There is limited information regarding the morphometric relationships of panicle traits in oat (Avena sativa) and their contribution to phenology and growth, physiology, and pathology traits important for yield. To model panicle growth and development and identify genomic regions associated with corresponding traits, 10 diverse spring oat mapping populations (n = 2,993) were evaluated in the field and 9 genotyped via genotyping-by-sequencing. Representative panicles from all progeny individuals, parents, and check lines were scanned, and images were analyzed using manual and automated techniques, resulting in over 60 unique panicle, rachis, and spikelet variables. Spatial modeling and days to heading were used to account for environmental and phenological variances, respectively. Panicle variables were intercorrelated, providing reproducible archetypal and growth models. Notably, adult plant resistance for oat crown rust was most prominent for taller, stiff stalked plants having a more open panicle structure. Within and among family variance for panicle traits reflected the moderate-to-high heritability and mutual genome-wide associations (hotspots) with numerous high-effect loci. Candidate genes and potential breeding applications are discussed. This work adds to the growing genetic resources for oat and provides a unique perspective on the genetic basis of panicle architecture in cereal crops.

Keywords: Avena; GWAS; NAM population; Plant Genetics and Genomics; TILLING population; archetype analysis; high-throughput phenotyping; image analysis; panicle; plant architecture; spikelet.


Conflict of interest statement

Conflicts of interest: None declared.

Figures

Fig. 1.
Fig. 1.
Morphometric variables and pairwise relationships. Illustrations (a) of panicle, rachis, and spikelet morphometric variables derived from panicle images. Pearson pairwise correlation matrix (b) of variables used in GWAS and (c) PCA biplot of the first 2 PCs and % variance explained by each. The size and intensity of each filled circle in the correlation matrix indicates the strength and direction of the relationship (P > 0.05 are not shown), respectively, as indicated in the legend.
Fig. 2.
Fig. 2.
Archetypal analysis. Overlapping panicle kite models (a) of genotypes from the O × S and TILLING populations. The x-axis positions of lower rachis branch apex, terminal rachis apex, first rachis node, and second rachis node are scaled by the first rachis node. Large points connected by segments (panicle kite model) each represent family means of corresponding variables. Scatterplot of (b) panicle diameter (x-axis) and panicle diameter height (y-axis) ratios with panicle height of all oat lines included in this study. Panicle archetype proportions (c) by family individual, ordered by archetype and minimum distance within each archetype. Pairwise t-tests were performed for archetypes (individual distance to archetypes) across families, wherein only significant pairwise differences (adj. P < 0.01) are filled. Simplex plot (d) depicting k archetype projections of all individuals and (e) panicle kite area (cm2) distributions, with family means represented by yellow diamonds.
Fig. 3.
Fig. 3.
Rachis morphology and allometry. Rachis internode proportions (a) from total RL in the O × S population, ordered by number of internodes, then by first internode proportion. The right y-axis represents the number of nodes cm−1 rachis (loess span = 0.2). Internode proportions by family (b) are similarly ordered, with significant pairwise differences (adj. P < 0.01) highlighted by rachis NN in lower triangles to the right. Model II regression (c) of log10(rachis internode proportion) and log10(rachis NN), with results in the lower left legend by NN. d) Decrease in mean rachis internode proportion (y) with increasing NN (x), modeled as 1/(1+e1/x), with R2 values to the right. Boxplots of (e) NN, (f) RL, (g) nodes cm−1 rachis, and (h) square-root deviance of nodes along the rachis, in descending order by family means (diamonds).
Fig. 4.
Fig. 4.
GWAS results. Physical genomic positions of significant genome-wide associations (a) (FDR adj. P < 0.01) in the O × S population. Nearby hits were binned by 10-Mb intervals for clarity, reporting the position of the strongest association within each bin. Manhattan and QQ plots (b) of selected field agronomic and panicle variables, with genome-wise thresholds, FDR = 0.05 (light horizontal line) and Bonferroni α=0.05 (dark horizontal line).

Similar articles

Cited by

References

    1. Admassu-Yimer B, Gordon T, Harrison S, Kianian S, Bockelman H, Bonman JM, Esvelt Klos K.. New sources of adult plant and seedling resistance to Puccinia coronata f. sp. avenae identified among Avena sativa accessions from the national small grains collection. Plant Dis. 2018;102(11):2180–2186. - PubMed
    1. Altschul SF, Gish W, Miller W, Myers EW, Lipman DJ.. Basic local alignment search tool. J Mol Biol. 1990;215(3):403–410. - PubMed
    1. Basu D, Tian L, Wang W, Bobbs S, Herock H, Travers A, Showalter AM.. A small multigene hydroxyproline-O-galactosyltransferase family functions in arabinogalactan-protein glycosylation, growth and development in Arabidopsis. BMC Plant Biol. 2015;15:295. - PMC - PubMed
    1. Becraft PW, Freeling M.. Genetic analysis of Rough sheath1 developmental mutants of maize. Genetics. 1994;136(1):295–311. - PMC - PubMed
    1. Bierman A, LaPlumm T, Cadle-Davidson L, Gadoury D, Martinez D, Sapkota S, Rea M.. A high-throughput phenotyping system using machine vision to quantify severity of grapevine powdery mildew. Plant Phenomics. 2019;2019:9209727. - PMC - PubMed

Publication types