. 2022 Nov 7;221(11):e202206131.
doi: 10.1083/jcb.202206131. Epub 2022 Sep 15.

Conformational transitions of the Spindly adaptor underlie its interaction with Dynein and Dynactin

Affiliations

Conformational transitions of the Spindly adaptor underlie its interaction with Dynein and Dynactin

Ennio A d'Amico et al. J Cell Biol. .

Abstract

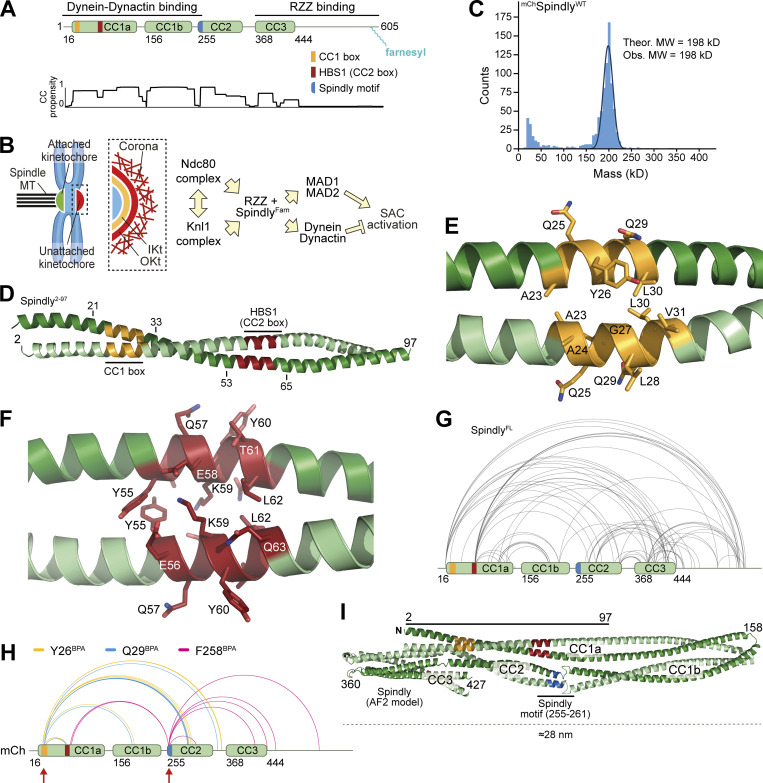
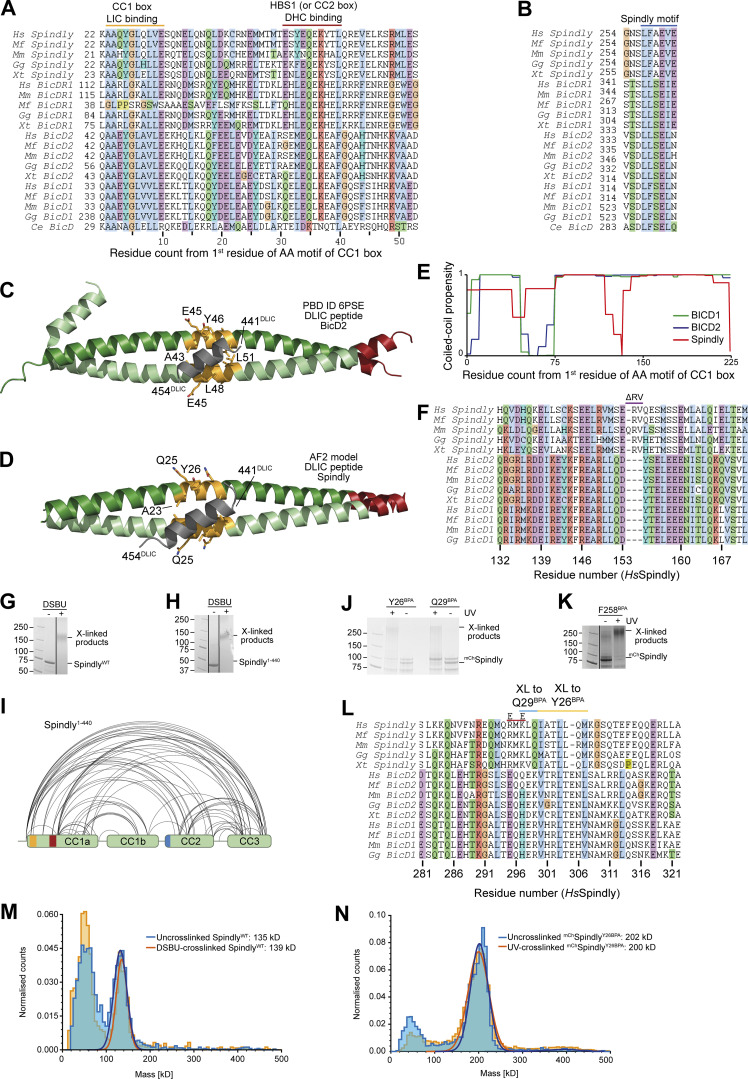
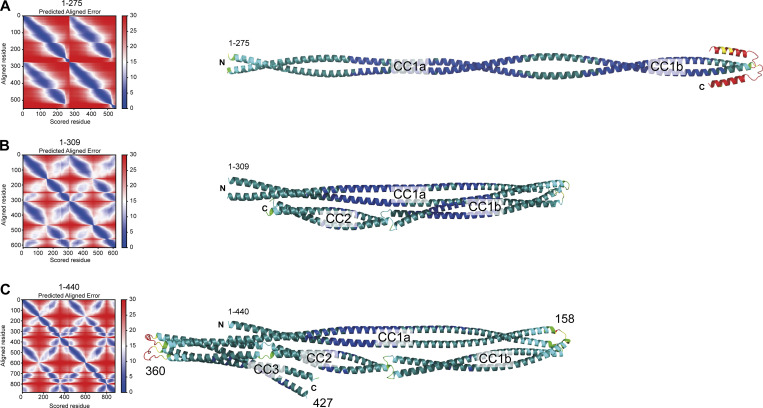
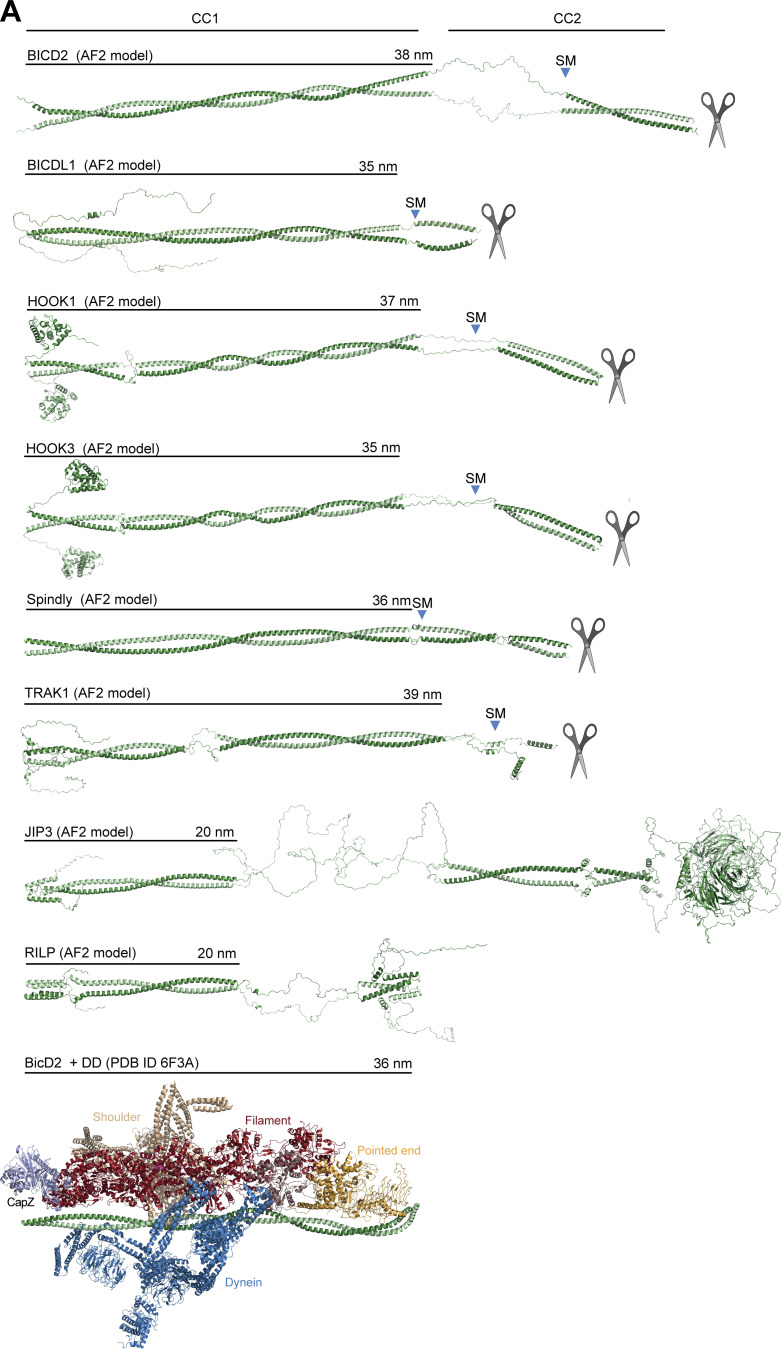
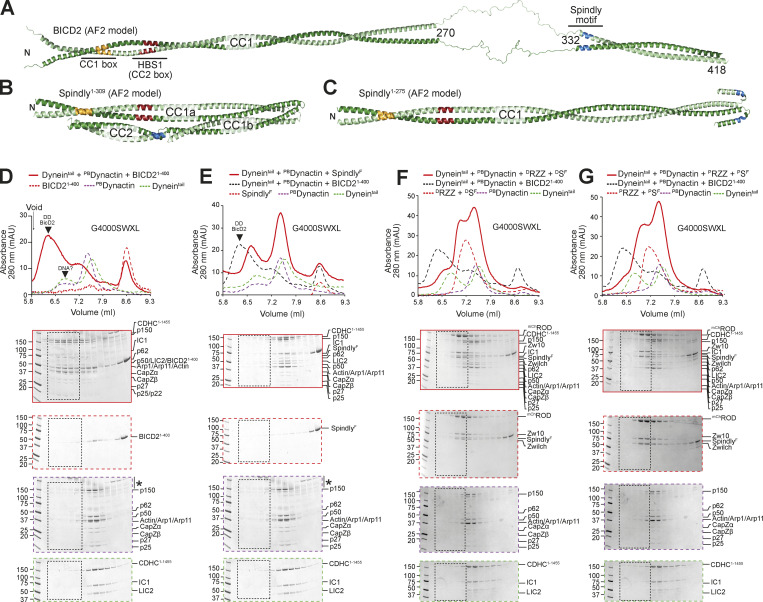
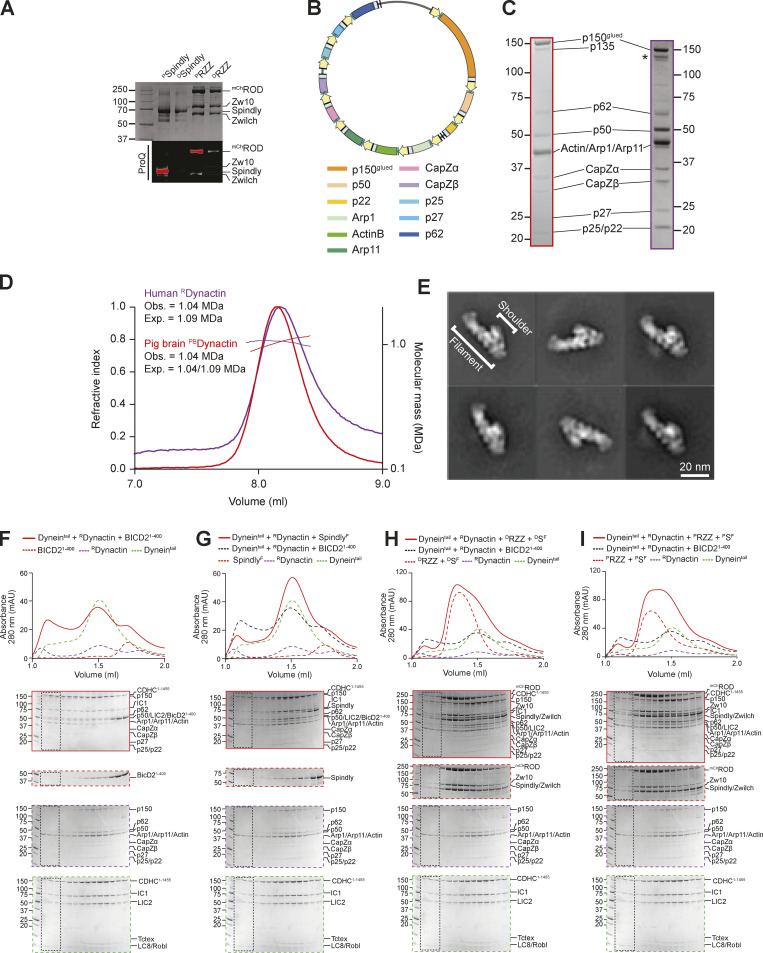
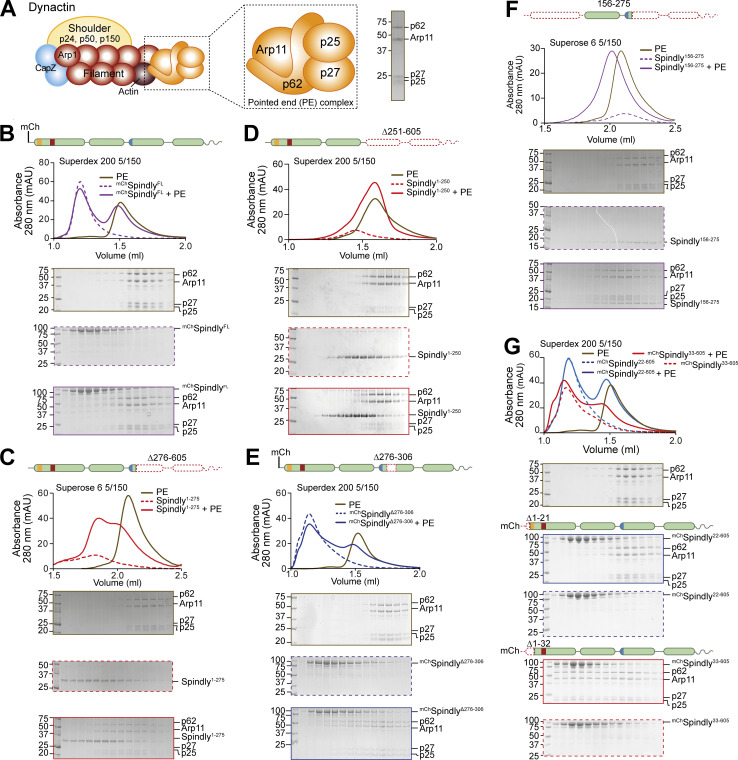
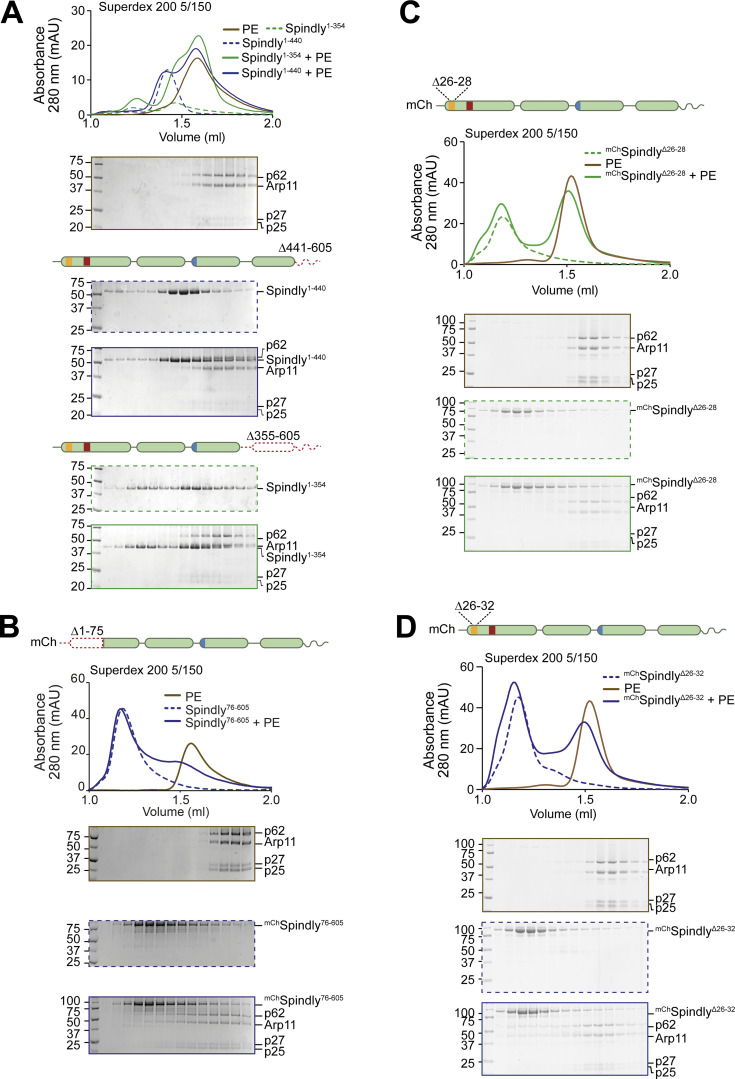
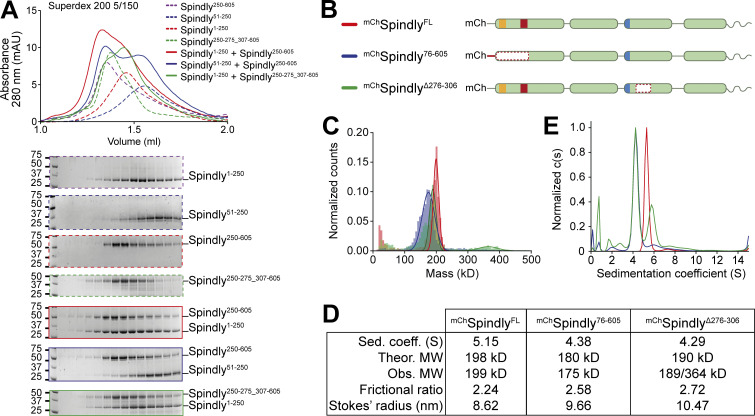
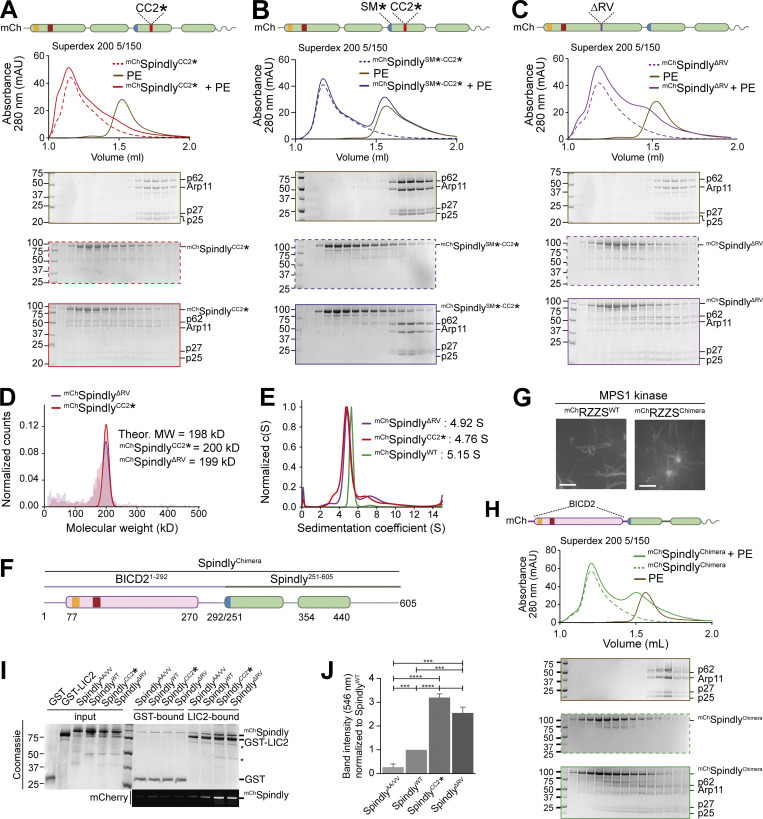
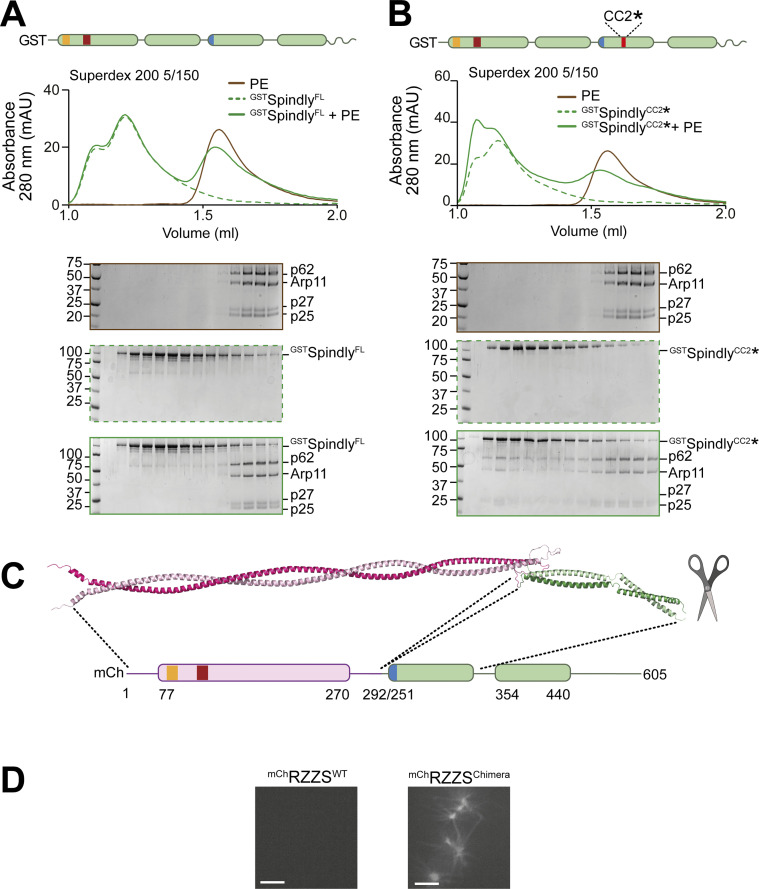
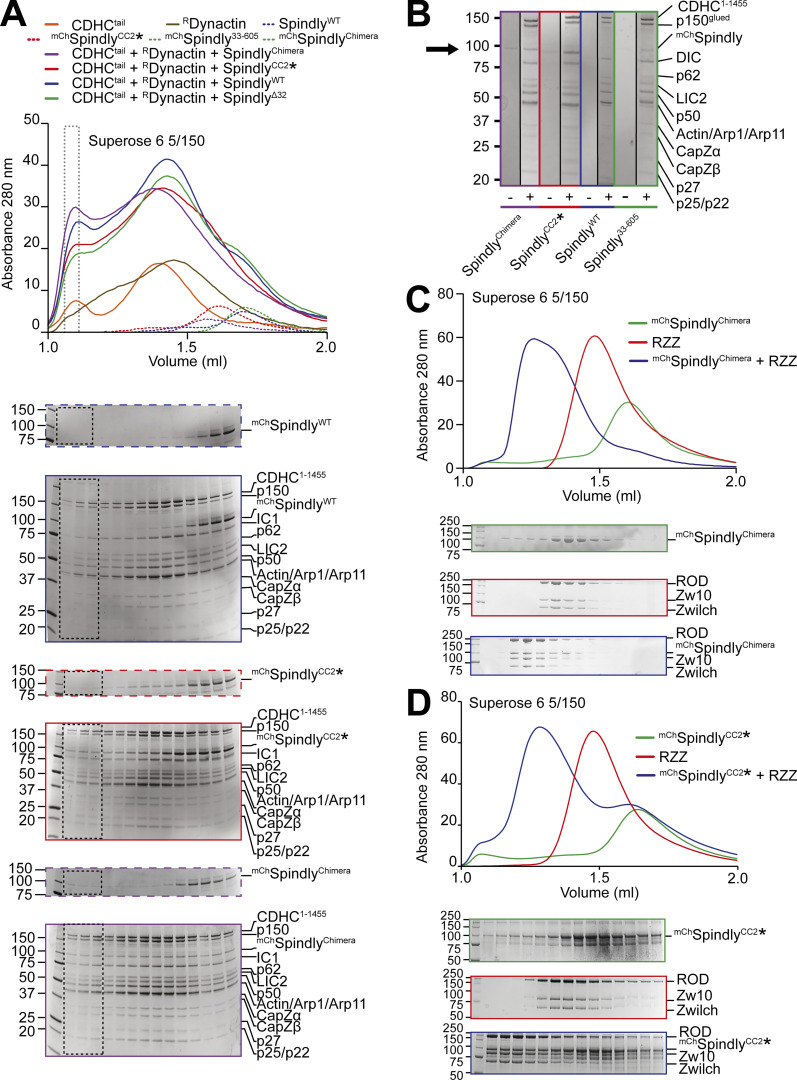
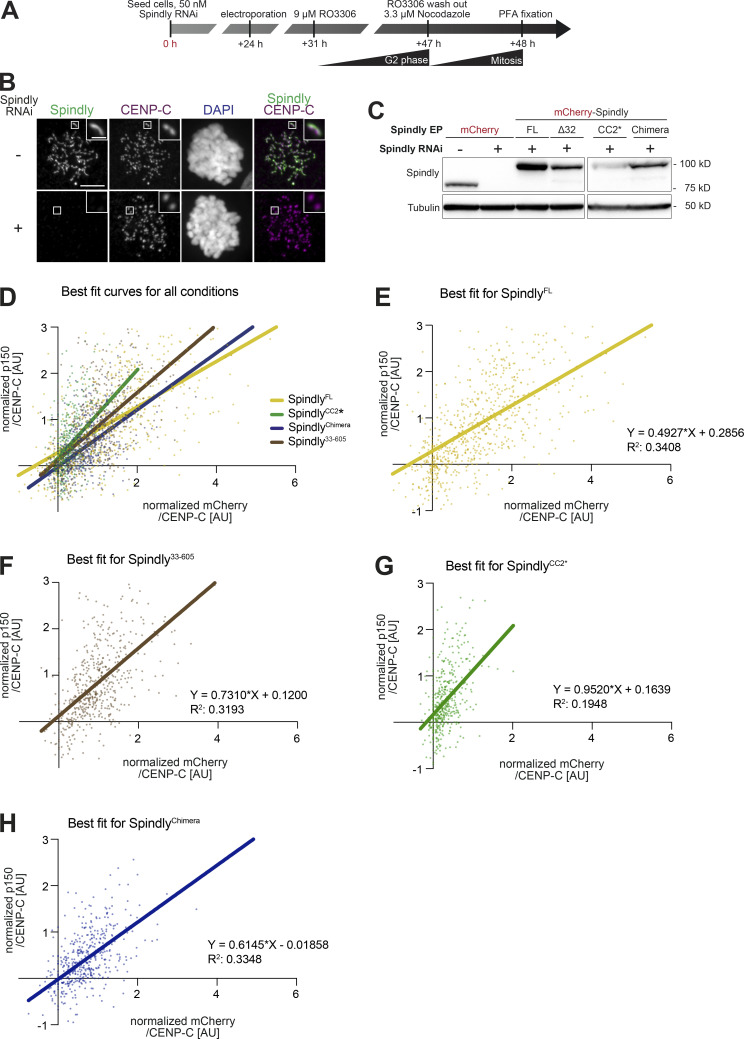
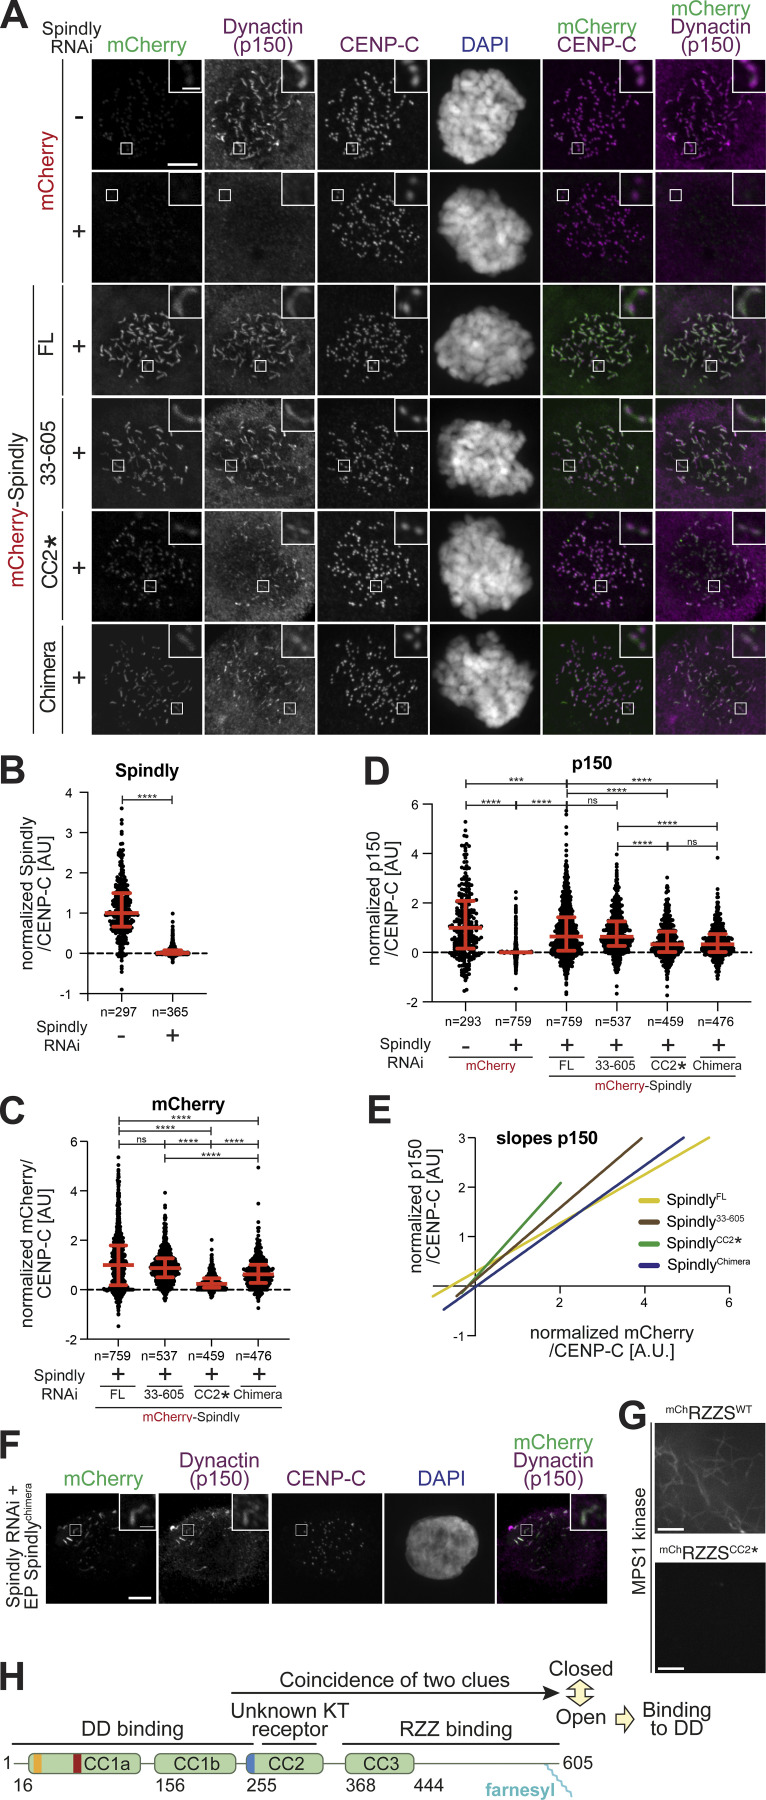
Cytoplasmic Dynein 1, or Dynein, is a microtubule minus end-directed motor. Dynein motility requires Dynactin and a family of activating adaptors that stabilize the Dynein-Dynactin complex and promote regulated interactions with cargo in space and time. How activating adaptors limit Dynein activation to specialized subcellular locales is unclear. Here, we reveal that Spindly, a mitotic Dynein adaptor at the kinetochore corona, exists natively in a closed conformation that occludes binding of Dynein-Dynactin to its CC1 box and Spindly motif. A structure-based analysis identified various mutations promoting an open conformation of Spindly that binds Dynein-Dynactin. A region of Spindly downstream from the Spindly motif and not required for cargo binding faces the CC1 box and stabilizes the intramolecular closed conformation. This region is also required for robust kinetochore localization of Spindly, suggesting that kinetochores promote Spindly activation to recruit Dynein. Thus, our work illustrates how specific Dynein activation at a defined cellular locale may require multiple factors.


Figures

Figure 1.
Figure 1.
Spindly is a folded adaptor. (A) Schematic representation of the organization of the coiled-coil regions of Spindly, and relevant coiled-coil prediction (COILS, ExPaSy suite). (B) Organization of the kinetochore and corona. (C) Results of mass photometry measurement of a sample of mCh-tagged Spindly (mChSpindlyFL). The measurements are consistent with Spindly being a dimer in solution, even at very low concentration (10 nM). MW, molecular weight. (D) Crystallographic structure of a Spindly1–100 construct. Only residues 2–97 were visible in the electron density. (E) Structure of the Spindly CC1 box (orange) and surrounding sequence. (F) Structure of the Spindly HBS1 (also known as CC2 box; red) and surrounding sequence. (G) Summary of XL-MS data reporting Spindly intramolecular crosslinks. For ease of viewing, only crosslinks detected ≥3 times and involving sites ≥40 residues apart are depicted. See also Table S2 for a detailed list of all crosslinks. (H) Summary of XL-MS data reporting Spindly intramolecular crosslinks found through amber codon suppression experiments. Red arrows indicate the sites where the BPA residues were introduced. Crosslinking results from three mutants are merged: Y26BPA (orange), Q29BPA (cyan), and F258BPA (magenta). A few crosslinks identified between the BPA residues and the mCh tag were considered spurious and not displayed. See also Table S2 for a detailed list of crosslinks. (I) AF2 Multimer prediction of Spindly structure. The CC1 box is in orange, the HBS1 in red, the Spindly motif in blue. The C-terminal unstructured tail of Spindly (aa 440–605) was omitted from the model due to the very low confidence index (pLDDT) of the prediction for this region (unpublished results).
Figure S1.
Figure S1.
Additional analyses of Spindly motifs and their influence on Spindly conformation. (A) Multiple sequence alignment of the first part of the CC1 region of the indicated adaptors containing the CC1 box and the HBS1 (or CC2 box). Hs, Homo sapiens; Mf, Macaca fascicularis; Mm, Mus musculus; Gg, Gallus gallus; Xt, Xenopus tropicalis; Ce, Caenorhabditis elegans. (B) Multiple sequence alignment of the Spindly motif. (C) Cartoon model of PDB accession no. 6PSE (Lee et al., 2020) showing the mode of binding of a LIC peptide (gray) to the CC1 box (yellow-orange). (D) ColabFold prediction model of the Spindly CC1:LIC peptide complex. Coloring as in C. (E) Coiled-coil propensity was predicted with the COILS program within ExPasY suite (Duvaud et al., 2021) and displayed for all indicated adaptors from the first residue of the CC1 box (see A). The coiled-coil propensity for Spindly has a deep that corresponds to a two-residue insertion shown in F. (F) Multiple sequence alignment of the region of CC1 around the two-residue insertion in Spindly that causes a deep in the coiled-coil prediction profile (see E). (G) SDS-PAGE documenting crosslinking of the full-length Spindly proteins with DSBU. (H) SDS-PAGE documenting crosslinking of the Spindly1–440 proteins with DSBU. G and H were obtained from the same original gel and the marker lane is the same in the two panels. (I) Summary of XL-MS data reporting Spindly intramolecular crosslinks. for ease of viewing, only crosslinks detected ≥3 times and involving sites ≥40 residues apart are depicted. See also Table S2. (J and K) Coomassie-stained SDS-PAGE gels documenting crosslinking of the indicated BPA mutants upon treatment with UV light. (L) Multiple sequence alignment of the indicated adaptors in the main region targeted by Q29BPA and Y26BPA. The CC2* mutant discussed in the text is the charge reversal mutant (E–E) at the two indicated positively charged residues (R295 and K297 in human Spindly). (M) Mass-photometry analysis of DSBU-crosslinked vs. untreated Spindly. The analysis does not detect an enrichment of oligomeric products, and identifies both samples as dimers. The peak at the detection limit of the mass photometer (40–50 kD) is below the expected size of the Spindly monomer (70 kD) and is likely due to slight degradation of the sample. (N) Mass-photometry analysis of UV-crosslinked vs. untreated mChSpindlyY26BPA. The analysis does not detect an enrichment of oligomeric products. Molecular weights are in kD. Source data are available for this figure: SourceData FS1.
Figure S2.
Figure S2.
PAE plots and pLDDT scores. (A–C) PAE plots (left) and per-residue confidence score (pLDDT) of the three Spindly models discussed in the main text. (A) Spindly1–275. (B) Spindly1–309. (C) Spindly1–440. The pLDDT scores are displayed on the AF2 Multimer predictions of Spindly shown on the right (Blue: high confidence; Red: low confidence). The models are shown, with the same orientation, in Figs. 1 and 2. The PAE matrices refer to models of Spindly dimers, and correspondingly numbering of residues on the left and bottom of the plot is the number of residues in each chain multiplied by 2, and the second chain is plotted directly following the first. The parallel coiled-coils give rise to off-diagonal signals (blue) parallel to the main diagonal. Besides straight models like the one shown, a few predicted models of Spindly1–275 also showed a folded-back conformation. However, there are no additional off-diagonal signals for the Spindly1–275 construct in the PAE plots, suggesting that even if Spindly1–275 explores folded-back conformations, these are not stable. Off-diagonal signals perpendicular to the main diagonal are instead clearly visible in the Spindly1–309 and Spindly1–440 constructs, consistent with a folded back conformation. A predicted folded conformation of Spindly1–440 was also observed with orthologous sequences (unpublished results).
Figure S3.
Figure S3.
Gallery of AF2 predictions of the structure of representative adaptors. (A) AF2 ColabFold models of the indicated adaptors. The scissor symbol indicates that the displayed cartoon models were truncated after the CC2 region. SM is the Spindly motif. The length of CC1 coiled-coil is indicated. As indicated in the Materials and methods section, AF2 and variants can predict different quaternary structures for the adaptors, including trimeric or tetrameric coiled-coil formation, if three or four chains respectively are used as input. However, with trimers or tetramers, the PAE values estimated between the same positions on different protomers are high to very high (i.e., insignificant), indicating that the predictions are less likely to be accurate (unpublished results). We only present predictions of dimers here, as there is experimental evidence for several of them that their active conformation is the dimer (Isabet et al., 2009; Kelkar et al., 2000; Lee et al., 2018; Urnavicius et al., 2018; Urnavicius et al., 2015; Wu et al., 2005). For clarity, models were straightened as discussed in Materials and methods. Even if Spindly is predicted to adopt a closed conformation when CC2 is present (see main text), here for comparison we show the extended open conformation expected to bind DD. The model of the DD complex with BicD2 (PDB accession no. 6F3A; Urnavicius et al., 2018) shows that the length of the experimentally modeled BicD2 coiled-coil is approximately identical to the length of CC1 predicted by AF2 for many of the displayed adaptors.
Figure 2.
Figure 2.
Spindly autoinhibition prevents its interaction with DD. (A) AF2 Multimer was used to predict a model of BicD2. The flexible region between 270 and 332 has very low reliability and has therefore been artificially linearized for visualization purposes (see Materials and methods). The tail region has been omitted due to limited reliability of the predictions. (B) AF2 Multimer model of Spindly1–309. (C) AF2 Multimer model of Spindly1–275. PAE plots and pLDDT scores for B and C are displayed in Fig. S2. (D) Analytical SEC elution profile from a G4000WXL column and SDS-PAGE to compare complex formation between BicD2 (red, dashed), PBDynactin (purple, dashed), and Dynein tail (green, dashed). Experiments assessing complex formation are shown in continuous red line. Every second 100 μl elution fraction within the indicated volume range was loaded for SDS-PAGE analysis. (E–G) Analytical SEC elution profile and SDS-PAGE of complex formation between an adaptor–cargo/adaptor complex (red, dashed), PBDynactin (purple, dashed), Dynein tail (green, dashed), and the complex run shown in red. Overlaid (black, dashed) the Dynein tail, Dynactin, BicD21–400 complex run of D. (E) Farnesylated SpindlyFL. (F) Full-length SpindlyF and RZZ treated with λ-phosphatase. (G) Full-length SpindlyF and RZZ pretreated with a mix of mitotic kinases (MPS1, Aurora B, CDK1/Cyclin B). Note that the Dynein tail and Dynactin controls are both shared between D and E, and F and G. The vertical line with an asterisk in D and E marks the accumulation of unknown contaminants in the upper part of the gel. In all SEC experiments in this figure, Spindly was full length and farnesylated. Dynein tail: 1 nM; Dynactin: 1.5 µM; Spindly: 8 µM; RZZ: 2 µM. mAU, milli absorbance units. Molecular weights are in kD. Source data are available for this figure: SourceData F2.
Figure S4.
Figure S4.
Recombinant human Dynactin. (A) Coomassie-stained SDS-PAGE and ProQ Diamond staining of phosphorylated and dephosphorylated RZZ and Spindly. Samples were initially dephosphorylated with λ-PPase (samples indicated as “D”) and later re-phosphorylated with the mitotic kinases CDK1/CyclinB, MPS1, and Aurora B (samples indicated as “P”). (B) Map of the Dynactin expression plasmid. Individual subunits are labeled according to the list below. CMV promoters and enhancers are labelled in yellow. PolyA signals are labeled in light blue. (C) Comparison of SDS-PAGE (Coomassie staining) of PBDynactin (left, red) and recombinant human Dynactin (right, purple). (D) SEC-MALS analysis of human recombinant RDynactin (purple) and PBDynactin (red). PBDynactin contains a mix of the p150 isoforms p150glued and p135, yielding two different expected masses. (E) 2D class averages from negative stain imaging of RDynactin. (F–I) Analytical size-exclusion chromatography on a Superose 6 5/150 column to assess complex formation between an adaptor–cargo/adaptor complex (red, dashed), PBDynactin (purple, dashed), Dynein tail (green, dashed), and with the complex run shown in red. (F) BicD21–400. (G) SpindlyFL. (H) RZZ-SpindlyFL treated with λ-phosphatase. (I) RZZ-SpindlyFL pretreated with a mix of mitotic kinases (MPS1, Aurora B, CDK1/Cyclin B). Dynein tail and RDynactin controls are shared in F–I. In all SEC experiments in this figure, SpindlyFL was farnsylated. Dynein concentration: 750 nM, Dynactin concentration: 750 nM, Spindly/BicD2 concentration: 4 µM, RZZ concentration: 1 µM. mAU, milli absorbance units. Molecular weights are in kD. Source data are available for this figure: SourceData FS4.
Figure 3.
Figure 3.
Spindly autoinhibition is relieved by N- and C-terminal deletions. (A) Schematic representation of the PE complex in the context of Dynactin, and SDS-PAGE of its chromatographic peak in gel filtration. (B–G) Analytical SEC binding assays between the Dynactin PE (brown) and Spindly constructs. The complex run is always represented with a continuous line, the Spindly construct with a dashed line. (B) mChSpindly (purple). (C) Spindly1–275 (red). (D) Spindly1–250 (red). (E) mChSpindly∆276–306 (blue). (F) Spindly156–275 (purple). (G) mChSpindly22–605 (blue); mChSpindly33–605 (red). (B–E and G) PE: 3 µM, Spindly constructs: 8 µM. (F) PE: 4 µM, Spindly156–275: 10 µM. The control gels with the PE alone are shared between B, G, C, F, and D and Fig. S3 A. mAU, milli absorbance units. Molecular weights are in kD. Source data are available for this figure: SourceData F3.
Figure S5.
Figure S5.
Additional analyses of the Spindly N-terminal autoinhibitory region. (A–D) Additional analytical SEC interaction assays between the Dynactin PE (brown) and the indicated Spindly constructs. The complex run is always represented with a continuous line, the Spindly construct with a dashed line. (A) Spindly1–440 (blue); Spindly1–354 (green). (B) mChSpindly76–605 (blue). (C) mChSpindlyΔ26–28 (green). (D) mChSpindlyΔ26–32 (blue). PE: 3 µM; Spindly construct: 8 µM. The PE alone control in A is shared with Fig. 3 D, between C and D, and between B and Fig. S6, A and B. mAU, milli absorbance units. Molecular weights are in kD. Source data are available for this figure: SourceData FS5.
Figure 4.
Figure 4.
Spindly autoinhibition involves a direct interaction between N- and C-terminal regions. (A) Analytical SEC elution profile and SDS-PAGE analysis for interaction assays between the Spindly N-terminal and C-terminal domains. Spindly1–250 (red, dashed) interacts with Spindly250–605 (alone: purple, dashed; complex: red, continuous), but not with Spindly250–275_307–605 (alone: green, dashed; complex: green, continuous). Spindly51–250 (blue, dashed) does not interact with Spindly250–605 (complex: blue, continuous). Concentration of all fragments: 10 µM. (B) schematic representation of Spindly constructs referred to in C–E. (C) Mass photometry results for the constructs in B. (D) Data table from hydrodynamic and mass photometry results in C and D. The Stokes’ radius and frictional ratio were estimated from the AUC-measured sedimentation coefficient and from the theoretical molecular weights (MW). (E) AUC results for the constructs in B. The smaller sedimentation coefficient indicates higher drag, which is caused by an increased Stokes’ radius. Molecular weights are in kD. Source data are available for this figure: SourceData F4.
Figure 5.
Figure 5.
Point mutations relieve Spindly autoinhibition. (A–C and H) Analytical SEC analyses on a Superdex 200 5/150 column to assess complex formation between the Dynactin PE (brown) and various Spindly constructs. The complex run is always represented with a continuous line, the Spindly construct with a dashed line. (A) mChSpindlyCC2* (red). (B) mChSpindlySM*-CC2* (blue). (C) mChSpindlyΔRV (purple). (H) mChSpindlyChimera (green). PE: 3 µM; Spindly construct: 8 µM. (D) Mass photometry results for mChSpindlyCC2* (red) and mChSpindlyΔRV (purple). The main peaks’ “shoulders” are consistent with minor sample degradation. (E) AUC profile of mChSpindlyCC2* (red), mChSpindly∆RV (purple), and mChSpindlyWT (green). c(S), sedimentation coefficient. (F) schematic representation of the mChSpindlyChimera. (G) Spinning-disk confocal fluorescence microscopy-based filamentation assay at 561 nm shows the indicated mChRZZSF species (4 µM RZZ, 8 µM farnesylated Spindly) form filaments when incubated at 20°C with MPS1 kinase. Scale bar: 5 µm. (I) SDS-PAGE analysis of pulldown assay with either GST or GST-tagged LIC2 as bait, and mCh-tagged Spindly as prey. Coomassie staining and fluorescent signal in the red channel are displayed. Asterisks mark contaminants or degradation products. (J) Quantification of the mChSpindly fluorescent signal and SDs calculated from three technical replicates. Statistical analysis was performed with a parametric test comparing two unpaired groups. ***, P ≤ 0.001; ****, P ≤ 0.0001. The PE alone controls in A and C are shared with the control in Fig. 3 E. mAU, milli absorbance units. Molecular weights are in kD. Source data are available for this figure: SourceData F5.
Figure S6.
Figure S6.
Additional characterization of Spindly binding to PE. (A) SEC separation of GSTSpindly (dotted green line), the PE complex (brown line), and their mixture (continuous green line). (B) SEC separation of GSTSpindlyCC2* (dotted green line), the PE complex (brown line), and their mixture (continuous green line). The PE control is shared between the two shown experiments and with Fig. S3 B. PE: 3 µM, Spindly construct: 8 µM. (C) The AF2 ColabFold model of the BicD2-Spindly chimera shows CC1 is continuous. (D) Spinning-disk confocal fluorescence microscopy-based filamentation assay at 561 nm with the indicated mChRZZSF species (4 µM RZZ, 8 µM SpindlyF) at 20°C in absence of MPS1 kinase. mAU, milli absorbance units. Molecular weights are in kD. Scale bar: 5 µm. Source data are available for this figure: SourceData FS6.
Figure 6.
Figure 6.
Complex formation assay between DD and Spindly mutants. (A) Elution profiles and SDS-PAGE of complex formation assays between Dynein tail, recombinant Dynactin, and Spindly constructs. Experiment run on a Superose 6 5/150 column, in stoichiometric conditions. Only selected gels are displayed. The gray-dotted box indicates the fraction loaded in the SDS-PAGE shown in B. Dynein tail: 0.75 µM, Dynactin: 0.75 µM, Spindly: 2 µM. (B) Comparison of the fractions of the expected DDS complex peak shown in A. A minus sign indicates adaptor-only runs, a plus indicates full complex runs. The arrow points at the expected position of mChSpindly. (C and D) Analytical SEC experiments on a Superose 6 5/150 column to assess complex formation (blue) between the RZZ complex (red) and the indicated Spindly constructs (green). (C) mChSpindlyChimera. (D) mChSpindlyCC2*. RZZ: 2 µM; Spindly constructs: 6 µM. Both Spindly constructs were pre-farnesylated. Molecular weights are in kD. Source data are available for this figure: SourceData F6.
Figure S7.
Figure S7.
Additional data on kinetochore levels of Dynactin with Spindly mutants. (A) Schematic of the RNAi and complementation by electroporation with recombinant proteins. Scale bar: 5 µm (whole cell) or 1 µm (inset). (B) Representative images of RNAi control cells and cells depleted of Spindly by RNAi. (C) The indicated proteins were electroporated under the same conditions shown in A. 1 h after release from a G2 arrest into mitosis in presence of 3.3 μM Nocodazole, mitotic cells were collected, lysed, and analyzed by immunoblotting with the indicated antibodies. 60 µg of cleared lysate was used for each condition, and Tubulin is shown as a loading control. (D–H) Least square fitting through the distribution of data points reporting for each kinetochore the CENP-C–normalized mChSpindly intensity on the x-axis and the CENP-C–normalized p150glued intensity on the y-axis. Data and statistical analyses for these experiments is described in the legend to Fig. 7. (D) All fit curves with all data points. (E) Individual best fit for mChSpindlyFL. (F) Individual best fit for mChSpindly33–605. (G) Individual best fit for mChSpindlyCC2*. (H) Individual best fit for mChSpindlyChimera. Source data are available for this figure: SourceData FS7.
Figure 7.
Figure 7.
Kinetochore levels of Dynactin in presence of Spindly mutants. (A) Representative images showing the effects of a knockdown of the endogenous Spindly in HeLa cells on Dynactin recruitment monitored through the p150glued subunit. RNAi treatment was performed for 48 h with 50 nM siRNA (see Fig. S7 A). Before fixation, cells were synchronized in G2 phase with 9 μM RO3306 for 16 h and then released into mitosis. Subsequently, cells were immediately treated with 3.3 μM nocodazole for an additional hour. CENP-C was used to visualize kinetochores and DAPI to stain DNA. Scale bar here and in F: 5 µm (whole cell) or 1 µm (inset). (B) Quantification of residual Spindly levels at kinetochores. A representative image is shown in Fig. S7 B. n refers to individual measured kinetochores. Statistical analysis (also for C and D) was performed with a nonparametric t test comparing two unpaired groups (Mann–Whitney test). Symbols indicate: n.s., P > 0.05; ∗∗∗, P ≤ 0.001; ∗∗∗∗, P ≤ 0.0001. Red lines, here and in C and D, indicate mean and SD. Three biological replicates were performed for experiments in B–D. (C) Quantification of kinetochore levels of the indicated electroporated mChSpindly proteins. n refers to individual measured kinetochores. (D) Kinetochore levels of Dynactin in cells depleted of endogenous Spindly and electroporated with the indicated Spindly proteins. n refers to individual measured kinetochores. (E) Least square linear fitting through the distribution of data points reporting for each kinetochore the CENP-C–normalized mChSpindly intensity on the x-axis and the CENP-C–normalized p150glued intensity on the y-axis. The individual distributions are shown in Fig. S7, C–G. (F) Electroporated mChSpindlyChimera is observed forming polymers in Spindly-depleted cells in interphase, causing ectopic recruitment of p150glued. (G) Spinning-disk confocal fluorescence microscopy-based filamentation assay at 561 nm with the indicated mChRZZSF species (4 µM RZZ, 8 µM SpindlyF) at 20°C in presence of MPS1 kinase. Scale bar: 5 µm. (H) Model for the activation of Spindly.

Comment in

References

    1. Ai, H.W., Shen W., Sagi A., Chen P.R., and Schultz P.G.. 2011. Probing protein-protein interactions with a genetically encoded photo-crosslinking amino acid. Chembiochem. 12:1854–1857. 10.1002/cbic.201100194 - DOI - PubMed
    1. Akhmanova, A., and Hoogenraad C.C.. 2015. Microtubule minus-end-targeting proteins. Curr. Biol. 25:R162–R171. 10.1016/j.cub.2014.12.027 - DOI - PubMed
    1. Alex, A., Piano V., Polley S., Stuiver M., Voss S., Ciossani G., Overlack K., Voss B., Wohlgemuth S., Petrovic A., et al. . 2019. Electroporated recombinant proteins as tools for in vivo functional complementation, imaging and chemical biology. Elife. 8:e48287. 10.7554/eLife.48287 - DOI - PMC - PubMed
    1. Amos, L.A. 1989. Brain dynein crossbridges microtubules into bundles. J. Cell Sci. 93:19–28. 10.1242/jcs.93.1.19 - DOI - PubMed
    1. Auckland, P., Roscioli E., Coker H.L.E., and McAinsh A.D.. 2020. CENP-F stabilizes kinetochore-microtubule attachments and limits dynein stripping of corona cargoes. J. Cell Biol. 219:e201905018. 10.1083/jcb.201905018 - DOI - PMC - PubMed

Publication types

MeSH terms