. 2022 Dec 5;219(12):e20212479.
doi: 10.1084/jem.20212479. Epub 2022 Sep 15.

Elevating microglia TREM2 reduces amyloid seeding and suppresses disease-associated microglia

Affiliations

Elevating microglia TREM2 reduces amyloid seeding and suppresses disease-associated microglia

Na Zhao et al. J Exp Med. .

Abstract

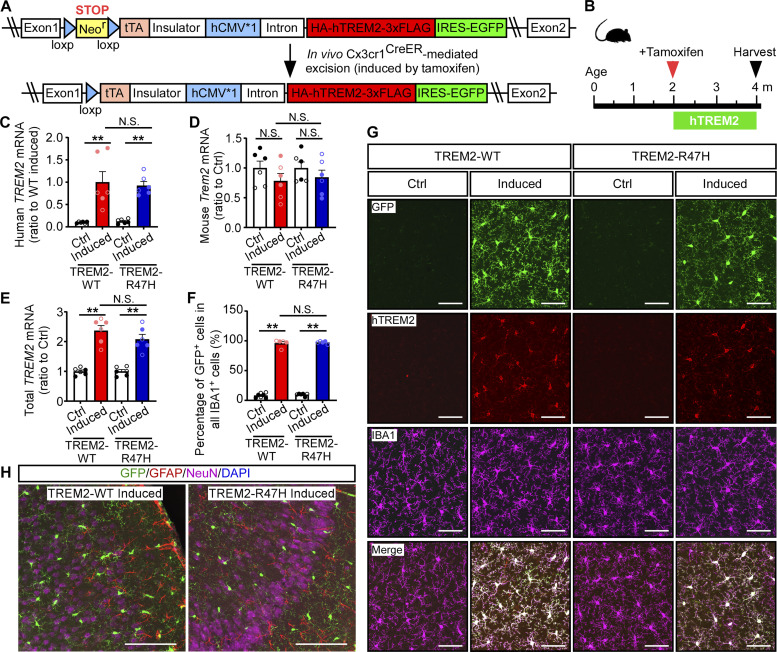
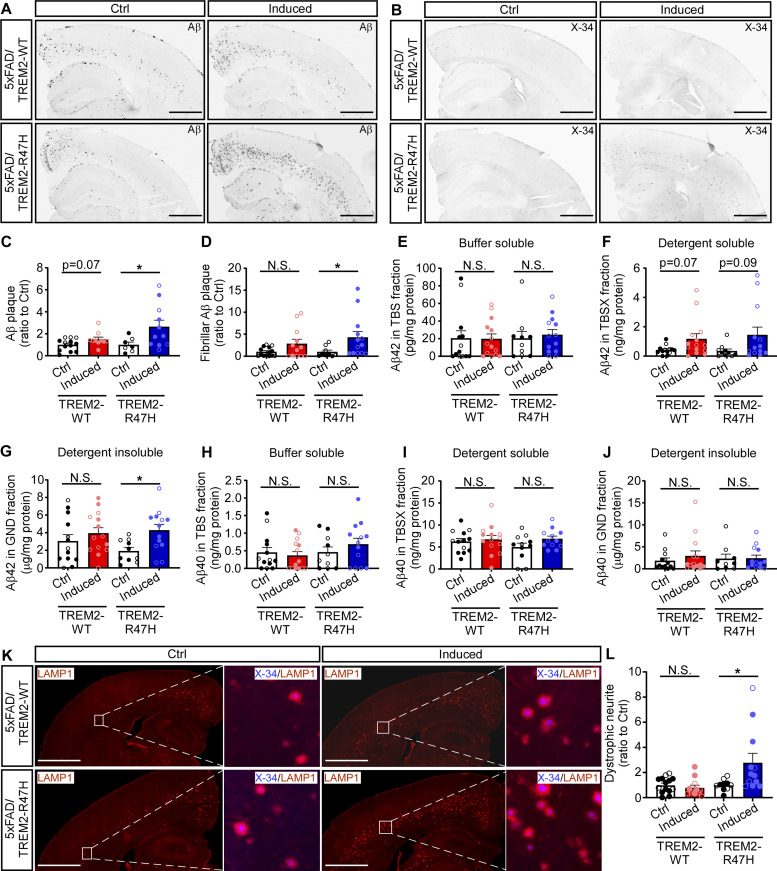
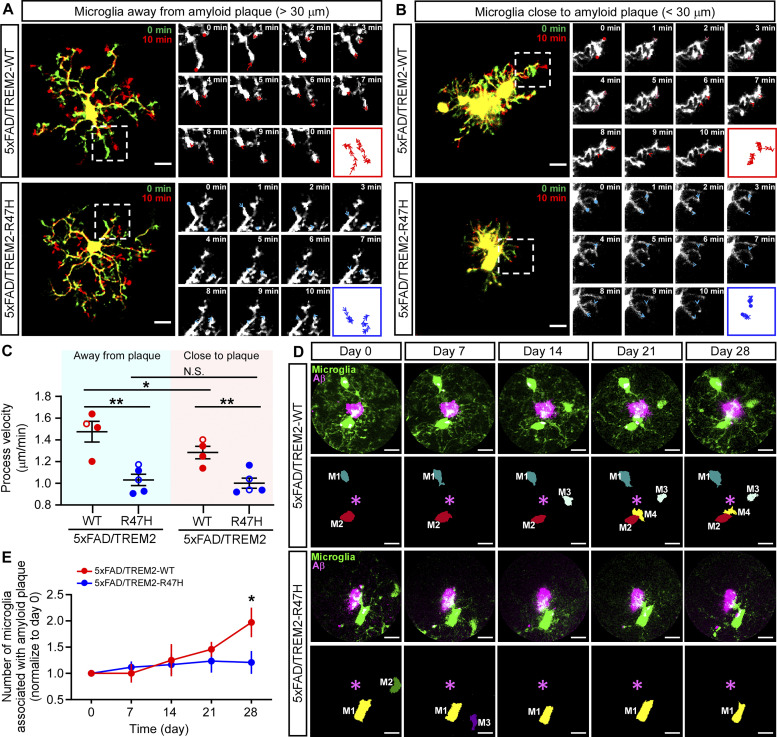
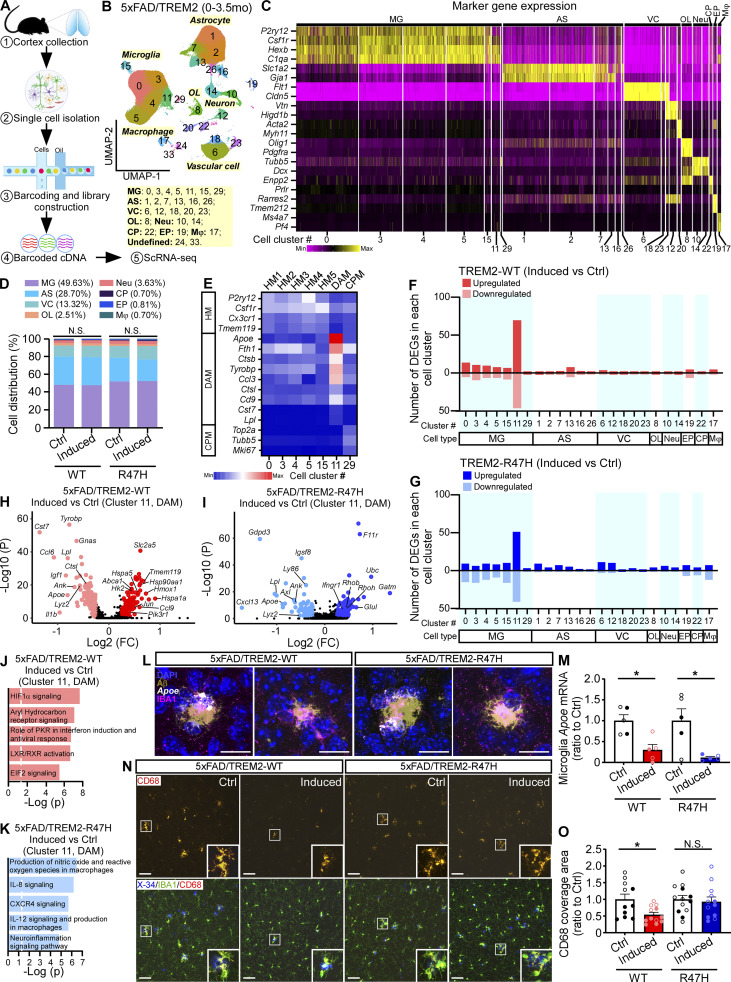
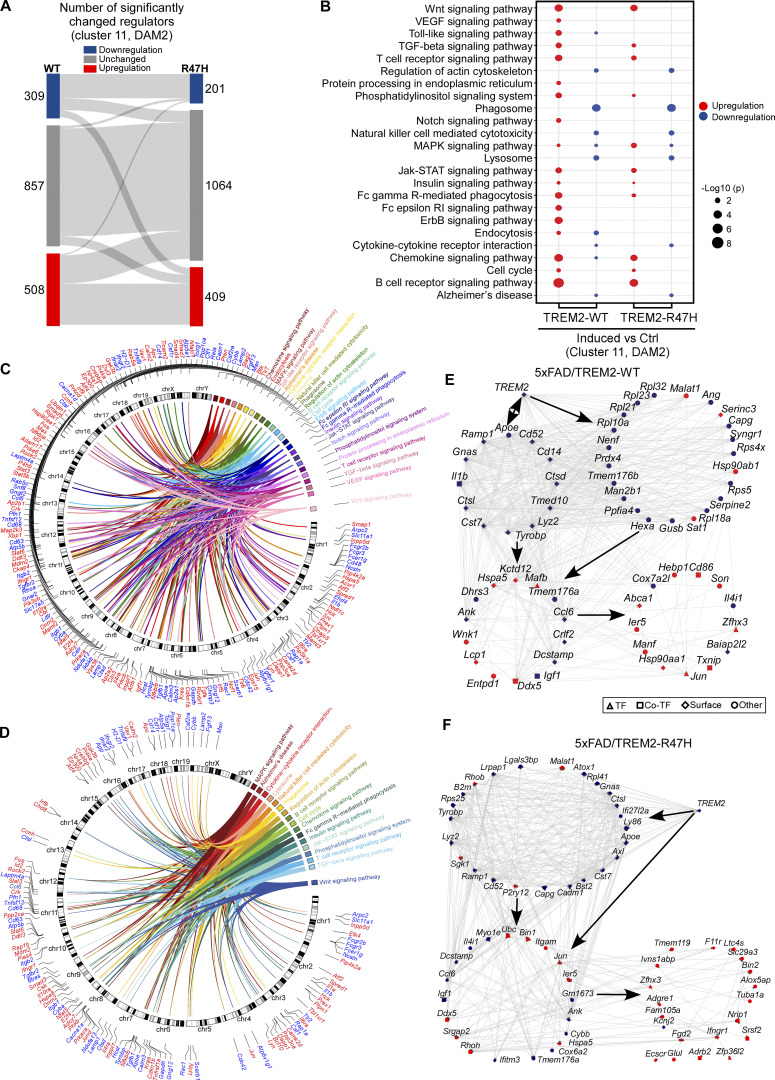
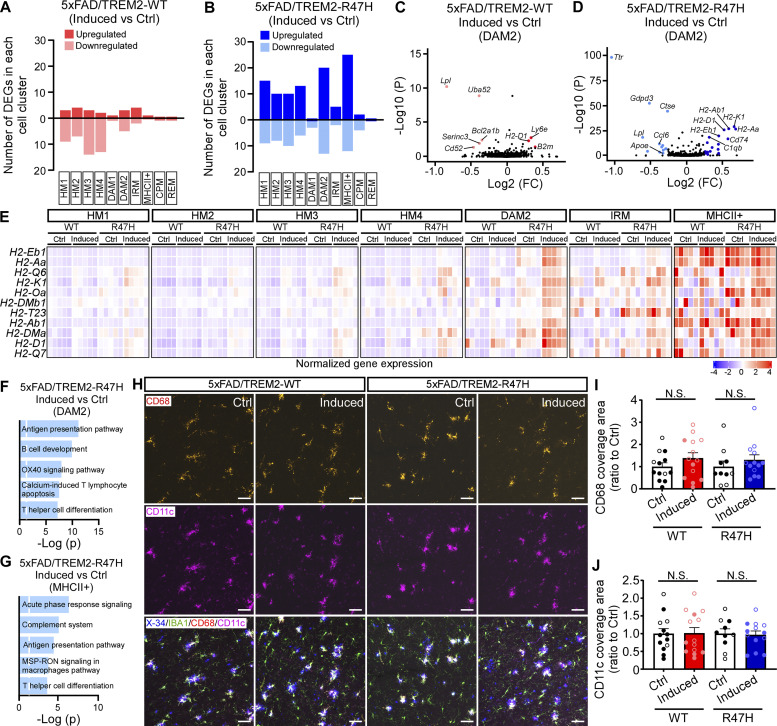
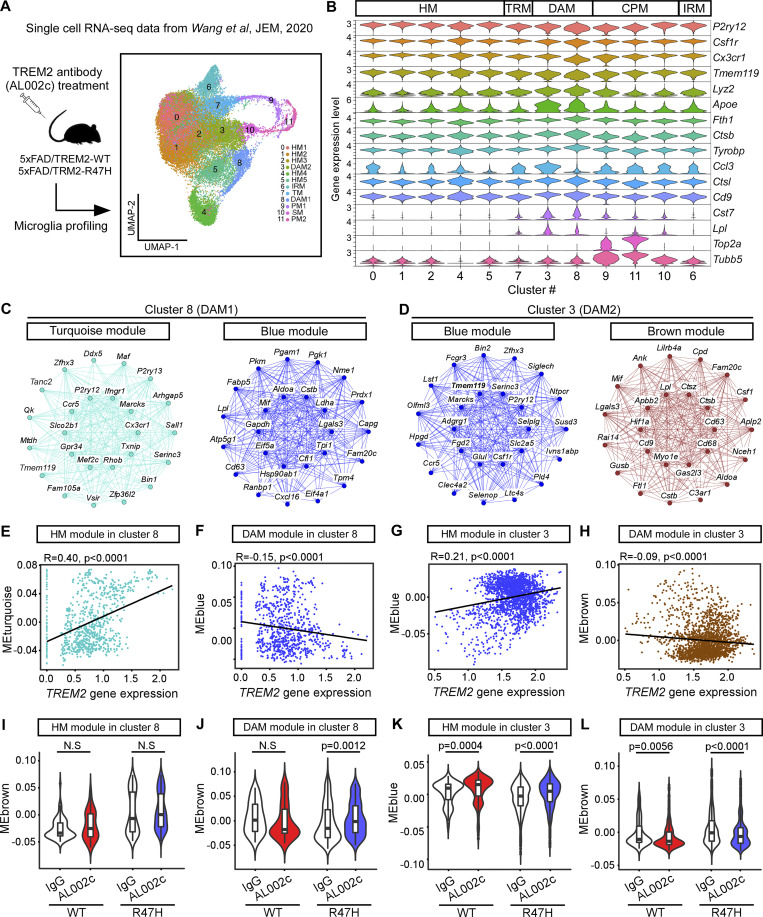
TREM2 is exclusively expressed by microglia in the brain and is strongly linked to the risk for Alzheimer's disease (AD). As microglial responses modulated by TREM2 are central to AD pathogenesis, enhancing TREM2 signaling has been explored as an AD therapeutic strategy. However, the effective therapeutic window targeting TREM2 is unclear. Here, by using microglia-specific inducible mouse models overexpressing human wild-type TREM2 (TREM2-WT) or R47H risk variant (TREM2-R47H), we show that TREM2-WT expression reduces amyloid deposition and neuritic dystrophy only during the early amyloid seeding stage, whereas TREM2-R47H exacerbates amyloid burden during the middle amyloid rapid growth stage. Single-cell RNA sequencing reveals suppressed disease-associated microglia (DAM) signature and reduced DAM population upon TREM2-WT expression in the early stage, whereas upregulated antigen presentation pathway is detected with TREM2-R47H expression in the middle stage. Together, our findings highlight the dynamic effects of TREM2 in modulating AD pathogenesis and emphasize the beneficial effect of enhancing TREM2 function in the early stage of AD development.


Conflict of interest statement

Disclosures: G. Bu reported grants from National Institutes of Health during the conduct of the study; personal fees from SciNeuro, Kisbee, and Lexeo outside the submitted work. No other disclosures were reported.

Figures

Figure 1.
Figure 1.
Microglia-specific and inducible mice expressing human TREM2-WT or TREM2-R47H variant. (A) Illustrative structure of the Rosa-targeting vector for Cre-mediated conditional expression of TREM2-WT or TREM2-R47H and EGFP. The TREM2 floxed mice were bred to the Cx3cr1CreER mice to generate TREM2-WT (TREM2-WT+/+; Cx3cr1CreER/+) or TREM2-R47H (TREM2-R47H+/+; Cx3cr1CreER/+) mice. Administration of tamoxifen to these mice led to the removal of the loxP-flanked Neor gene and expression of human TREM2-WT or TREM2-R47H in microglia. (B) Illustration of the induction paradigms for expression of human TREM2-WT or TREM2-R47H. (C–E) The mRNA levels of human TREM2 (C), mouse Trem2 (D), and total TREM2 (human + mouse; E) in the brain were quantified by qPCR. (F and G) Representative images of the GFP, human TREM2, and IBA1 co-staining (G) and the quantification of the percentage of GFP+ cells in all the IBA1+ microglia (F). Scale bar, 50 µm. (H) Immunofluorescence co-staining of GFP, GFAP, NeuN, and DAPI. Scale bar, 100 µm. n = 6 mice/group (mixed sexes). In C–F, the data from male and female mice are labeled as solid and open circles, respectively. Two-tailed unpaired Student’s t tests with Bonferroni correction were used for statistical analysis. P values <0.0167 were considered to be statistically significant. **, P < 0.01; N.S., not significant. Data are mean ± SEM.
Figure 2.
Figure 2.
TREM2-mediated suppression of amyloid accumulation and neuritic dystrophy in the early stage of pathological development. (A) Illustration of induction paradigms for the expression of human TREM2-WT or TREM2-R47H during different stages of the amyloid development in the 5xFAD background. (B–E) Representative images (B and C) and quantification (D and E) of Aβ plaque load by immunofluorescence staining with MOAB2 antibody (B and D) and fibrillar Aβ by X-34 labeling (C and E) in the mice induced for TREM2-WT or TREM2-R47H expression during 0–3.5 mo of age. Scale bar, 1 mm. (F–H) The levels of Aβ42 in the detergent soluble (TBSX) and insoluble (GND) fractions and the Aβ40 in the insoluble (GND) fraction were detected by ELISAs in the mice expressing TREM2-WT or TREM2-R47H during 0–3.5 mo of age. (I and J) The representative images (J) and quantification (I) of dystrophic neurites by immunofluorescence staining with LAMP1 antibody in the mice induced for TREM2-WT or TREM2-R47H expression during 0–3.5 mo of age. Scale bar, 1 mm. n = 11–13 mice/group, mixed sexes. Data are shown as mean ± SEM. Mann–Whitney tests with Bonferroni correction were used for statistical analysis. P values <0.025 were considered to be statistically significant. *, P < 0.025; **, P < 0.01; N.S., not significant. (K–P) The ISF from the hippocampus of the 5xFAD mice expressing TREM2-WT (K–M) or TREM2-R47H (N–P) at 0–3.5 mo was collected via in vivo microdialysis. (K, L, N, and O) The levels of Aβ42 at baseline or after γ-secretase inhibitor treatment were quantified by ELISAs. (M and P) The half-life of Aβ42 in ISF was calculated and compared. n = 3–6 mice/group, mixed sexes. Data are shown as mean ± SEM. Two-tailed unpaired Student’s t tests were used for statistical analysis. *, P < 0.05; N.S., not significant. In D–I, L, M, O, and P, the data from male and female mice are labeled as solid and open circles, respectively.
Figure S1.
Figure S1.
Microglia-specific and inducible expression of human TREM2 in the 5xFAD background. The expression of human TREM2-WT or TREM2-R47H in microglia were detected by immunofluorescence analysis of GFP and IBA1 signals in the 5xFAD/TREM2-WT mice or 5xFAD/TREM2-R47H mice in different stages of AD development. (A–F) Representative images (A–C) of the GFP and IBA1 signals and the percentage of GFP+ cells in all the IBA1+ microglia (D–F) are shown. Scale bar, 50 µm. n = 12–14, 6–9, and 10–15 mice/group (mixed sexes) for the 0–3.5, 2–5, and 5–8 mo cohorts, respectively. Data are mean ± SEM. The data from male and female mice are labeled as solid and open circles, respectively. Mann−Whitney tests followed by Bonferroni correction for multiple comparisons were used for statistical analysis. P values <0.0167 were considered to be statistically significant. **, P < 0.01; ***, P < 0.001; ****, P < 0.0001; N.S., not significant.
Figure S2.
Figure S2.
Characterization of human TREM2 protein in the 5xFAD/TREM2 mice. The protein levels of human TREM2 were detected in the TBS and TBSX fraction of 5xFAD/TREM2 mouse brain lysates by Western blotting (A, E, and I). The soluble TREM2 (sTREM2) in the TBS fraction was blotted by HA antibody. The FL- and CTF-TREM2 in the TBSX fraction were detected by a human-specific TREM2 antibody recognizing the C-terminus of TREM2. The amount of FL-TREM2 (B, F, and J), the ratio of sTREM2 to FL-TREM2 (C, G, and K), and the ratio of CTF- to FL-TREM2 (D, H, and L) were quantified. (A–D) The assessment of human TREM2 in the cohort of 5xFAD/TREM2 animals when TREM2 was expressed from 0 to 3.5 mo of age. n = 11–13 mice/group, mixed sexes. (E–H) The assessment of human TREM2 in the cohort of 5xFAD/TREM2 animals when TREM2 was expressed from 2 to 5 mo of age. n = 11–13 mice/group, mixed sexes. (I–L) The assessment of human TREM2 in the cohort of 5xFAD/TREM2 animals when TREM2 was expressed from 5 to 8 mo of age. n = 9–15 mice/group, mixed sexes. Data are mean ± SEM. The data from male and female mice are labeled as solid and open circles, respectively. Mann–Whitney tests with Bonferroni correction were used for statistical analysis. P values <0.0167 (B, F, and G) or < 0.05 (C, D, G, H, K, and L) were considered to be statistically significant. *, P < 0.05; ***, P < 0.001; ****, P < 0.0001; N.S., not significant. Source data are available for this figure: SourceData FS2.
Figure 3.
Figure 3.
TREM2-R47H expression in the rapid growth period of amyloid development exacerbates amyloid accumulation and neuritic dystrophy. (A–D) The representative images (A and B) and quantification (C and D) of Aβ plaque load by immunofluorescence staining with MOAB2 antibody (A and C) and fibrillar Aβ by X-34 labeling (B and D) in the mice induced for TREM2-WT or TREM2-R47H expression during 2–5 mo of age. Scale bar, 1 mm. (E–J) The levels of Aβ42 (E–G) and Aβ40 (H–J) in the buffer soluble (TBS), detergent soluble (TBSX), and insoluble (GND) fractions detected by ELISAs in the mice with TREM2-WT or TREM2-R47H expression during 2–5 mo of age. (K and L) The representative images (K) and quantification (L) of dystrophic neurites by immunofluorescence staining with LAMP1 antibody in the mice expressing TREM2-WT or TREM2-R47H during 2–5 mo of age. Scale bar, 1 mm. n = 11–13 mice/group, mixed sexes. Data are shown as mean ± SEM. Mann–Whitney tests with Bonferroni correction were used for statistical analysis. P values <0.025 were considered to be statistically significant. *, P < 0.025; **, P < 0.01; N.S., not significant. In C–J and L, the data from male and female mice are labeled as solid and open circles, respectively.
Figure S3.
Figure S3.
The protein levels of mouse endogenous Trem2 in 5xFAD/TREM2 mice. The protein levels of mouse Trem2 were detected in the buffer soluble (TBS) and detergent soluble (TBSX) fraction of 5xFAD/TREM2 mouse brain lysates by ELISA. (A–D) The assessment of mouse Trem2 in the middle cohort of 5xFAD/TREM2 animals when TREM2 was expressed from 2 to 5 mo of age (A and B). n = 11–13 mice/group, mixed sexes. The correlation between Trem2 and insoluble Aβ42 was plotted (C and D). (E–H) The assessment of mouse Trem2 in the late cohort of 5xFAD/TREM2 animals when TREM2 was expressed from 5 to 8 mo of age. n = 9–15 mice/group, mixed sexes. The correlation between Trem2 and insoluble Aβ42 were plotted (G and H). Mann–Whitney tests with Bonferroni correction were used for statistical analysis in panels (A, B, E, and F). P values <0.025 were considered to be statistically significant. **, P < 0.01; N.S., not significant. Data are mean ± SEM. Spearman correlation tests were used for statistical analysis in C, D, G, and H. P values <0.05 were considered to be statistically significant. In A, B, E, and F, the data from male and female mice are labeled as solid and open circles, respectively.
Figure 4.
Figure 4.
TREM2 expression in the late stage of amyloid development does not affect amyloid accumulation and neuritic dystrophy. (A–D) The representative images (A and B) and quantification (C and D) of Aβ plaque load by immunofluorescence staining with MOAB2 antibody (A and C) and fibrillar Aβ by X-34 labeling (B and D) in the mice induced for TREM2-WT or TREM2-R47H expression during 5–8 mo of age. Scale bar, 1 mm. (E–J) The levels of Aβ42 (E–G) and Aβ40 (H–J) in the buffer soluble (TBS), detergent soluble (TBSX), and insoluble (GND) fractions detected by ELISAs in the mice expressing TREM2-WT or TREM2-R47H during 5–8 mo of age. (K and L). The representative images (K) and quantification (L) of dystrophic neurites by immunofluorescence staining with LAMP1 antibody in the mice expressing TREM2-WT or TREM2-R47H during 5–8 mo of age. Scale bar, 300 µm. n = 9–15 mice/group, mixed sexes. Mann–Whitney tests followed by Bonferroni correction were used for statistical analysis. P values <0.025 were considered to be statistically significant. N.S., not significant. Data are mean ± SEM. In D–I, L, M, O, and P, the data from male and female mice are labeled as solid and open circles, respectively.
Figure 5.
Figure 5.
Greater microglial surveillance and dynamic responses to amyloid plaque in TREM2-WT mice than TREM2-R47H mice. (A and B) Two-photon in vivo imaging of microglial process velocity in the 5xFAD/TREM2-WT mice or 5xFAD/TREM2-R47H mice at 6 mo of age. Overlaid images taken 10 min apart show process dynamics. Close-up images show process trace per minute of microglia away from amyloid plaque (A) and close to amyloid plaque (B). Scale bar, 10 μm. (C) Quantification of the microglial process velocity in the 5xFAD/TREM2-WT mice and 5xFAD/TREM2-R47H mice. n = 4–5 mice/group, mixed sexes. Two-tailed unpaired Student’s t tests with Bonferroni correction were used for statistical analysis. P values <0.0125 were considered to be statistically significant. *, P < 0.0125; **, P < 0.01; N.S., not significant. (D) Representative time-lapse images of microglia response to amyloid plaque in the 5xFAD/TREM2-WT mice or 5xFAD/TREM2-R47H mice. The same field of views were traced and recorded every 7 d for 28 d. Scale bar, 10 μm. (E) Quantification of the number of microglia within a 30 μm radius of the plaque. Microglia number in each field of view is normalized to day 0. n = 4–5 mice/group, mixed sexes. In C, the data from male and female mice are labeled as solid and open circles, respectively. Two-tailed unpaired Student’s t tests were used for statistical analysis. *, P < 0.05. Data are shown as mean ± SEM.
Figure 6.
Figure 6.
Suppression of DAM signature with TREM2 expression at the early amyloid seeding stage. (A) Schematic representation of experimental procedures for scRNA-seq of brains from 5xFAD/TREM2 mice with TREM2 induction at the early amyloid seeding stage (0–3.5 mo of age). (B) UMAP plot showing 26 distinguished cell clusters and their annotated cell types. n = 6 mice per group (equal male and female). 216,436 total cells were analyzed. (C) Heatmap showing the expression of marker genes in different annotated cell types. (D) Bar graph showing the proportion of cell types in each of the four groups. (E) Heatmap showing the expression of marker genes in the microglia subclusters. (F and G) Number of DEGs for all the cell clusters in the comparison between induced versus Ctrl groups of 5xFAD/TREM2-WT (F) or 5xFAD/TREM2-R47H (G) mice. (H and I) Volcano plots for DEGs of induced versus Ctrl groups in microglia subcluster 11 (DAM) in 5xFAD/TREM2-WT (H) or 5xFAD/TREM2-R47H (I) group. (J and K) Top five canonical pathways enriched by DEGs from cluster 11 in 5xFAD/TREM2-WT (J) or 5xFAD/TREM2-R47H (K) group. The threshold of significant P value is 0.05. MAST tests were used for statistical analysis of DEGs while correcting for sex differences. (L and M) Combined RNAscope and immunofluorescent analyses of Apoe expression by microglia in the presence of Aβ plaques. Expression of Apoe was visualized using RNAscope probe, while amyloid plaques and microglia were visualized by staining with the anti-Aβ (MOAB2) and anti-IBA1 antibodies, respectively. Nuclei were visualized with DAPI. Representative images showing Apoe (white), microglia (violet), amyloid plaque (olive), and DAPI (blue) staining (L). Scale bar, 20 μm. The microglial Apoe expression was quantified and compared (M). n = 5 mice/group. Two-tailed unpaired Student’s t tests were used for statistical analysis. *, P < 0.05. Data are mean ± SEM. (N and O) Representative images showing CD68 (red), IBA1 (green), and amyloid plaque (X-34+, blue) staining (N). Scale bar, 50 μm. The CD68 coverage areas in the IBA1+ microglia were quantified and compared (O). n = 11–13 mice/group, mixed sexes. Data are shown as mean ± SEM. Mann–Whitney tests with Bonferroni correction were used for statistical analysis. P values <0.025 were considered to be statistically significant. *, P < 0.025; **, P < 0.01; N.S., not significant. In M and O, the data from male and female mice are labeled as solid and open circles, respectively. MG, microglia; AS, astrocyte; VC, vascular cell; OL, oligodendrocyte lineage cell; Neu, neuron; CP, choroid plexus cell; EP, ependymal cell; Mφ, macrophage.
Figure S4.
Figure S4.
TREM2-mediated regulatory network in the early amyloid seeding stage. (A) Sankey plot showing comparison of activity of the regulators between induced and control groups in 5xFAD/TREM2-WT (left) and 5xFAD/TREM2-R47H (right) mice. n = 6 mice per group (equal male and female). (B) Dot plot for KEGG pathway enrichment analysis. KEGG enrichment analysis of significantly upregulated and downregulated regulators (FDR < 0.05). A total of 24 enriched pathways are shown (red dots: upregulated regulators; blue dots: downregulated regulators). The size of circle represents significance level (−Log10 P values). (C and D) Circos plot summarizing the 24 enriched pathways and associated regulators in the 5xFAD/TREM2-WT (C), and 17 enriched pathways and associated regulators in the 5xFAD/TREM2-R47H (D) groups. (E) TREM2 regulatory networks in 5xFAD/TREM2-WT mice. TREM2 (regulator) and its downstream genes are shown. The network includes 31 regulators (3 TFs, 5 co-TFs, and 23 surface proteins) with the significant activity (Benjamini–Hochberg adjusted P value <0.05). Each TF, co-TF, surface protein, and DEG is represented by a diamond, square, hexagon, and circle, respectively. The regulators with positive activity and DEGs with upregulation are shown in red color, and the regulators with negative activity and DEGs with downregulation are indicated in blue color. The arrow shows the direction of regulation. (F) TREM2 regulatory networks in 5xFAD/TREM2-R47H mice. The network includes 40 regulators (7 TFs, 3 co-TFs, and 30 surface proteins) with the significant activity (Benjamini–Hochberg adjusted P value <0.05).
Figure 7.
Figure 7.
Reduction of DAM with TREM2-WT expression in the amyloid seeding stage but not the amyloid rapid growth period. (A) scRNA-seq data from the early cohort of 5xFAD/TREM2 mice (0–3.5 mo) were mapped to the middle amyloid cohort (2–5 mo). UMAP visualization of the middle cohort identifies clusters of the major cell types from predicted labels. (B) The prediction scores of cell types mapped from the early to middle cohort are shown. (C) Microglia subclusters from the early cohort were transferred to microglial cells from the middle cohort. The resulting de novo UMAP shows microglial subtypes of the early cohort and the label-transferred subtypes of the middle cohort. (D) Heatmap showing the expression of specific maker genes in different annotated microglia subtypes. (E and F) Prediction scores of early cohort microglia (E) and middle cohort microglia (F) mapped from cluster 2 (XO4+, Aβ-phagocytosing) microglia from Grubman et al. (2021). (G and H) The changes in cell numbers in each microglia subcluster were compared between induced versus Ctrl groups in 5xFAD/TREM2-WT and 5xFAD/TREM2-R47H mice from the early (G) and middle cohort (H). Differential abundance was assessed with Milo (miloR version 0.1.0). Subclusters with differentially abundant neighborhoods are highlighted. **, spatial FDR < 0.01.
Figure 8.
Figure 8.
TREM2-R47H expression in the amyloid rapid growth period upregulates the MHCII genes but does not change the phagocytic phenotype of microglia. (A and B) Numbers of DEGs in all the microglia subclusters between induced versus Ctrl groups of 5xFAD/TREM2-WT (A) or 5xFAD/TREM2-R47H (B) mice in the middle cohort are shown. MAST tests were used for statistical analysis of DEGs while correcting for sex differences. (C and D) Volcano plots showing DEGs of induced versus Ctrl groups in DAM2 microglia subcluster in 5xFAD/TREM2-WT (C) or 5xFAD/TREM2-R47H (D) group. (E) Heatmap showing the upregulation of a group of MHCII genes. (F and G) Top five canonical pathways enriched by DEGs from DAM2 (F) and MHCII+ (G) subclusters in 5xFAD/TREM2-R47H mice. The threshold of significant P value is 0.05. (H–J) CD68 and CD11c staining showing the phagocytic microglia in 5xFAD/TREM2 mice at middle stage. Representative images showing the CD68 (red), CD11c (violet), IBA1 (green), and amyloid plaque (X-34+, blue) staining (N). Scale bar, 50 μm. The CD68 (I) and CD11c (J) coverage areas in the IBA1+ microglia were quantified and compared. n = 11–13 mice/group, mixed sexes (the data from male and female mice are labeled as solid and open circles, respectively). Data are shown as mean ± SEM. Mann–Whitney tests with Bonferroni correction were used for statistical analysis. P values <0.025 were considered to be statistically significant. N.S., not significant.
Figure 9.
Figure 9.
The effects of TREM2 on DAM gene profiles in Wang et al. (2020). The scRNA-seq data of microglia after TREM2 agonistic antibody (AL002c) treatment in amyloid mouse models expressing the TREM2 common variant (5xFAD/CV, referred to as 5xFAD/TREM2-WT) or TREM2-R47H (5xFAD/R47H, referred to as 5xFAD/TREM2-R47H) from Wang et al. (2020) were reanalyzed. (A) Illustration of the scRNA-seq experimental design and the UMAP of microglia subclustered adapted from Wang et al. (2020). HM1-5, homeostatic microglia; TM, transitioning microglia; IRM, interferon-response microglia; PM1-2, proliferating microglia; SM, S-phase microglia. (B) The violin plot showing the microglia-specific marker gene expression. (C and D) WGCNA was performed in the DAM clusters 8 and 3. Network plots of the top 25 genes with the highest intramodular connectivity (hub genes) in turquoise and blue modules from cluster 8 (C), and blue and brown modules from cluster 3 (D) are shown. (E–H) Pearson correlation between TREM2 gene expression level and the eigengene (ME) of turquoise (E) and blue (F) modules in cluster 8, and blue (G) and brown (H) modules in cluster #3 (n = 776 meta cells for cluster 8, 2,054 meta cells for cluster 3). (I–L) The effects of TREM2 antibody AL002c treatment on the MEs of turquoise (I) and blue (J) modules in cluster 8, and the blue (K) and brown (L) modules in cluster 3 were analyzed (n = 75, 81, 369, and 251 meta cells for WT-IgG, WT-AL002c, R47H-IgG, and R47H-AL002c groups in cluster 8, respectively; n = 162, 370, 686, and 836 meta cells for WT-IgG, WT-AL002c, R47H-IgG, and R47H-AL002c groups in cluster 3, respectively). Bonferroni corrected P values were from Kruskal−Wallis tests followed by Dunn’s test.

References

    1. Aguzzi, A., Barres B.A., and Bennett M.L.. 2013. Microglia: Scapegoat, saboteur, or something else?. Science. 339:156–161. 10.1126/science.1227901 - DOI - PMC - PubMed
    1. Alvarez, M.J., Shen Y., Giorgi F.M., Lachmann A., Ding B.B., Ye B.H., and Califano A.. 2016. Functional characterization of somatic mutations in cancer using network-based inference of protein activity. Nat. Genet. 48:838–847. 10.1038/ng.3593 - DOI - PMC - PubMed
    1. Atagi, Y., Liu C.C., Painter M.M., Chen X.F., Verbeeck C., Zheng H., Li X., Rademakers R., Kang S.S., Xu H., et al. . 2015. Apolipoprotein E is a ligand for triggering receptor expressed on myeloid cells 2 (TREM2). J. Biol. Chem. 290:26043–26050. 10.1074/jbc.M115.679043 - DOI - PMC - PubMed
    1. Bailey, C.C., DeVaux L.B., and Farzan M.. 2015. The triggering receptor expressed on myeloid cells 2 binds apolipoprotein E. J. Biol. Chem. 290:26033–26042. 10.1074/jbc.M115.677286 - DOI - PMC - PubMed
    1. Bemiller, S.M., McCray T.J., Allan K., Formica S.V., Xu G., Wilson G., Kokiko-Cochran O.N., Crish S.D., Lasagna-Reeves C.A., Ransohoff R.M., et al. . 2017. TREM2 deficiency exacerbates tau pathology through dysregulated kinase signaling in a mouse model of tauopathy. Mol. Neurodegener. 12:74. 10.1186/s13024-017-0216-6 - DOI - PMC - PubMed

Publication types