. 2023 Mar 16;114(1):60-67.
doi: 10.1093/jhered/esac055.

Reference genome of the Woolly Sculpin, Clinocottus analis

Affiliations

Reference genome of the Woolly Sculpin, Clinocottus analis

Daniel B Wright et al. J Hered. .

Abstract

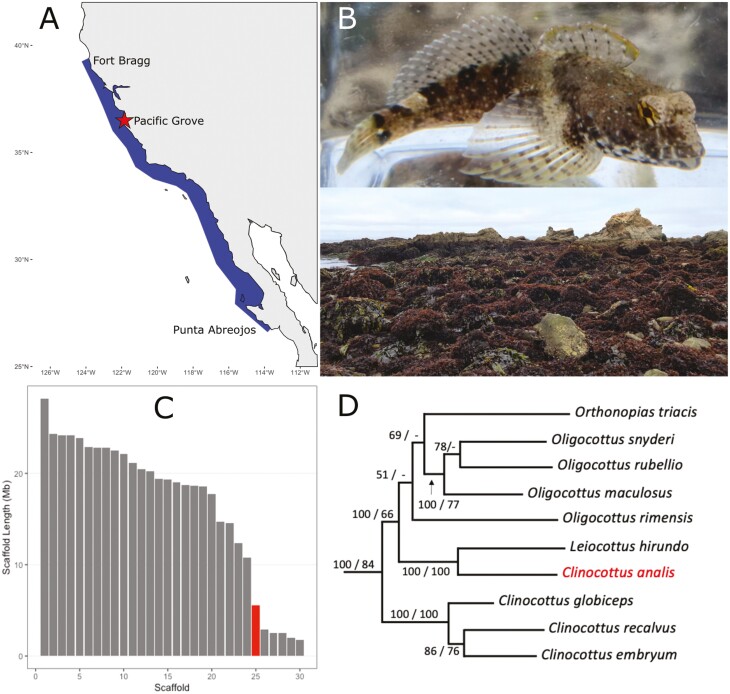
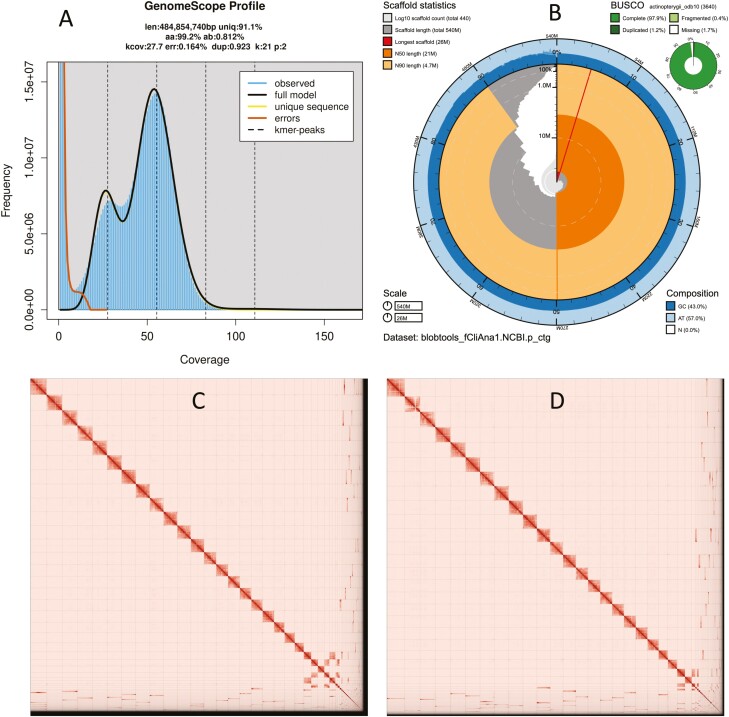
Sculpins (Family Cottidae) are generally cold-temperate intertidal reef fishes most commonly found in the North Pacific. As part of the California Conservation Genomics Project (CCGP), we sequenced the genome of the Woolly Sculpin, Clinocottus analis, to establish a genomic model for understanding phylogeographic structure of inshore marine taxa along the California coast. These patterns, in turn, should further inform the design of marine protected areas using dispersal models based on genomic data. The small genome of C. analis is typical of marine fishes at less than 1 Gb (genome size = 538 Mb), and our assembly is near-chromosome level (contig N50 = 9.1 Mb, scaffold N50 = 21 Mb, BUSCO completeness = 97.9%). Within the context of the CCGP, the Woolly Sculpin genome will be used as a reference for future whole-genome resequencing projects aimed at enhancing our knowledge of the population structure of the species, and efficacy of marine protected areas across the state.

Keywords: CCGP; California Conservation Genomics Project; marine protected areas.


Figures

Fig. 1.
Fig. 1.
A) Distribution of the Woolly Sculpin, Clinocottus analis. Woolly Sculpin are found in the rocky shore intertidal from Fort Bragg, California, USA to Punta Abreojos, Baja California, Mexico. The collection site of the sequenced individual, Pacific Grove, California, is indicated by the red star on the map. B) Top: an image of a Woolly Sculpin (photo by P.R. Blaimont). Bottom: image of Franklin Point, California at low tide, an example of representative intertidal habitat for the Woolly Sculpin. C) Distribution of scaffolds of the genome assembly for the Woolly Sculpin. Only the 30 largest scaffolds are shown in decreasing order of size from left to right. Scaffold size is presented in Mega base pairs (Mb). Scaffold 25, which is discussed in the paper, is highlighted in red. D) Bayesian reconstruction of the nonmonophyletic clade that includes the genus Clinocottus using 2 mitochondrial genes (Cyt b, NADH1) and 1 nuclear gene (S7) redrawn from Ramon and Knope (2008). Bootstrap values are shown for Bayesian inference and maximum likelihood, respectively. Clinocottus analis is highlighted in red.
Fig. 2.
Fig. 2.
Visual overview of genome assembly metrics. A) K-mer spectra output generated from PacBio HiFi data without adapters using GenomeScope 2.0. The bimodal pattern observed corresponds to a diploid genome. K-mers covered at lower coverage and lower frequency correspond to differences between haplotypes, whereas the higher coverage and higher frequency k-mers correspond to the similarities between haplotypes. B) BlobToolKit Snail plot showing a graphical representation of the quality metrics presented in Table 2 for the Clinocottus analis primary assembly. The plot circle represents the full size of the assembly. From the inside-out, the central plot covers length-related metrics. The red line represents the size of the longest scaffold; all other scaffolds are arranged in size-order moving clockwise around the plot and drawn in gray starting from the outside of the central plot. Dark and light orange arcs show the scaffold N50 and scaffold N90 values. The central light gray spiral shows the cumulative scaffold count with a white line at each order of magnitude. White regions in this area reflect the proportion of Ns in the assembly. The dark vs. light blue area around it shows mean, maximum and minimum GC vs. AT content at 0.1% intervals (Challis et al. 2020). Omni-C contact maps for the primary (C) and alternate (D) genome assembly generated with PretextSnapshot. Hi-C contact maps translate proximity of genomic regions in 3D space to contiguous linear organization. Each cell in the contact map corresponds to sequencing data supporting the linkage (or join) between 2 such regions.

References

    1. Abdennur N, Mirny LA.. Cooler: scalable storage for Hi-C data and other genomically labeled arrays. Bioinformatics. 2020;36(1):311–316. - PMC - PubMed
    1. Allio R, Schomaker-Bastos A, Romiguier J, Prosdocimi F, Nabholz B, Delsuc F.. MitoFinder: efficient automated large-scale extraction of mitogenomic data in target enrichment phylogenomics. Mol Ecol Resour. 2020;20(4):892–905. - PMC - PubMed
    1. Buser TJ, Andrés López J.. Molecular phylogenetics of sculpins of the subfamily Oligocottinae (Cottidae). Mol Phylogenet Evol. 2015;86:64–74. - PubMed
    1. Camacho C, Coulouris G, Avagyan V, Ma N, Papadopoulos J, Bealer K, Madden TL.. BLAST+: architecture and applications. BMC Bioinformatics. 2009;10(1):1–9. - PMC - PubMed
    1. Challis R, Richards E, Rajan J, Cochrane G, Blaxter M.. BlobToolKit—interactive quality assessment of genome assemblies. G3. 2020;10(4):1361–1374. - PMC - PubMed

Publication types