. 2022 Sep 16;377(6612):1328-1332.
doi: 10.1126/science.abm7759. Epub 2022 Sep 15.

Codiversification of gut microbiota with humans

Affiliations

Codiversification of gut microbiota with humans

Taichi A Suzuki et al. Science. .

Abstract

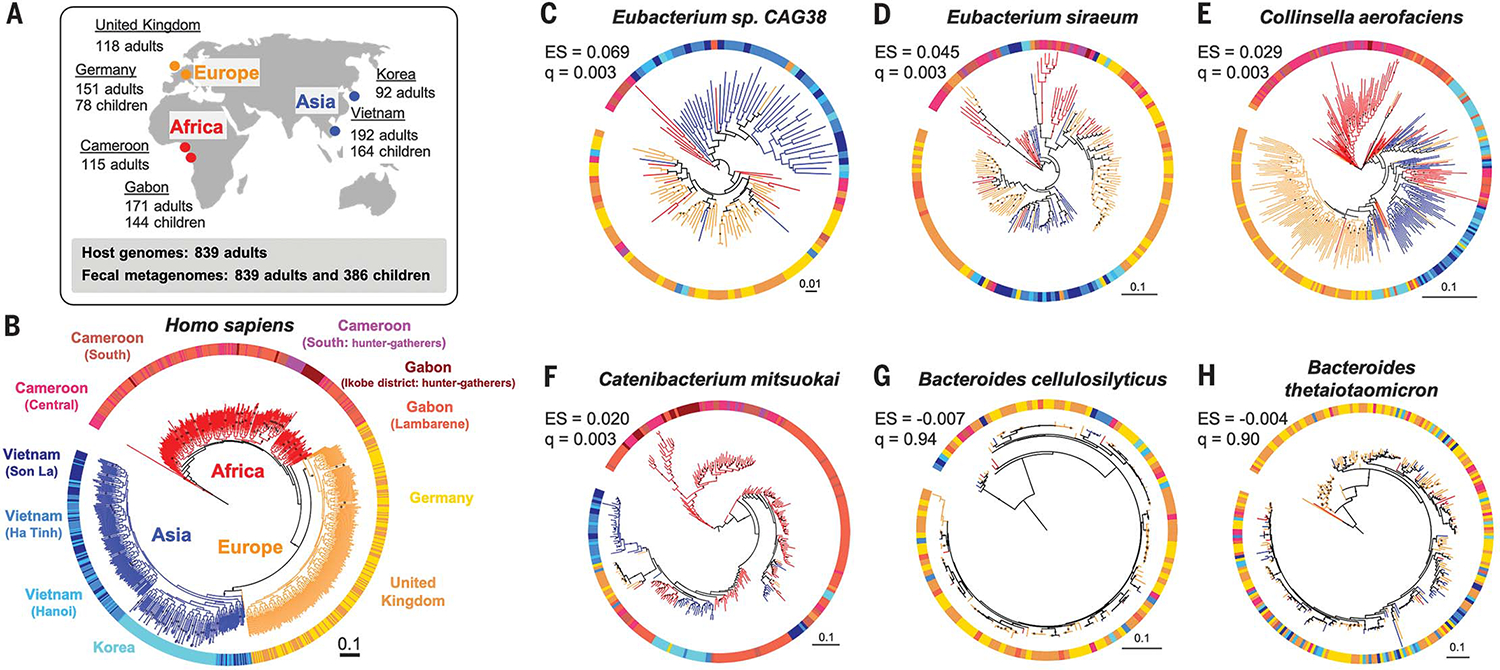
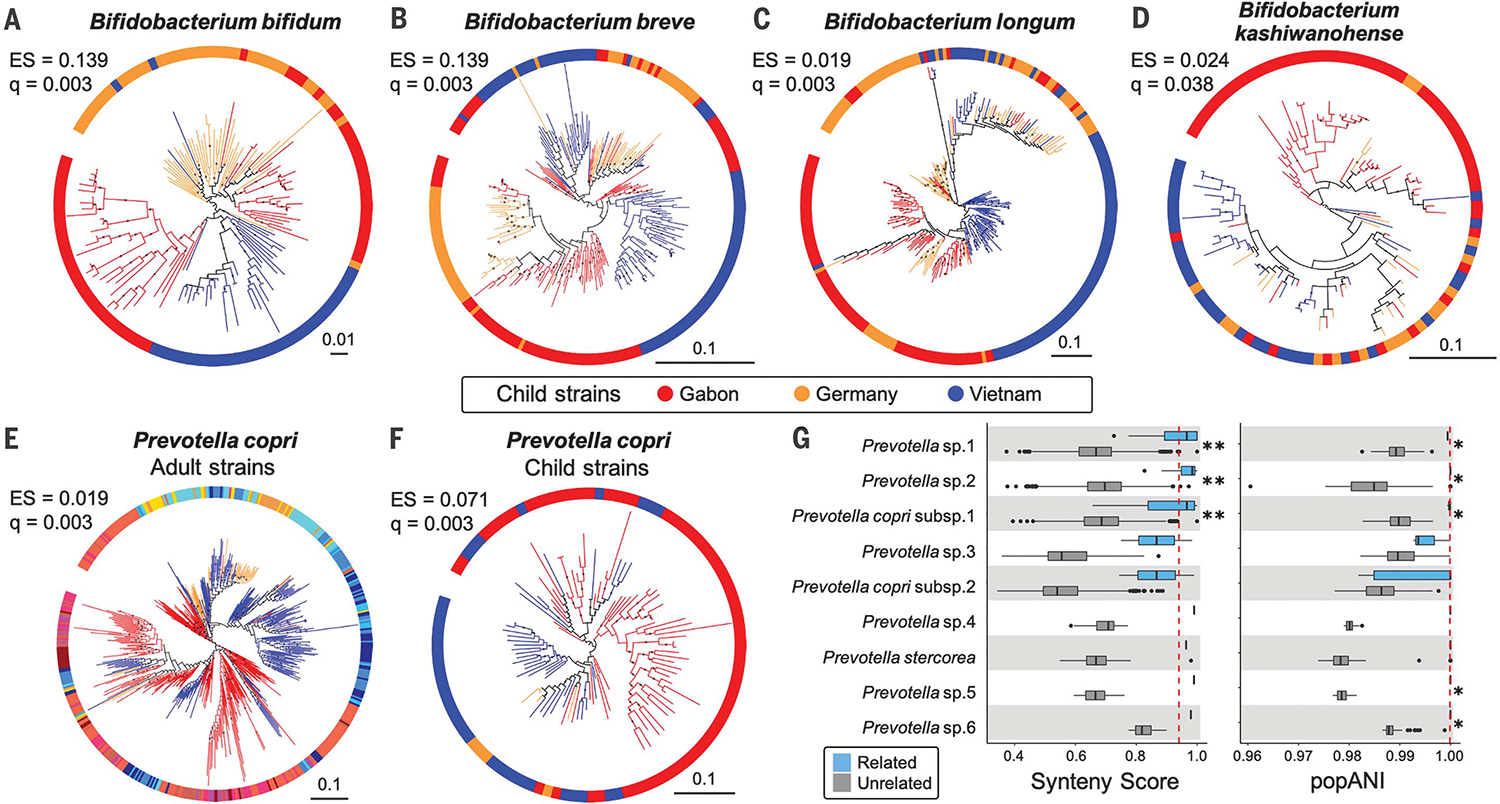
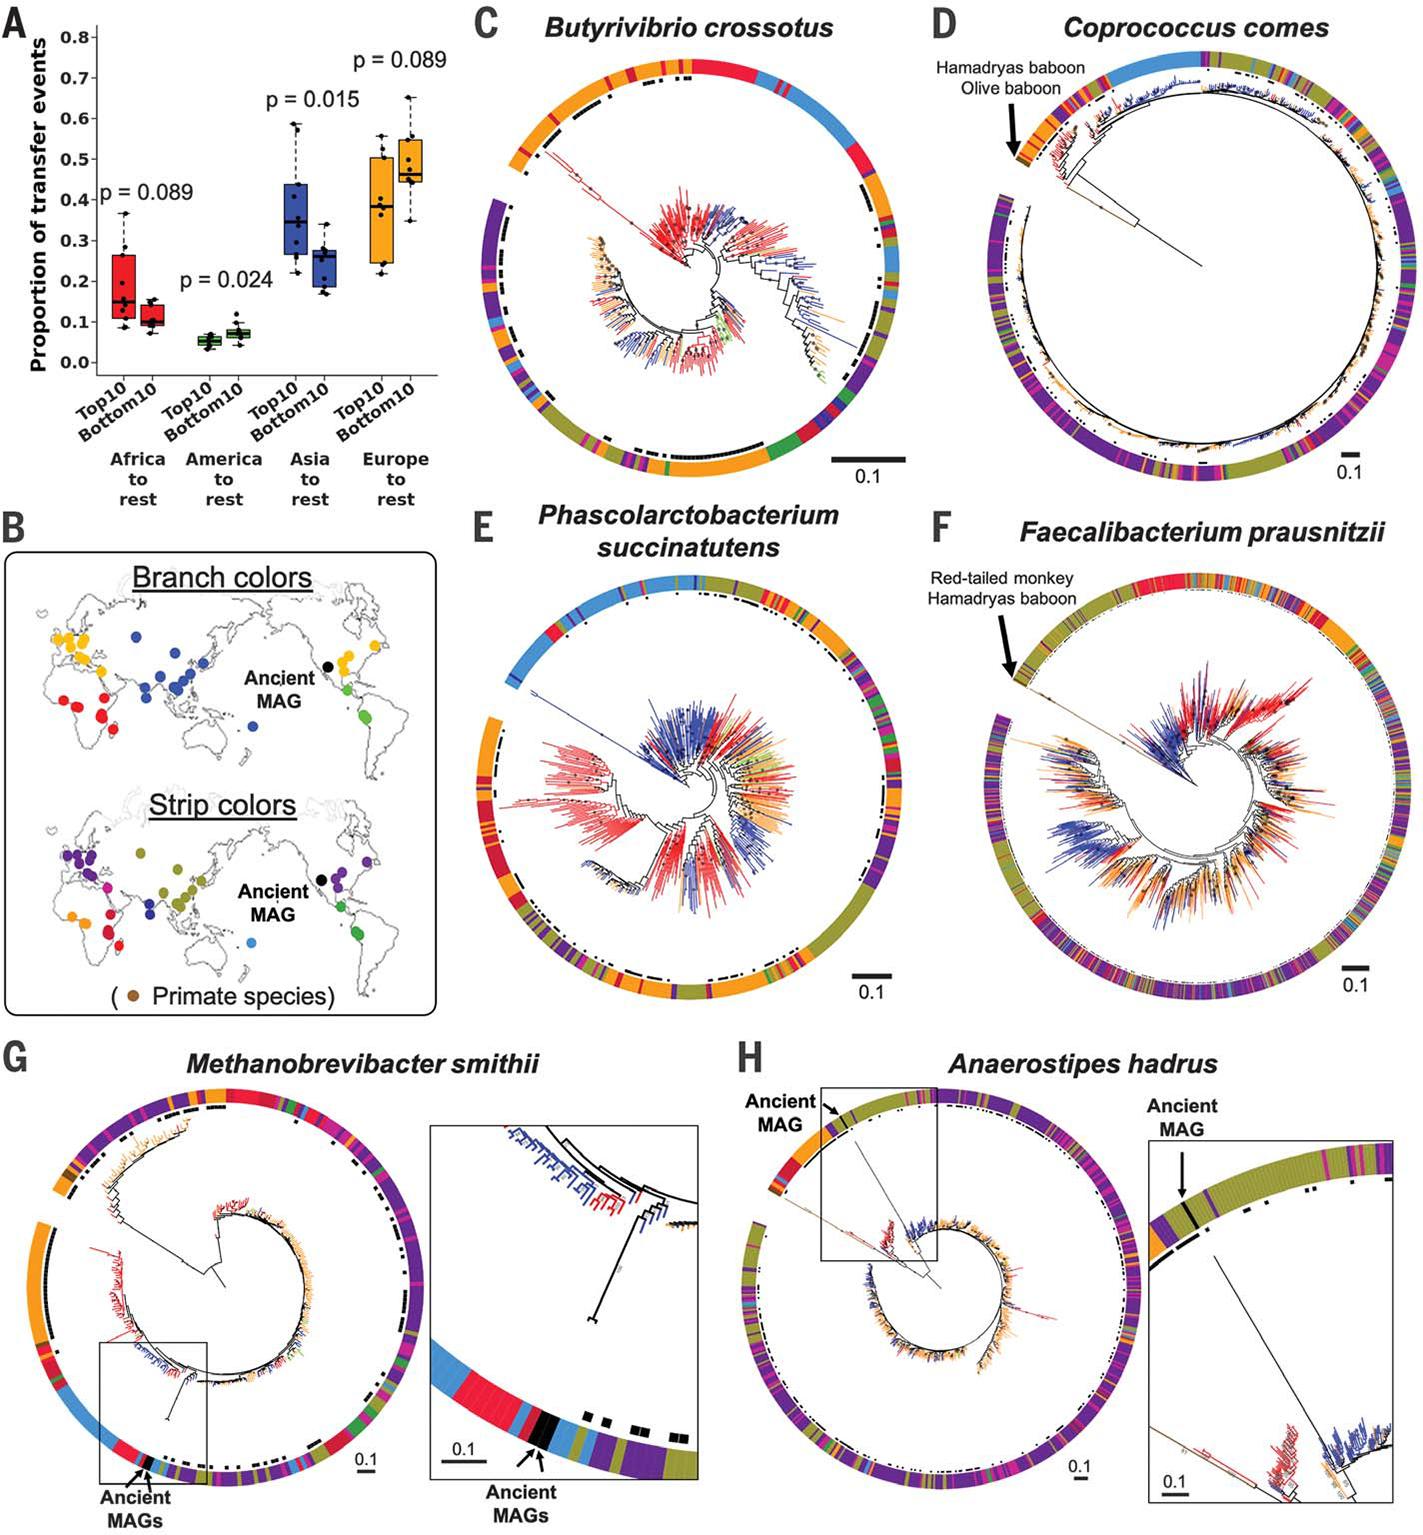
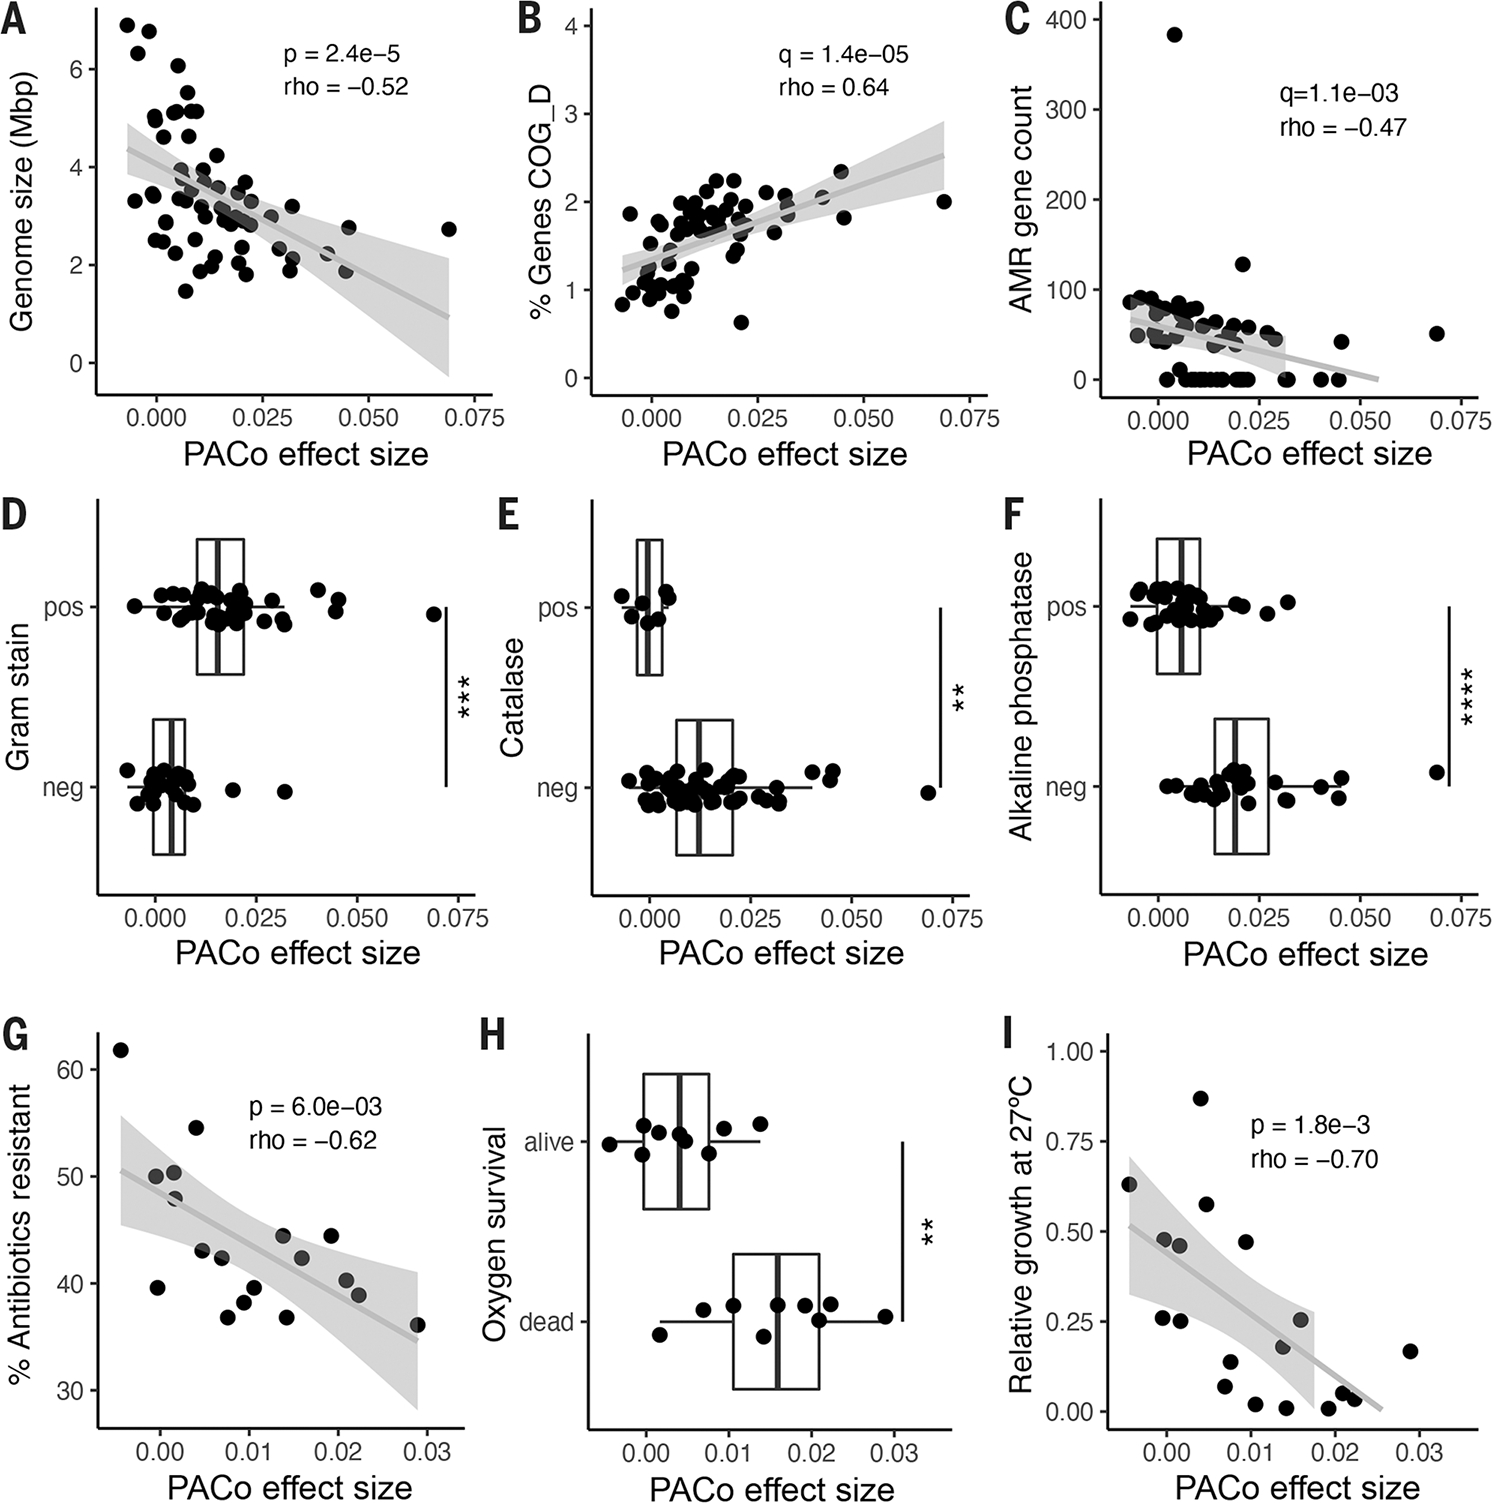
The gut microbiomes of human populations worldwide have many core microbial species in common. However, within a species, some strains can show remarkable population specificity. The question is whether such specificity arises from a shared evolutionary history (codiversification) between humans and their microbes. To test for codiversification of host and microbiota, we analyzed paired gut metagenomes and human genomes for 1225 individuals in Europe, Asia, and Africa, including mothers and their children. Between and within countries, a parallel evolutionary history was evident for humans and their gut microbes. Moreover, species displaying the strongest codiversification independently evolved traits characteristic of host dependency, including reduced genomes and oxygen and temperature sensitivity. These findings all point to the importance of understanding the potential role of population-specific microbial strains in microbiome-mediated disease phenotypes.


Conflict of interest statement

Competing interests: G.K. is the founder and a board member of KoBioLabs, Inc. T.D.S is a cofounder of ZOE Ltd., a personalized nutrition company.

Figures

Fig. 1.
Fig. 1.. The human phylogeny and selected bacterial phylogenies.
(A) Sampling locations and sizes. (B) A maximum likelihood phylogeny of human subjects based on 20,506 single-nucleotide polymorphisms. Tree branch colors indicate continental origins. Outer strip colors indicate finer geographic locations, and labels refer to sampling locations. (C to H) Maximum likelihood phylogenies for six bacterial species based on species-specific marker genes. PACo effect size (ES) and q values (q) are shown. Bootstrap values >50% are plotted on branches, and all phylogenies are rooted at the midpoint. Colors of branches and outer strips correspond to sampling locations shown in (B). The scale bars show substitutions per site for all phylogenies
Fig. 2.
Fig. 2.. Bacterial phylogenies derived from children’s microbiomes and strain sharing with their mothers.
(A to D) Four species of Bifidobacterium show evidence of cophylogeny based on mothers’ genotypes. (E) Phylogeny of P. copri strains in adults and (F) in children. The colors in (E) correspond to those in Fig. 1B. Bootstrap values ≥50% are shown as black dots on branches, and the phylogenies are rooted at the midpoint. The scales show substitutions per site. (G) Prevotella strain sharing between mothers and their own children (“related,” blue boxplots) compared with sharing between women and unrelated children (“unrelated,” gray boxplots). (Left) Strain comparisons using SynTracker (39). (Right) Strain comparisons using inStrain (40). Dashed red lines indicate the thresholds for strain sharing events [0.96 for synteny; 0.99999 for popANI (population-level average nucleotide identity)]. *P < 0.05 and **P < 5 × 10⁻⁵ using Wilcoxon-Mann-Whitney test. Codiversification test results for all 20 common child taxa are reported in table S11.
Fig. 3.
Fig. 3.. Strain transfer events and microbial phylogenies including data from public metagenomes.
(A) Results from stochastic character mapping on microbial phylogenies including six countries from this study and public metagenomes. The boxplots compare the occurrence of transfer events between sampling regions between the top 10 and bottom 10 taxa identified by PACo ES. P values are based on the Wilcoxon rank sum test. (B) Sampling locations and color keys correspond to the panels that follow. The colors of the branches and outer color strip indicate the estimated host genetic structure based on sampling locations (21). Black dots next to the color strip indicate samples from the original six countries. Example phylogenies: (C) Butyrivibrio crossotus, where African strains are basal; (D) Coprococcus comes, where primate strains are basal, followed by African strains; (E) Phascolarctobacterium succinatutens, where Asian strains are basal; (F) Faecalibacterium prausnitzii, where strains from primates are basal, followed by strains from Asia. (G and H) Examples of microbial phylogenies with ancient MAGs recovered from paleofeces of Native Americans. Bootstrap values ≥50% are shown on branches. All trees were rooted at the midpoint. The scale bars show substitutions per site
Fig. 4.
Fig. 4.. Genomic and functional features correlated with codiversification.
PACo effect size correlated with: (A) Median genome size per species. (B) Percentage of total genes in the genome annotated to COG D for cell cycle and replication. (C) Number of antimicrobial resistance (AMR) markers annotated per genome. (D) Predicted Gram stain per species. (E) Predicted catalase activity per species. (F) Predicted alkaline phosphatase activity. (G) Percentage of antibiotics to which the species was resistant in vitro in a panel of 144 common antimicrobials. (H) Survival in vitro after 48 hours of O2 exposure for a subset of culturable species. (I) Relative growth of each species in vitro at 27°C compared with 37°C. (A) to (F): n = 59 species; (G) to (I): n = 18 species. Statistical significance was determined by Spearman’s correlation [(A) to (C), (G), and (I)] or by Wilcoxon rank sum test [(D) to (F) and (H)]. Exploratory analyses were corrected using FDR across all gene categories and predicted traits [q value; (B) to (F)]. pos, positive for the given trait; neg, negative for the given trait. **P < 0.01, ***P < 0.001, ****P < 0.0001. Exact P values are reported in table S18.

Comment in

  • Loyal gut microbes.
    Moeller AH. Moeller AH. Science. 2022 Sep 16;377(6612):1263-1264. doi: 10.1126/science.ade2879. Epub 2022 Sep 15. Science. 2022. PMID: 36108001

References

    1. Gupta VK, Paul S, Dutta C, Front. Microbiol. 8, 1162 (2017). - PMC - PubMed
    1. Costea PI et al. Mol. Syst. Biol. 13, 960 (2017). - PMC - PubMed
    1. Pasolli E et al. Cell 176, 649–662.e20 (2019). - PMC - PubMed
    1. Tett A et al. Cell Host Microbe 26, 666–679.e7 (2019). - PMC - PubMed
    1. Karcher N et al. Genome Biol. 21, 138 (2020). - PMC - PubMed