. 2022 Dec 2;12(12):2800-2819.
doi: 10.1158/2159-8290.CD-22-0287.

Serial Profiling of Circulating Tumor DNA Identifies Dynamic Evolution of Clinically Actionable Genomic Alterations in High-Risk Neuroblastoma

Affiliations

Serial Profiling of Circulating Tumor DNA Identifies Dynamic Evolution of Clinically Actionable Genomic Alterations in High-Risk Neuroblastoma

Kristopher R Bosse et al. Cancer Discov. .

Abstract

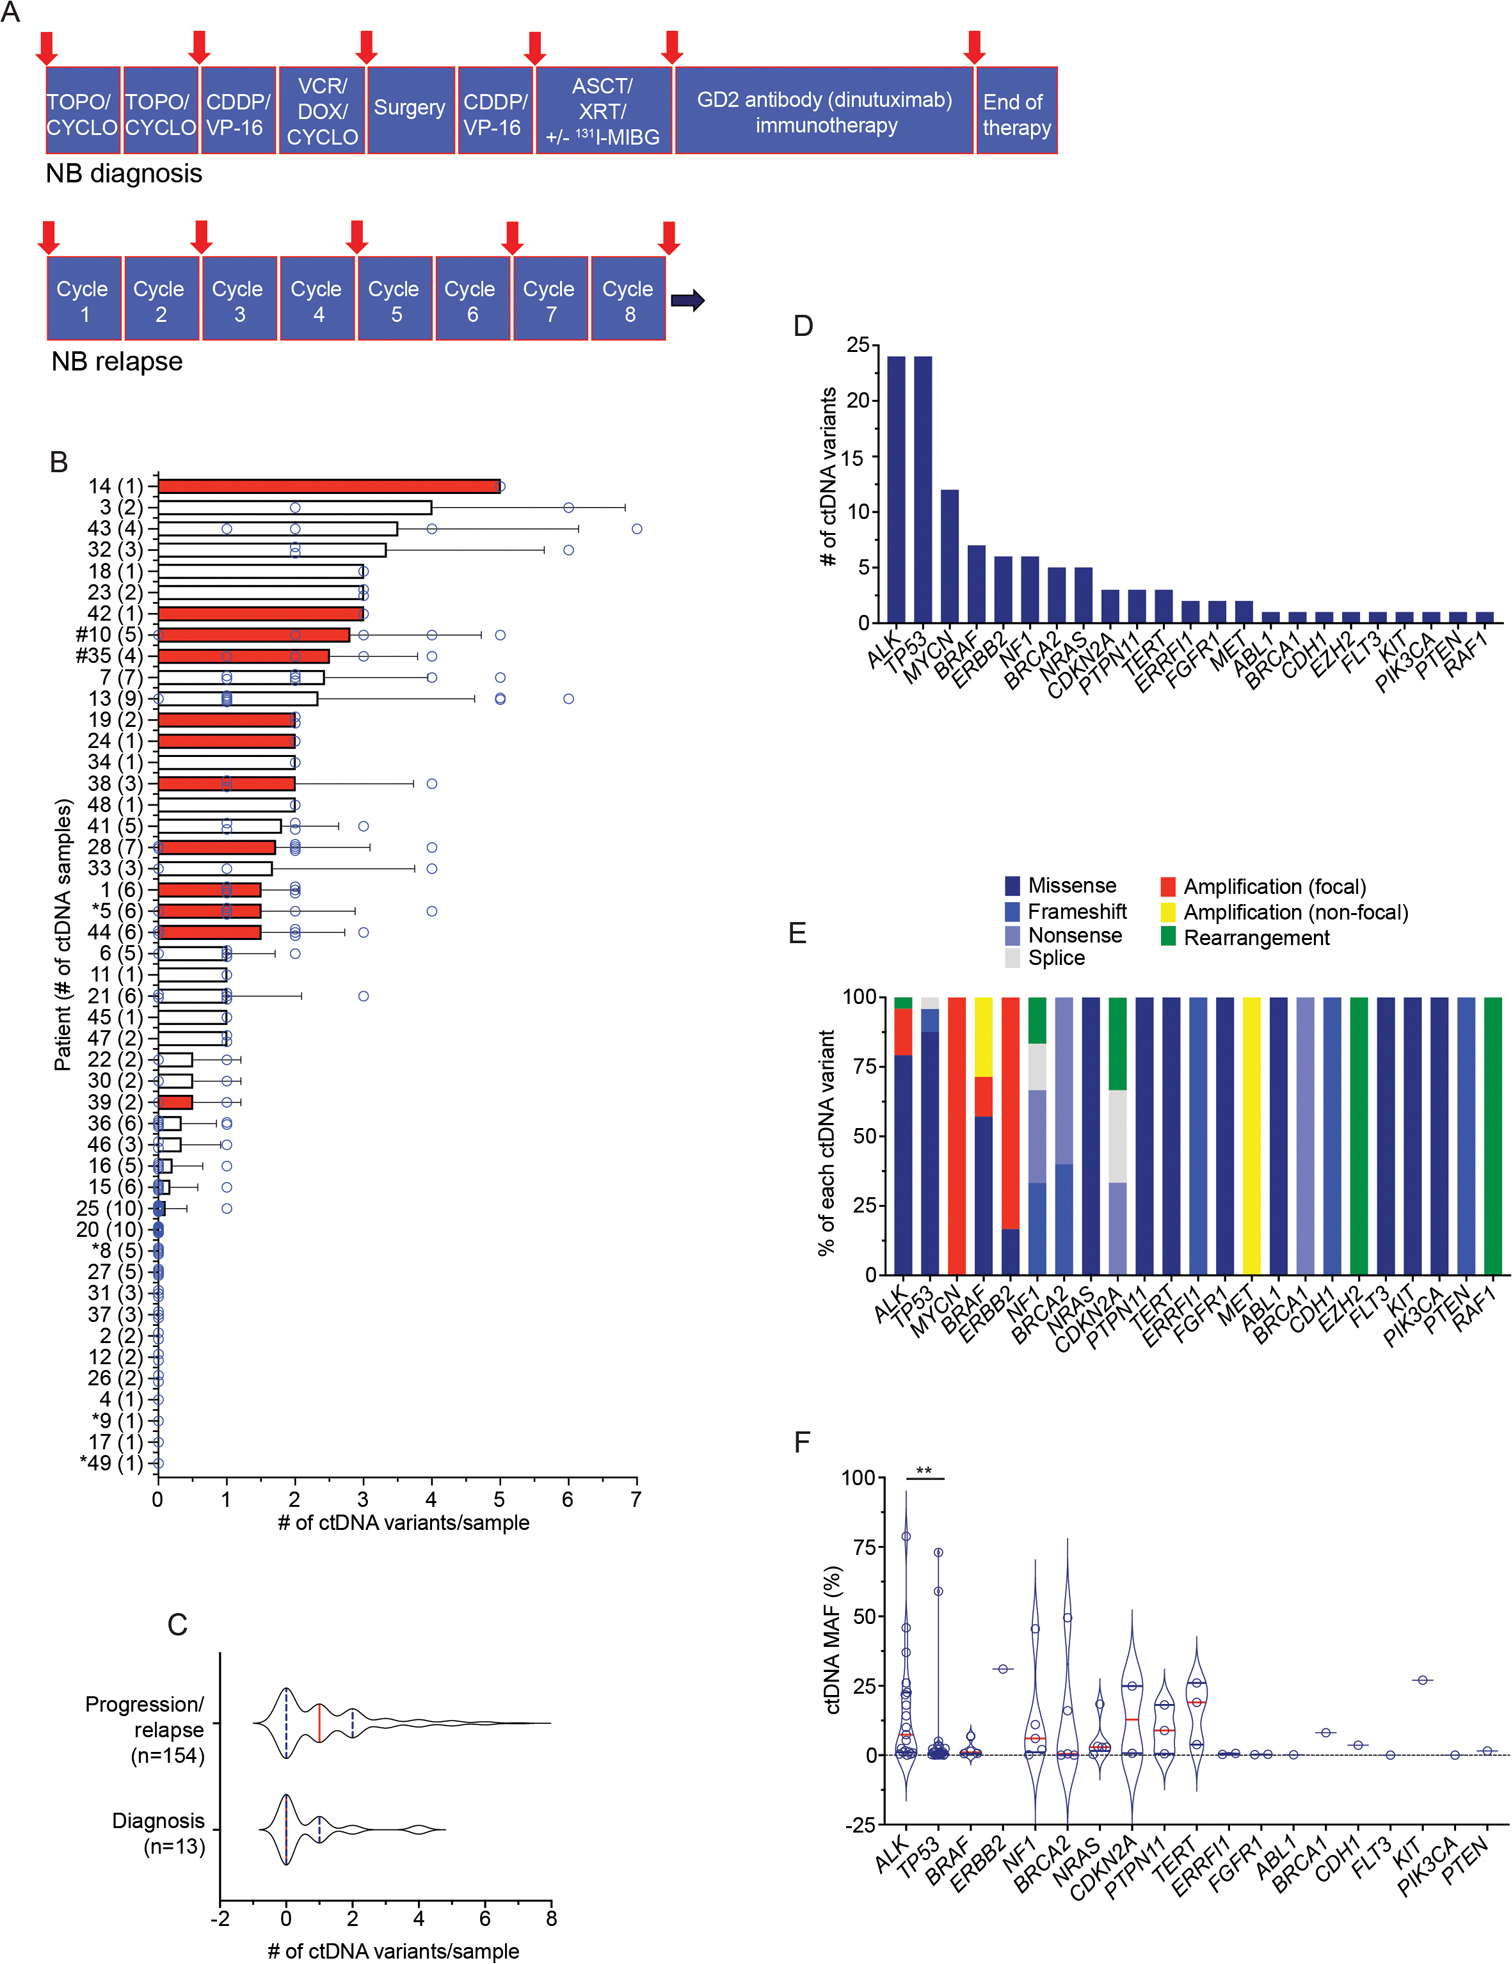
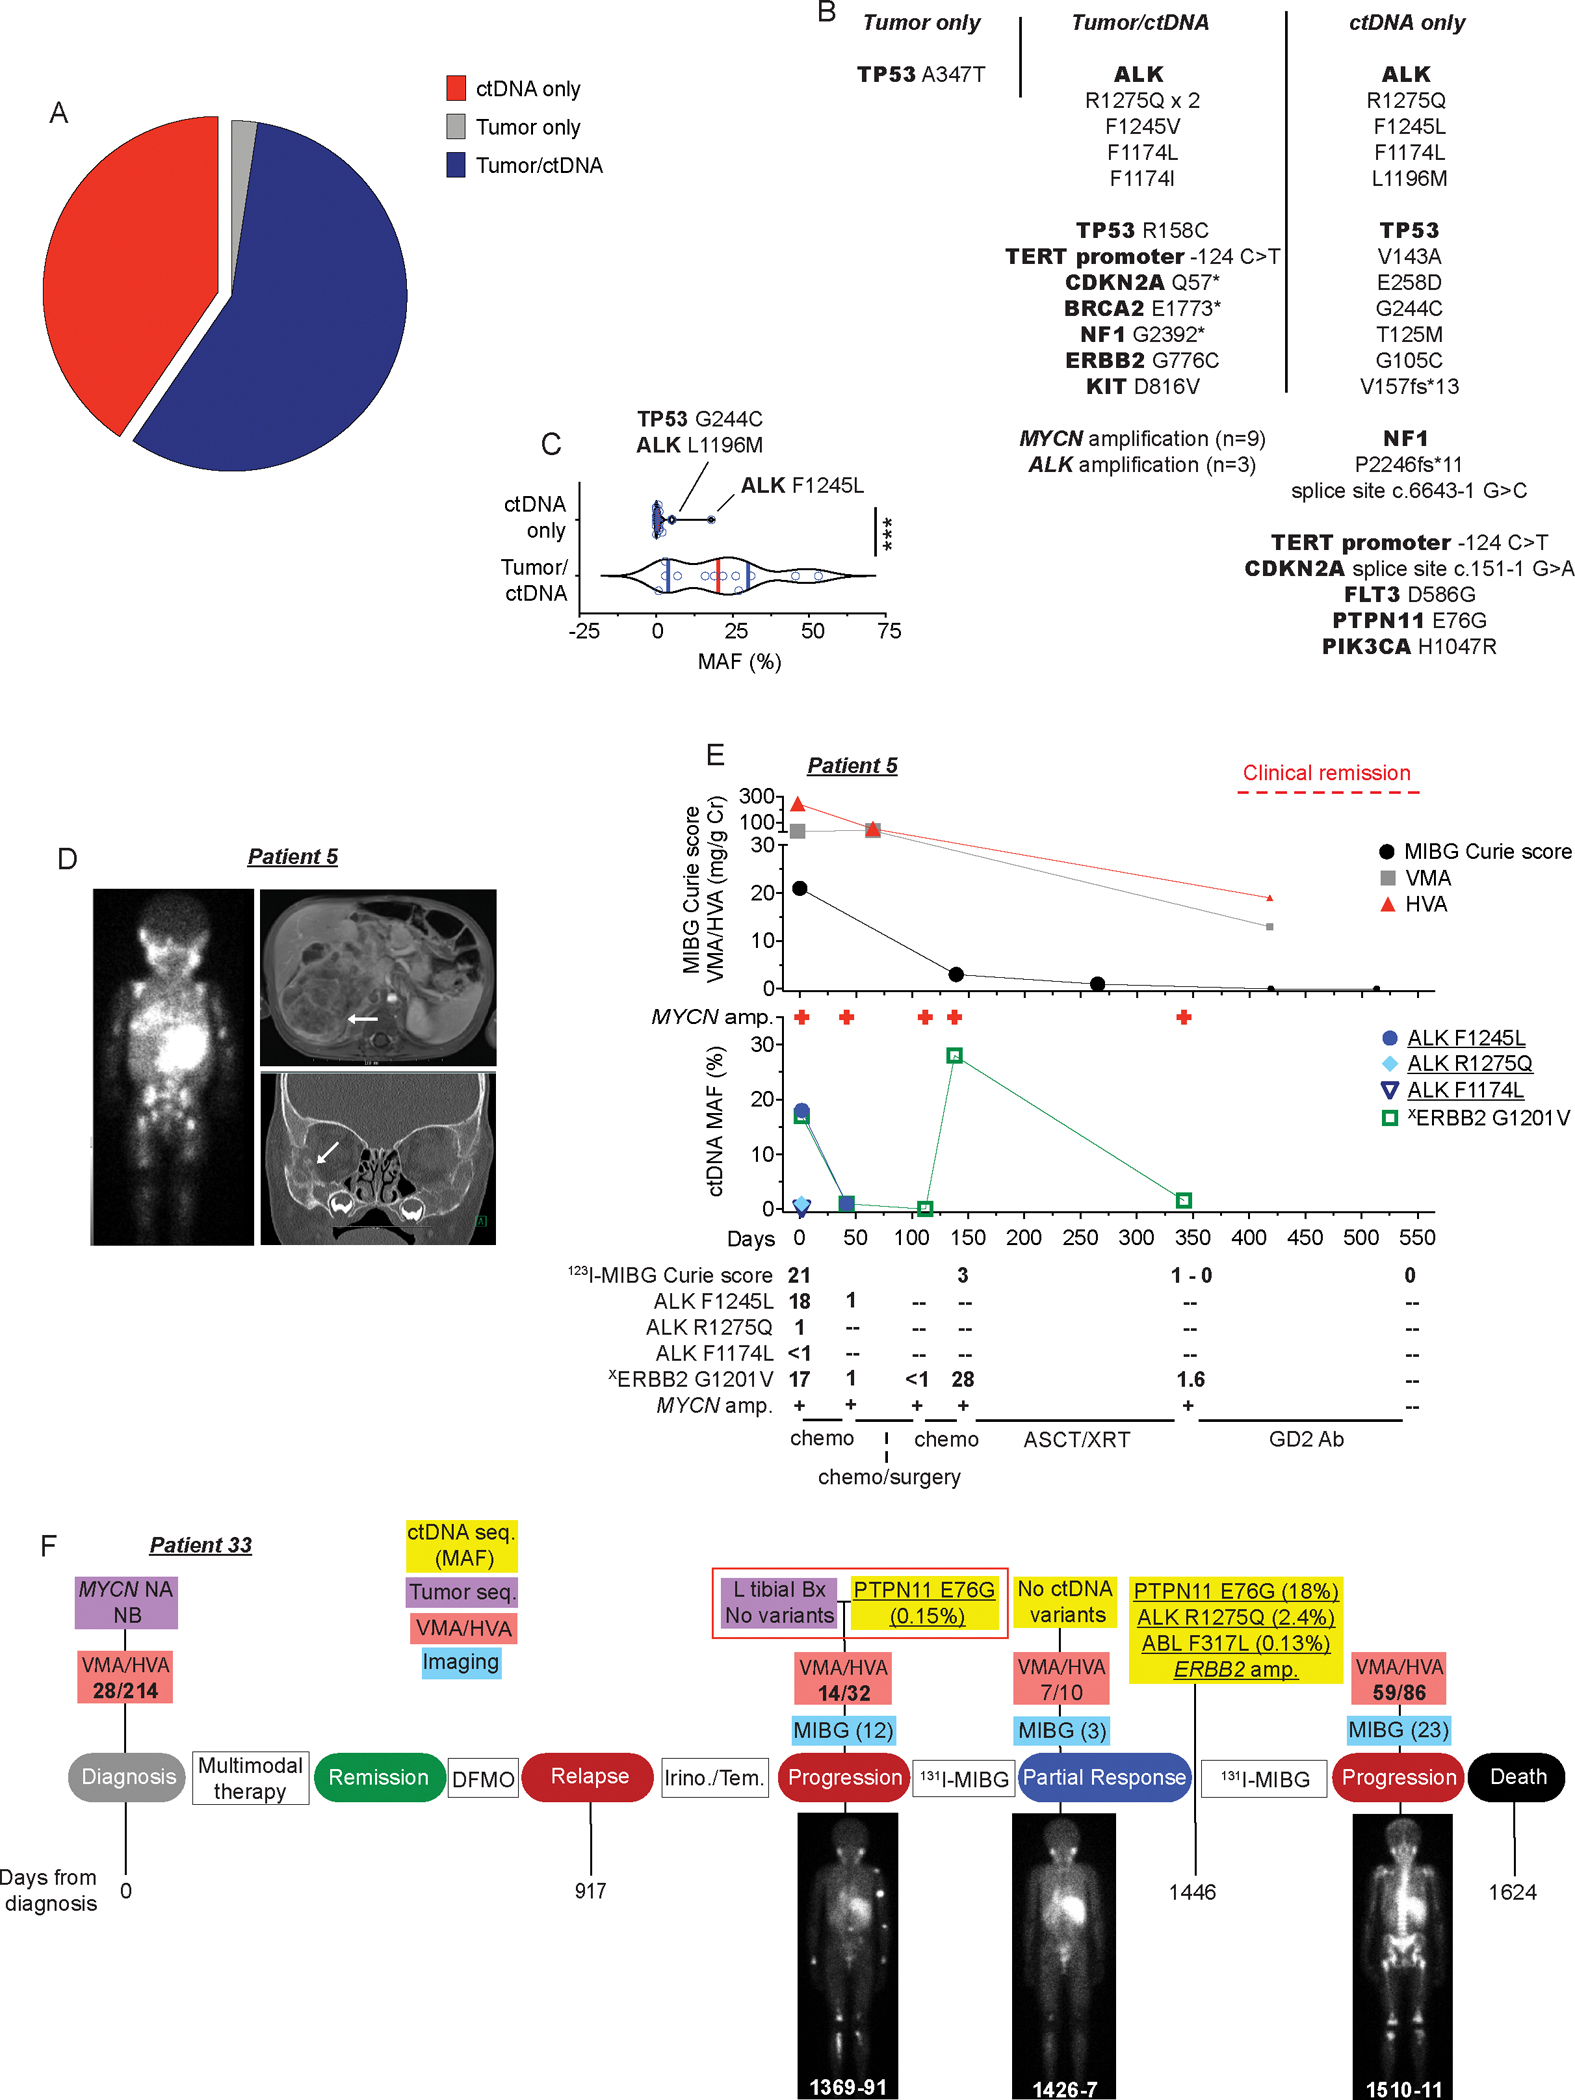
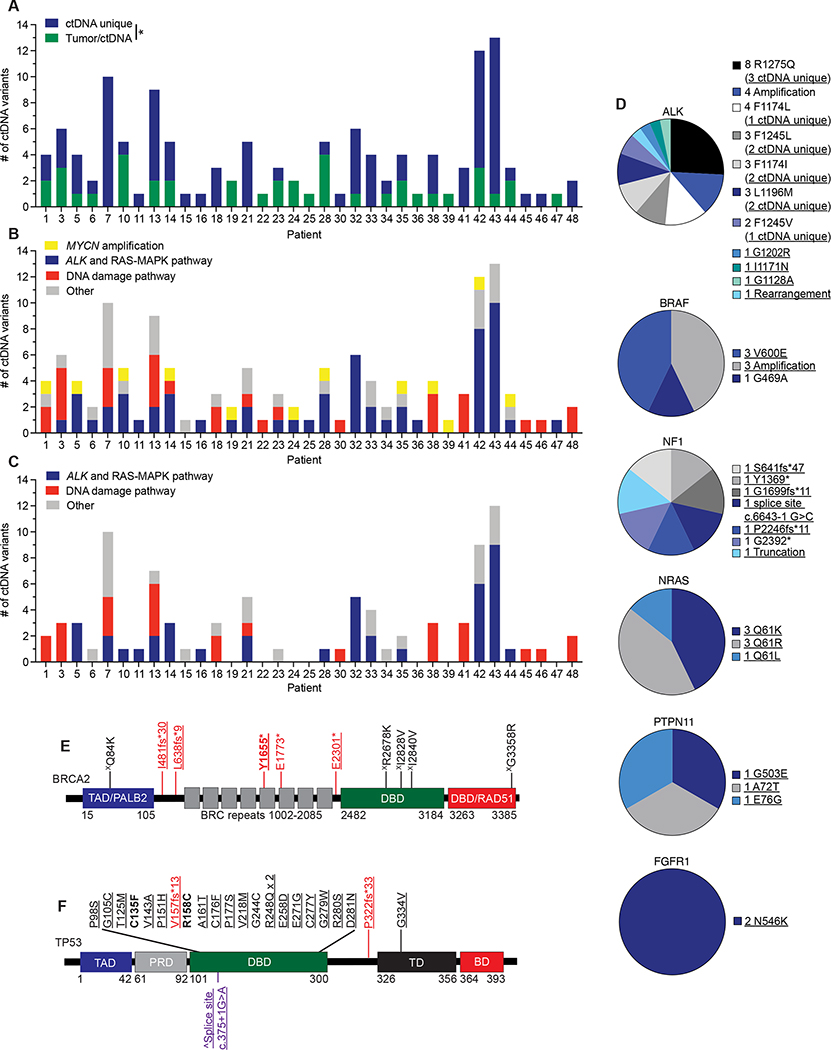
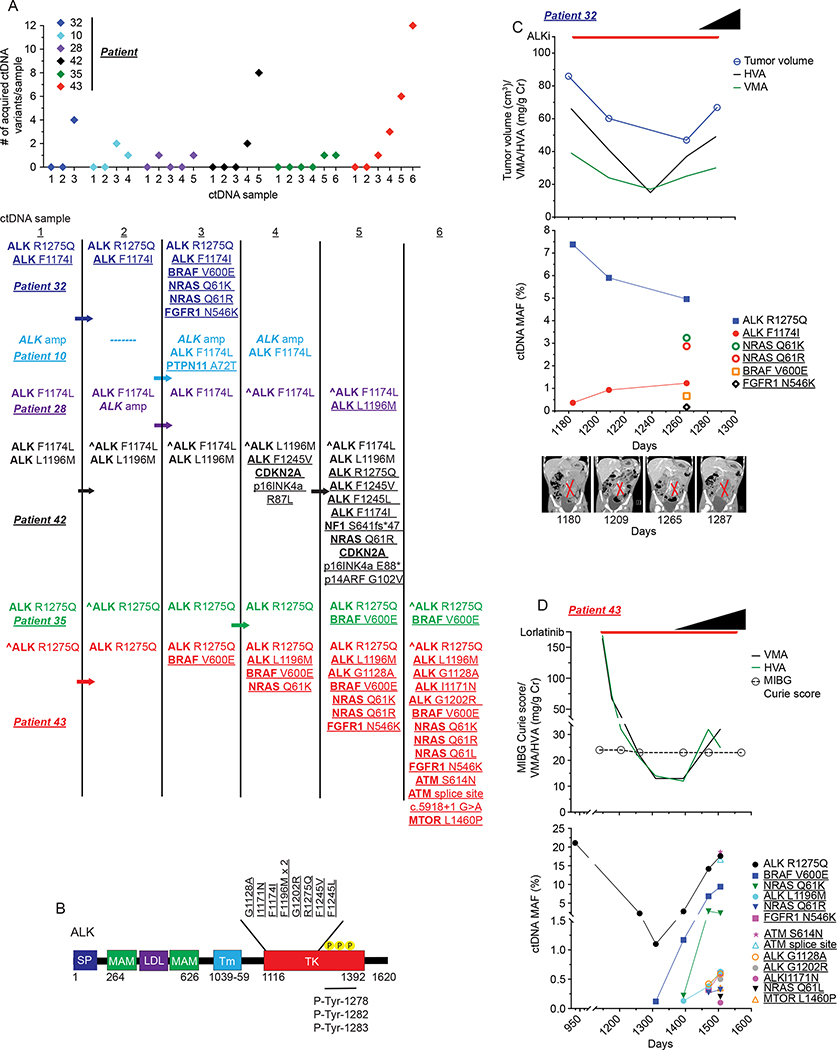
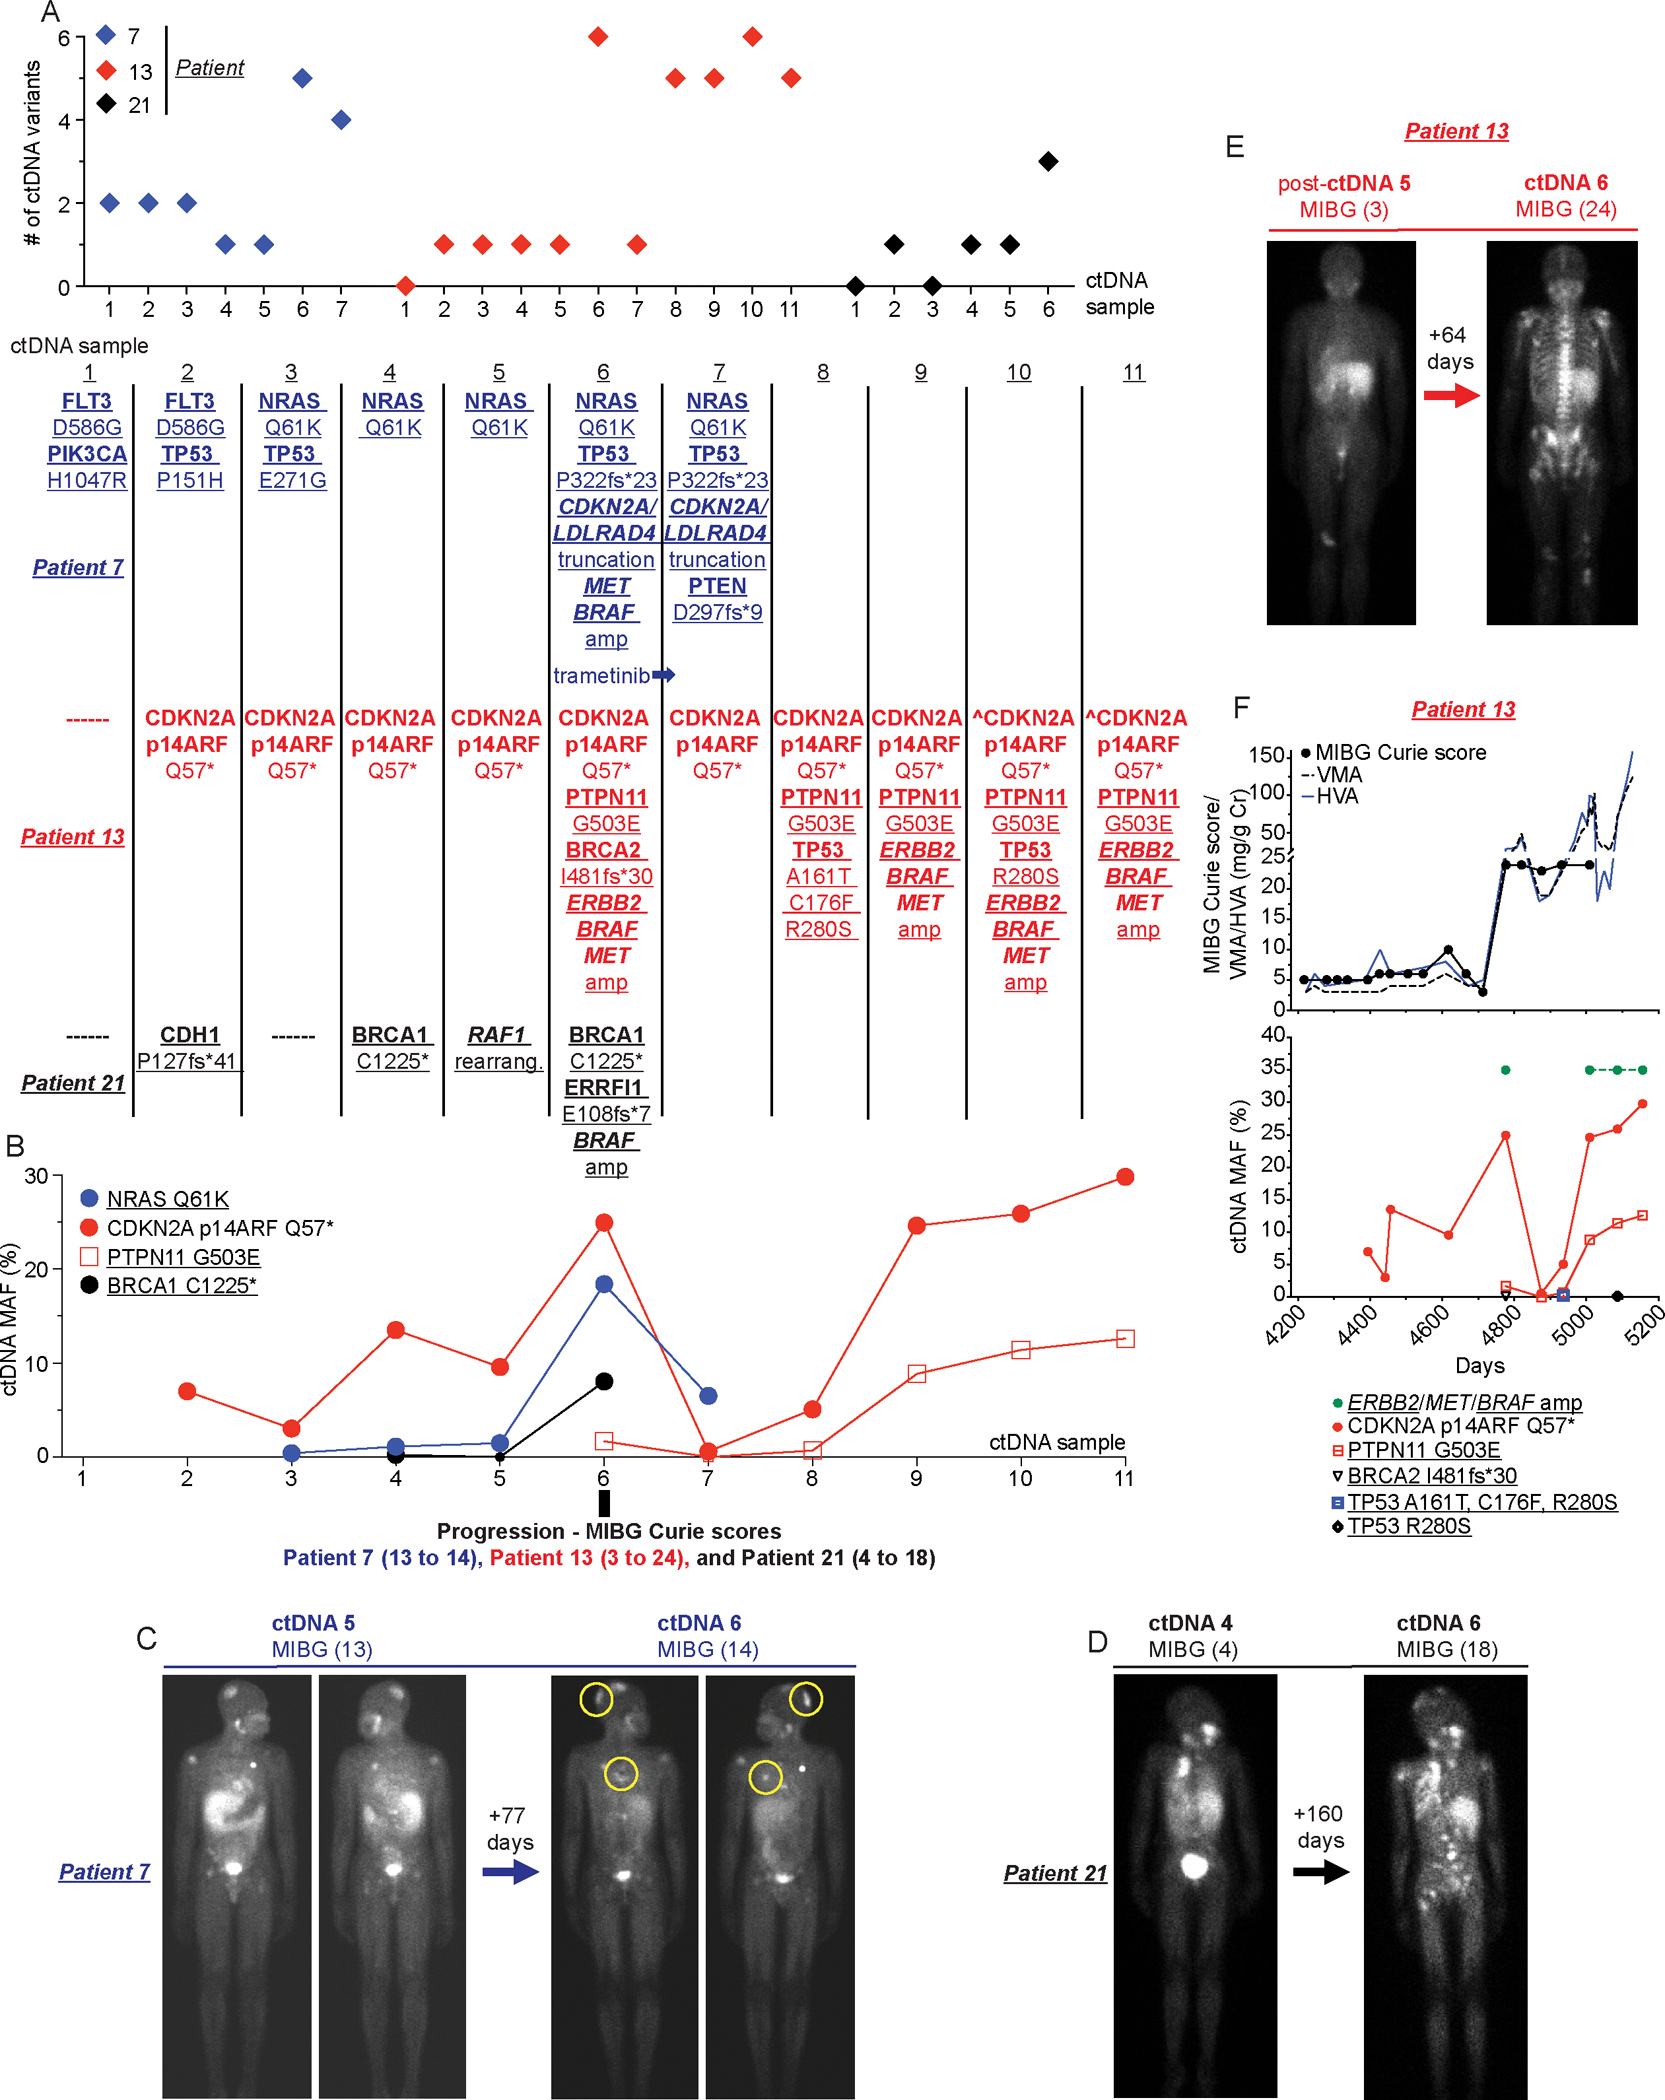
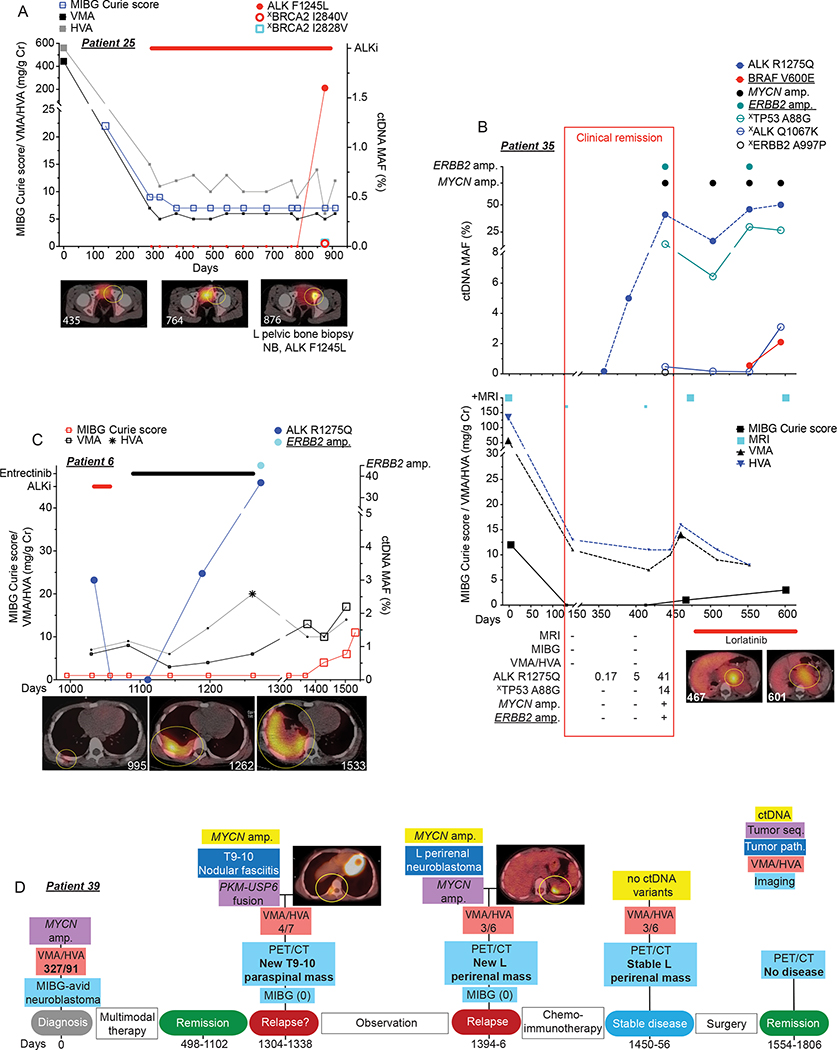
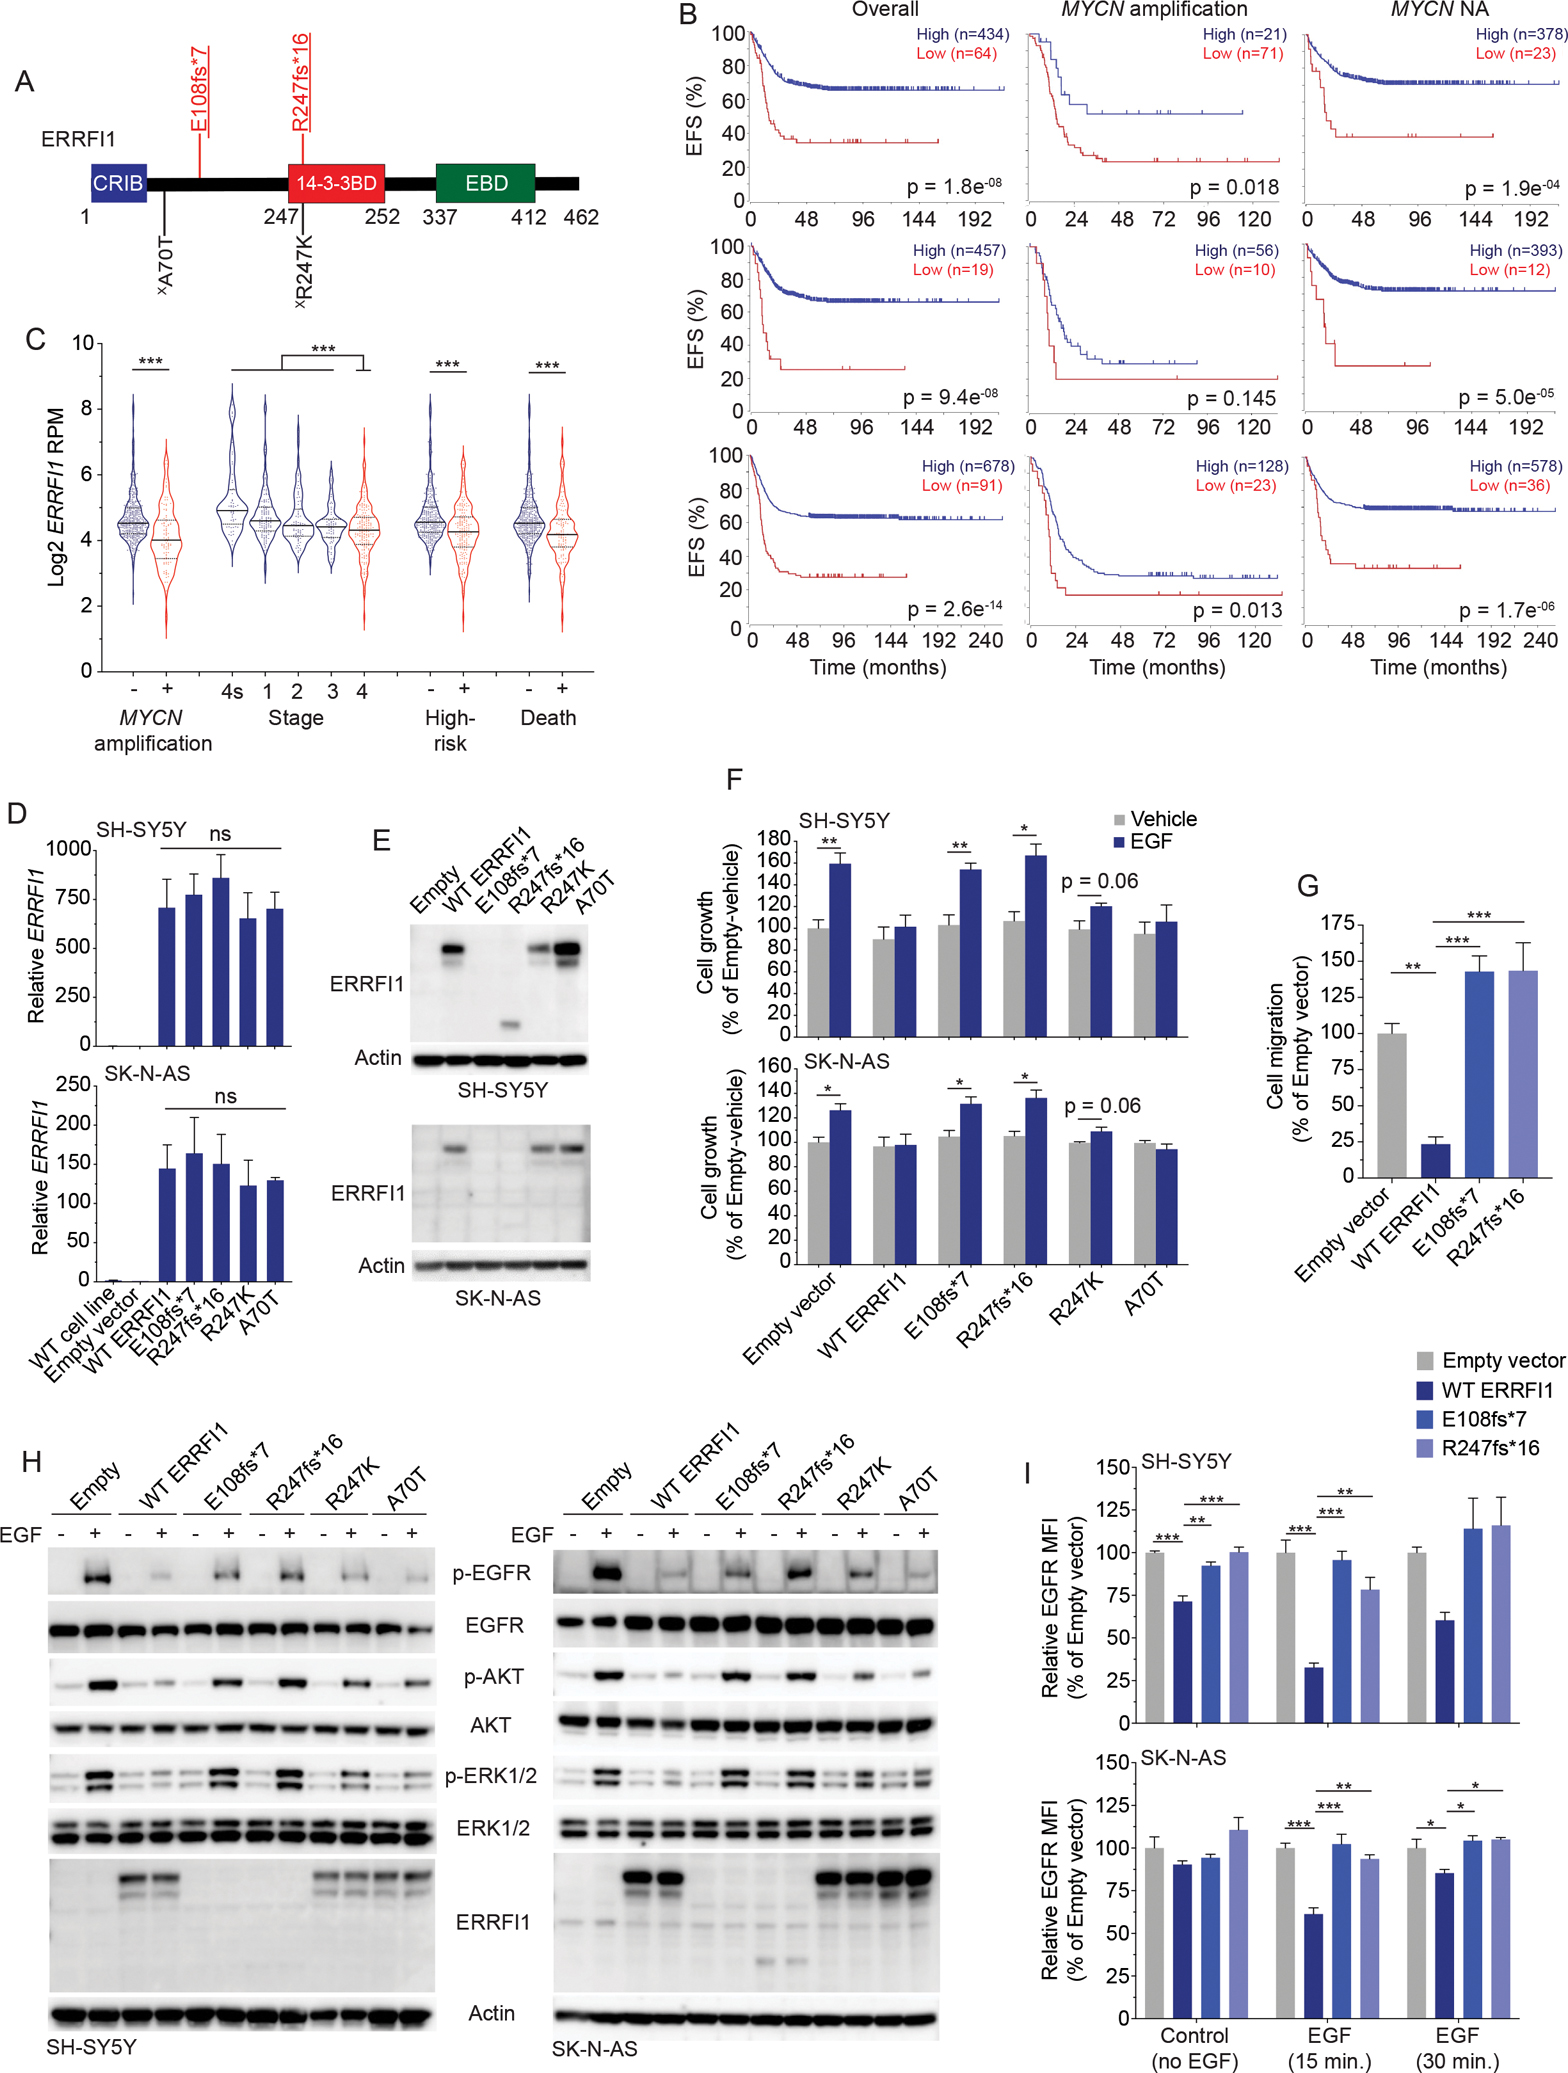
Neuroblastoma evolution, heterogeneity, and resistance remain inadequately defined, suggesting a role for circulating tumor DNA (ctDNA) sequencing. To define the utility of ctDNA profiling in neuroblastoma, 167 blood samples from 48 high-risk patients were evaluated for ctDNA using comprehensive genomic profiling. At least one pathogenic genomic alteration was identified in 56% of samples and 73% of evaluable patients, including clinically actionable ALK and RAS-MAPK pathway variants. Fifteen patients received ALK inhibition (ALKi), and ctDNA data revealed dynamic genomic evolution under ALKi therapeutic pressure. Serial ctDNA profiling detected disease evolution in 15 of 16 patients with a recurrently identified variant-in some cases confirming disease progression prior to standard surveillance methods. Finally, ctDNA-defined ERRFI1 loss-of-function variants were validated in neuroblastoma cellular models, with the mutant proteins exhibiting loss of wild-type ERRFI1's tumor-suppressive functions. Taken together, ctDNA is prevalent in children with high-risk neuroblastoma and should be followed throughout neuroblastoma treatment.

Significance: ctDNA is prevalent in children with neuroblastoma. Serial ctDNA profiling in patients with neuroblastoma improves the detection of potentially clinically actionable and functionally relevant variants in cancer driver genes and delineates dynamic tumor evolution and disease progression beyond that of standard tumor sequencing and clinical surveillance practices. See related commentary by Deubzer et al., p. 2727. This article is highlighted in the In This Issue feature, p. 2711.


Conflict of interest statement

Conflicts of Interest

M.F., X.L., M.M., M.T., and G.O. are current or past employees of Foundation Medicine. Y.P.M. is a consultant for Pfizer, Inc. No other authors declare any conflict of interest.

Figures

Figure 1.
Figure 1.. Circulating tumor DNA is prevalent in children with neuroblastoma.
(A) Schema of serial ctDNA profiling sample collection time points for high-risk neuroblastoma patients. Red arrows indicate general ctDNA collection points. (B) Summary of number of genetic variants identified per ctDNA sample for each patient. The mean ± SEM of ctDNA variants for each patient is shown with each individual ctDNA sample variant number indicated by a circle. The number of ctDNA samples per patient is indicated in parentheses on the y-axis. Red bars indicate patients with MYCN amplified tumors. Newly diagnosed neuroblastoma patients (*) and patients with progressive disease (#) are indicated, with the remaining patients having relapsed neuroblastoma. (C) Plot of ctDNA variants detected in patients with newly diagnosed neuroblastoma versus those with relapsed disease or disease progression. (D) Summary of the most altered genes detected in ctDNA. (E) Summary of the different genetic variants detected per commonly altered gene in ctDNA. (F) Plot of ctDNA detected genetic alteration MAFs. The median is indicated with a red line and the quartiles are indicated with blue lines on each violin plot in C and F. NB, neuroblastoma; TOPO, topotecan; CYCLO, cyclophosphamide; CDDP, cisplatin; VP-16, etoposide; VCR, vincristine; DOX, doxorubicin; XRT, radiation therapy; ASCT, autologous stem-cell transplant; 131I-MIBG, 131I-meta-iodobenzylguanidine, a targeted radiotherapeutic used to treat neuroblastoma. Non-focal amplifications are >20 MB in size with copy numbers ≤ 8 in genes that are recurrently amplified in cancer. Focal amplifications are <20 MB in size with copy numbers > 5 or >20 MB in size with copy numbers > 8 in genes that are recurrently amplified in cancer. **, p < 0.01.
Figure 2.
Figure 2.. ctDNA profiling enhances the detection of somatic variants at the time of neuroblastoma diagnosis or relapse.
(A) Plot showing concordance between tumor and ctDNA sequencing identified variants from temporally paired samples at the time of diagnosis or relapse (n=28 patients). (B) Description of gene variants summarized in A. (C) MAF of gene variants shown in B stratified by those identified in ctDNA only versus those found in both tumor and ctDNA. (D) 123I-MIBG scan (left), MRI (top right), and CT scan (bottom right) of 1-year-old male (patient 5) who presented with widely metastatic neuroblastoma. White areas of MIBG scan (left) and white arrows on MRI and CT images indicate areas of disease. (E) Serial ctDNA and disease evaluation correlation plot for patient 5 in D showing relationship between 123I-MIBG Curie scores, a semi-quantitative measure of tumor burden, urine catecholamine levels (VMA/HVA in mg/g Cr; top) and ctDNA profiling data (middle). Larger symbols in plot represent abnormal values. Numbers in bottom table denote MAFs and MIBG Curie scores. General treatment schema shown at bottom of plot. (F) Serial ctDNA and disease evaluation correlation timeline for patient 33. Images are representative 123I-MIBG images with Curie scores noted in parentheses. VMA/HVA quantification (mg/g Cr) is indicated (bolded values represent abnormal values) and days from neuroblastoma diagnosis is noted on the bottom of plot. Chemo, chemotherapy; ASCT, autologous stem-cell transplant; XRT, radiation therapy; NB, neuroblastoma; Seq., sequencing; NA, not-amplified; Bx, biopsy; GD2 Ab, GD2-targeting chimeric monoclonal antibody dinutuximab; DFMO, difluoromethylornithine, an irreversible inhibitor of ornithine decarboxylase (ODC) used in maintenance neuroblastoma therapy; Irino./Tem., irinotecan/temozolomide, a chemotherapeutic regimen used commonly for relapsed neuroblastoma therapy; 131I-MIBG, 131I-meta-iodobenzylguanidine, a targeted radiotherapeutic used to treat neuroblastoma. Underlined variants in E and F denote those unique to ctDNA and (X) denotes variant of unknown significance.***p < 0.0001.
Figure 3.
Figure 3.. ctDNA unique pathogenic variants in cancer driver genes are commonly identified in relapsed neuroblastoma patients.
(A) Plot of number of ctDNA unique versus ctDNA/tumor common variants for evaluable patients. (B) Plot of major categories of all ctDNA variants identified. (C) Plot of major categories of ctDNA unique variants identified. (D) Charts of ctDNA defined alterations in ALK and RAS-MAPK pathway genes. (E, F) ctDNA identified genetic variants in BRCA2 (E) and TP53 (F) transposed on their respective protein domains. Underlined variants denote those unique to ctDNA and (X) denotes variants of unknown significance. In E and F, bolded variants represent those suspected to be of germline origin; red, denotes putative loss-of-function (LOF) variants; purple, denotes variants in splice sites; black, denotes missense variants. (^) denotes splice site variant in TP53 that is predicted to lead to a truncated protein (57). Relative protein domains in E and F (not drawn to scale) (–60); TAD, transactivation domain; PALB2, PALB2 binding domain; DBD, DNA binding domain; RAD51, RAD51 binding domain; PRD, proline-rich domain; TD, tetramerization domain; BD; basic domain. *, p<0.05.
Figure 4.
Figure 4.. Serial ctDNA sequencing defines dynamic genomic evolution to ALK inhibition in neuroblastoma.
(A) Plot of number of acquired mutations in a subset of patients receiving ALKi therapy (top) with acquisition sequence of specific ctDNA defined variants (bottom). Arrows indicate general timing of ALKi initiation in ctDNA profiling sequence. Only ctDNA samples collected around ALKi therapy shown for clarity (e.g., patient 10 also had MYCN amplification and an ERBB2 G776C mutation identified in their ctDNA and patient 28 had MYCN amplification and a TERT promoter −146 C>T promoter variant identified in their ctDNA, with these variants identified prior and during ALKi). (B) Diagram of ALK protein structure with location of ALK variants acquired after initiation of ALKi therapy indicated. (C,D) Plot of patient 32 (C) and 43 (D) treatment courses showing correlation of clinical disease surveillance (top) and serial ctDNA profiling data (bottom) while receiving ALKi therapy. Black triangles indicate general timing of clinical progression including for patient 32 (C) hypertension from tumor mass effect and death and for patient 43 (D) severely increased pain and fatigue and increased skull bone metastases. Representative abdominal MRI images for patient 32 shown at bottom of C. In B, ALK protein domains (not drawn to scale); SP, signal peptide; MAM, meprin, A5 protein and receptor protein-tyrosine phosphatase mu domain; LDL, low-density lipoprotein receptor class A domain; Tm, transmembrane; TK, tyrosine kinase domain. Underlined variants denote those unique to ctDNA and (^) denotes ctDNA profiling done as part of clinical care.
Figure 5.
Figure 5.. ctDNA evolution correlates with disease progression in neuroblastoma patients.
(A) Plot of total number of ctDNA variants identified in serial samples collected from patients 7,13, and 21 (top) with evolution of specific ctDNA variants shown (bottom). (B) Plot of MAFs for recurrent ctDNA variants summarized in A. (C-E) Paired 123I-MIBG scans with associated Curie scores for patient 7 (C; new disease noted in yellow circles in right image), patient 21 (D), and patient 13 (E) at the time of rising ctDNA MAFs and increasing ctDNA complexity (ctDNA sample 6 in B as noted). (F) Serial ctDNA and disease evaluation correlation plot for patient 13 showing relationship between 123I-MIBG Curie scores and urine VMA/HVA levels (top) and ctDNA data (bottom). Underlined variants denote those unique to ctDNA and (^) denotes ctDNA profiling done as part of clinical care.
Figure 6.
Figure 6.. Serial sequencing of ctDNA from neuroblastoma patients can provide enhanced disease surveillance.
(A) Serial ctDNA and clinical disease evaluation correlation plot for patient 25 showing relationship between ctDNA data, 123I-MIBG Curie scores, and urine VMA/HVA levels (top) and representative axial 123I-MIBG images (bottom, 123I-MIBG scan day noted in bottom left). (B) Serial ctDNA and clinical disease evaluation correlation plot for patient 35 showing relationship between ctDNA data (top) and MRIs, 123I-MIBG Curie scores, urine VMA/HVA levels, and representative axial 123I-MIBG images at the indicated time points (bottom, 123I-MIBG scan day noted in bottom left of image). Clinical remission time frame denoted with red box with ctDNA MAFs and imaging summary during clinical remission noted in bottom table. (C) Serial ctDNA and clinical disease evaluation correlation plot for patient 6 showing relationship between ctDNA data, 123I-MIBG Curie scores, and urine VMA/HVA levels (top) and representative axial 123I-MIBG images at the indicated time points (bottom, 123I-MIBG scan day noted in bottom right of image). (D) Serial ctDNA and clinical disease evaluation timeline for patient 39 showing relationship between ctDNA and tumor sequencing data, PET/CT, 123I-MIBG Curie scores, and urine VMA/HVA levels with representative axial PET/CT images at the indicated time points. Large symbols in plots represent abnormal values and small symbols represent normal values. Amp, amplification; seq, sequencing. Chemoimmunotherapy, Irinotecan/temozolomide/GD2-targeting chimeric monoclonal antibody dinutuximab, a treatment regimen used commonly for relapsed neuroblastoma. Underlined variants denote those unique to ctDNA and (X) denotes variants of unknown significance.
Figure 7.
Figure 7.. ctDNA-identified ERRFI1 variants are pathogenic in neuroblastoma cells
(A) ctDNA-identified variants in ERRFI1 transposed on the ERRFI1 protein domains. (B) Neuroblastoma event-free survival (EFS) plots stratified by ERRFI1 expression for all patients (left), patients with MYCN amplified tumors (middle), and patients with MYCN non-amplified (NA) tumors (right) in 3 large neuroblastoma data sets, SEQC (n=498, top), Kocak (n=649; middle), and Cangelosi (n=786; bottom). EFS plots were generated in the Genomics Analysis and Visualization Platform (R2; https://hgserver1.amc.nl/cgi-bin/r2/main.cgi). (C) ERRFI1 expression in neuroblastoma tumors stratified by several clinical covariates (SEQC; n=498 tumors). (D, E) ERRFI1 expression in ERRFI1 isogenic SH-SY5Y and SK-N-AS neuroblastoma cell lines by RT-PCR (D) and western blot (E). (F) Relative cell growth plots of ERRFI1 isogenic SH-SY5Y (top) and SK-N-AS (bottom) neuroblastoma cell lines after EGF stimulation (50 ng/mL). (G) Relative EGF-induced cell migration of ERRFI1 isogenic SK-N-AS neuroblastoma cells. (H) Western blot of ERRFI1 isogenic SH-SY5Y (left) and SK-N-AS (right) neuroblastoma cell lines after EGF stimulation (50 ng/mL). (I) Relative EGFR cell surface levels of ERRFI1 isogenic SH-SY5Y (top) and SK-N-AS (bottom) neuroblastoma cell lines with and without EGF stimulation (50 ng/mL). Underlined variants denote those unique to ctDNA and (X) denotes variants of unknown significance. In A, red denotes putative LOF variant and black denotes missense VUS. Relative protein domains in A (not drawn to scale); CRIB, Cdc42/Rac interactive binding domain; 14–3-3BD, 14–3-3 binding domain, EBD, EGFR or ErbB binding domain. WT, wild type. *, p<0.05; **, p<0.01; ***, p<0.001; ns, not significant.

Comment in

References

    1. Matthay KK, Maris JM, Schleiermacher G, Nakagawara A, Mackall CL, Diller L, et al. Neuroblastoma. Nat Rev Dis Primers 2016;2:16078 doi 10.1038/nrdp.2016.78. - DOI - PubMed
    1. Maris JM. Recent advances in neuroblastoma. N Engl J Med 2010;362(23):2202–11 doi 362/23/2202 [pii] 10.1056/NEJMra0804577. - DOI - PMC - PubMed
    1. Cabel L, Proudhon C, Romano E, Girard N, Lantz O, Stern MH, et al. Clinical potential of circulating tumour DNA in patients receiving anticancer immunotherapy. Nat Rev Clin Oncol 2018;15(10):639–50 doi 10.1038/s41571-018-0074-3. - DOI - PubMed
    1. Dawson SJ, Tsui DW, Murtaza M, Biggs H, Rueda OM, Chin SF, et al. Analysis of circulating tumor DNA to monitor metastatic breast cancer. N Engl J Med 2013;368(13):1199–209 doi 10.1056/NEJMoa1213261. - DOI - PubMed
    1. Parikh AR, Leshchiner I, Elagina L, Goyal L, Levovitz C, Siravegna G, et al. Liquid versus tissue biopsy for detecting acquired resistance and tumor heterogeneity in gastrointestinal cancers. Nat Med 2019;25(9):1415–21 doi 10.1038/s41591-019-0561-9. - DOI - PMC - PubMed

Publication types

Substances