. 2022 Dec 2;12(12):2930-2953.
doi: 10.1158/2159-8290.CD-21-0865.

Loss of Epigenetic Regulation Disrupts Lineage Integrity, Induces Aberrant Alveogenesis, and Promotes Breast Cancer

Affiliations

Loss of Epigenetic Regulation Disrupts Lineage Integrity, Induces Aberrant Alveogenesis, and Promotes Breast Cancer

Ellen Langille et al. Cancer Discov. .

Abstract

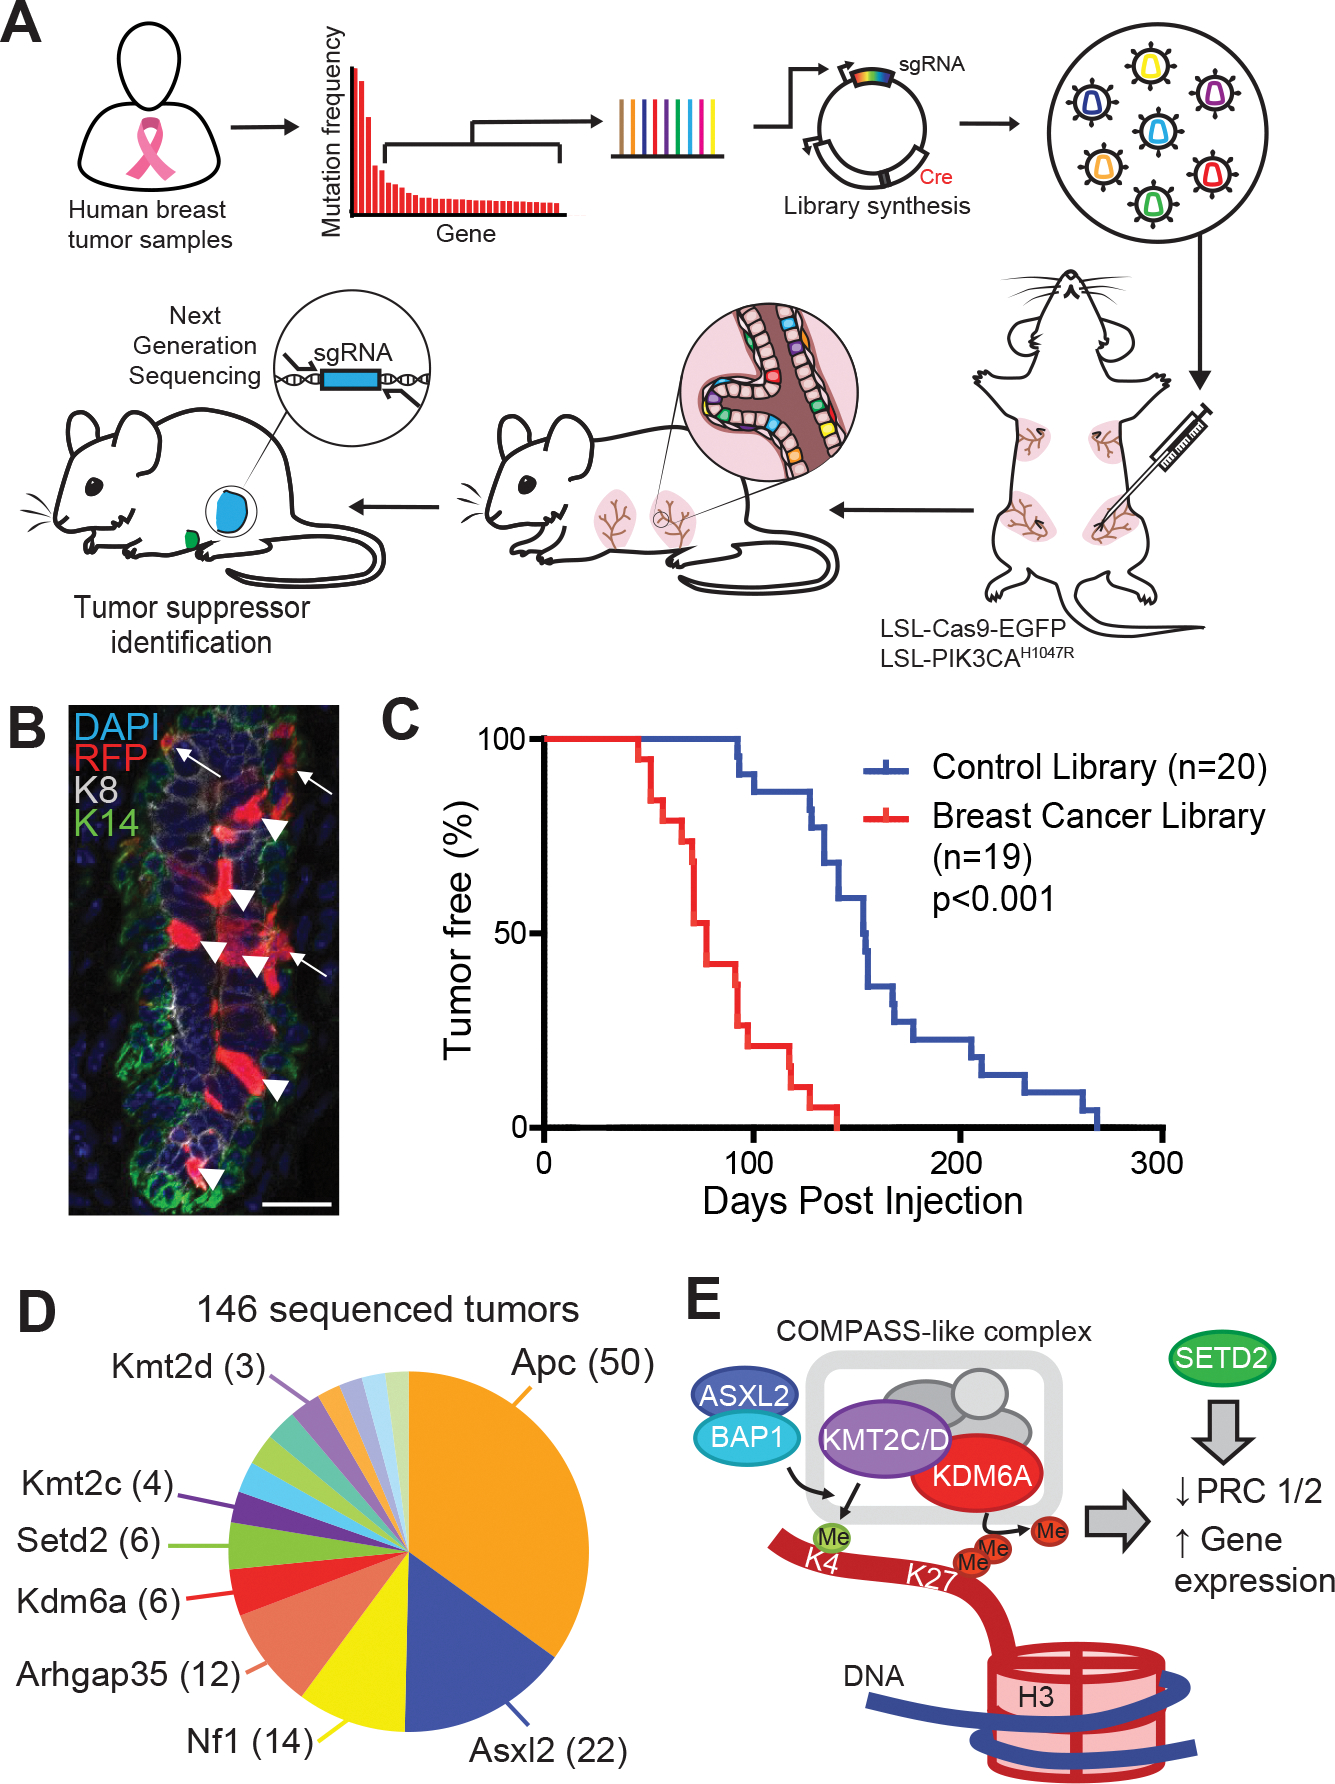
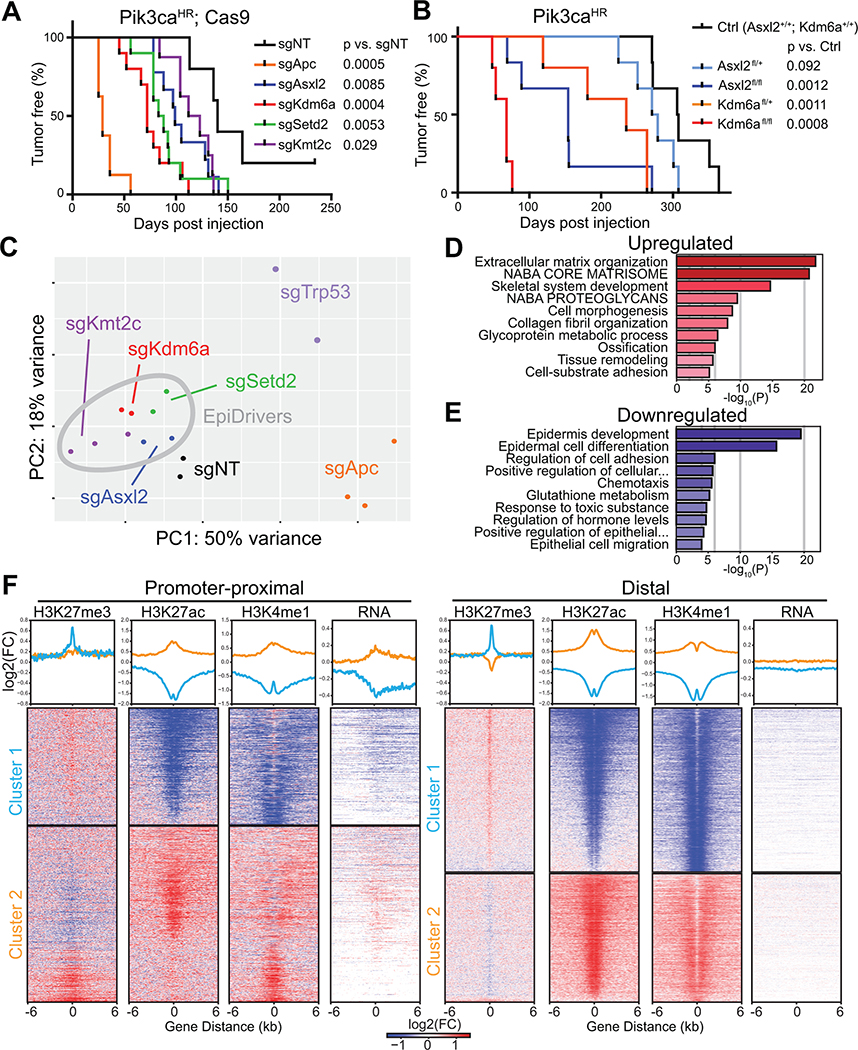
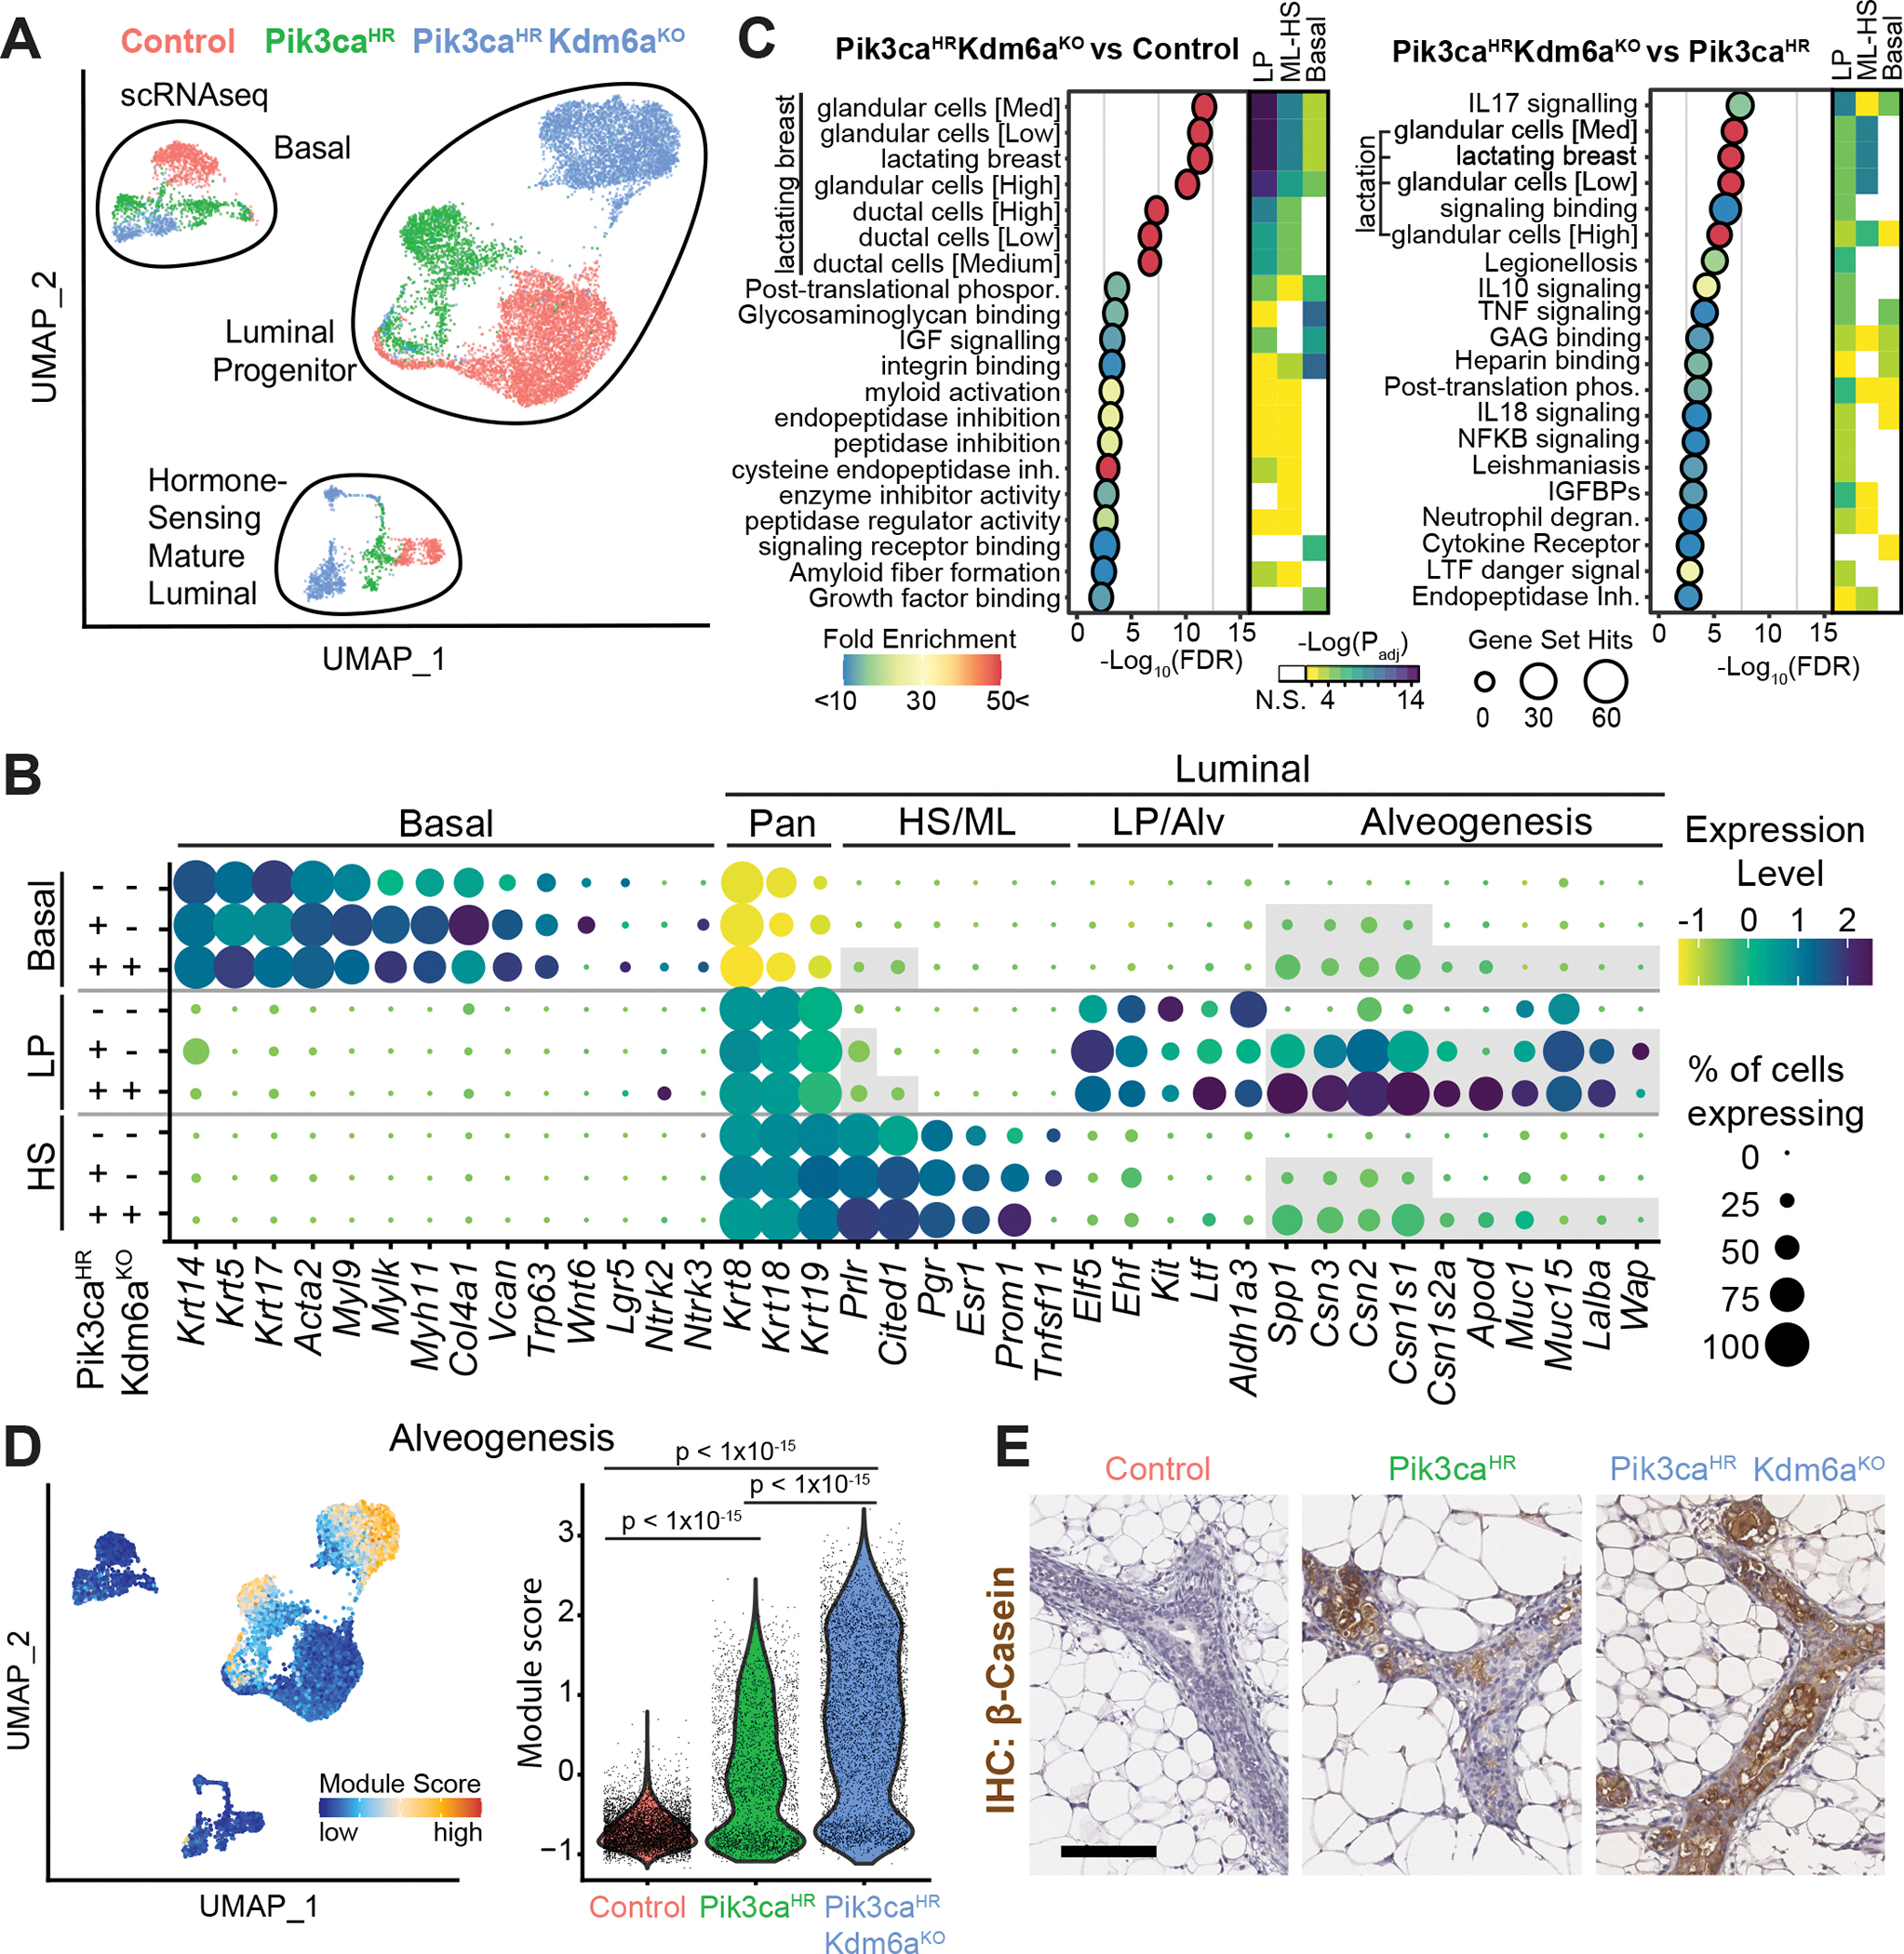
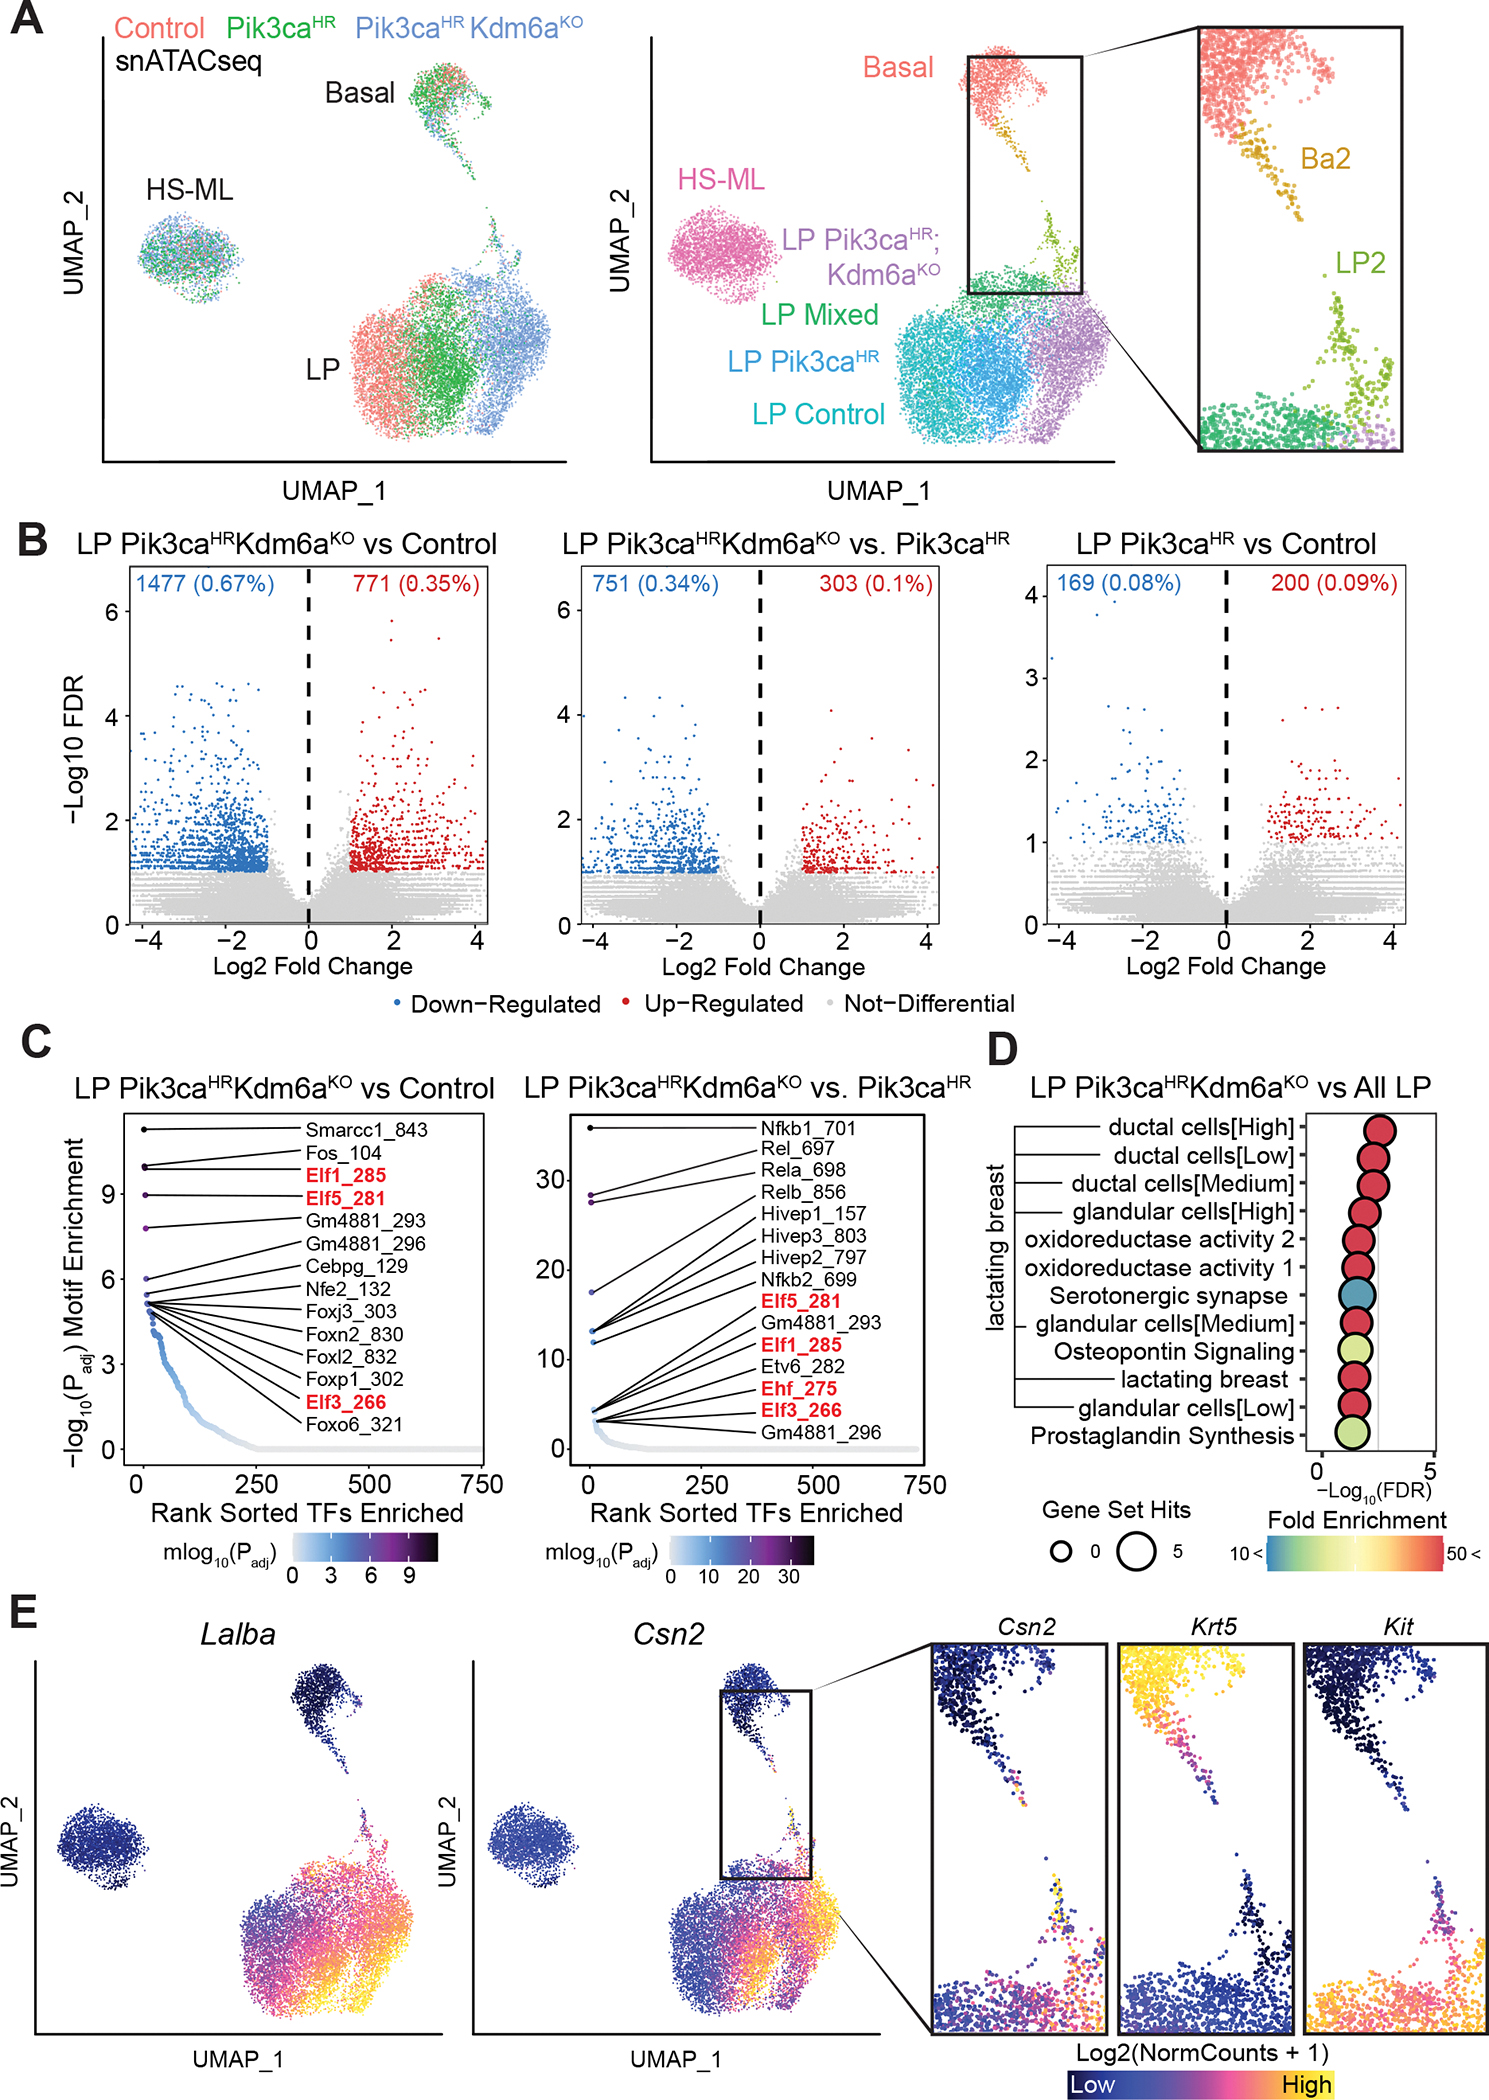
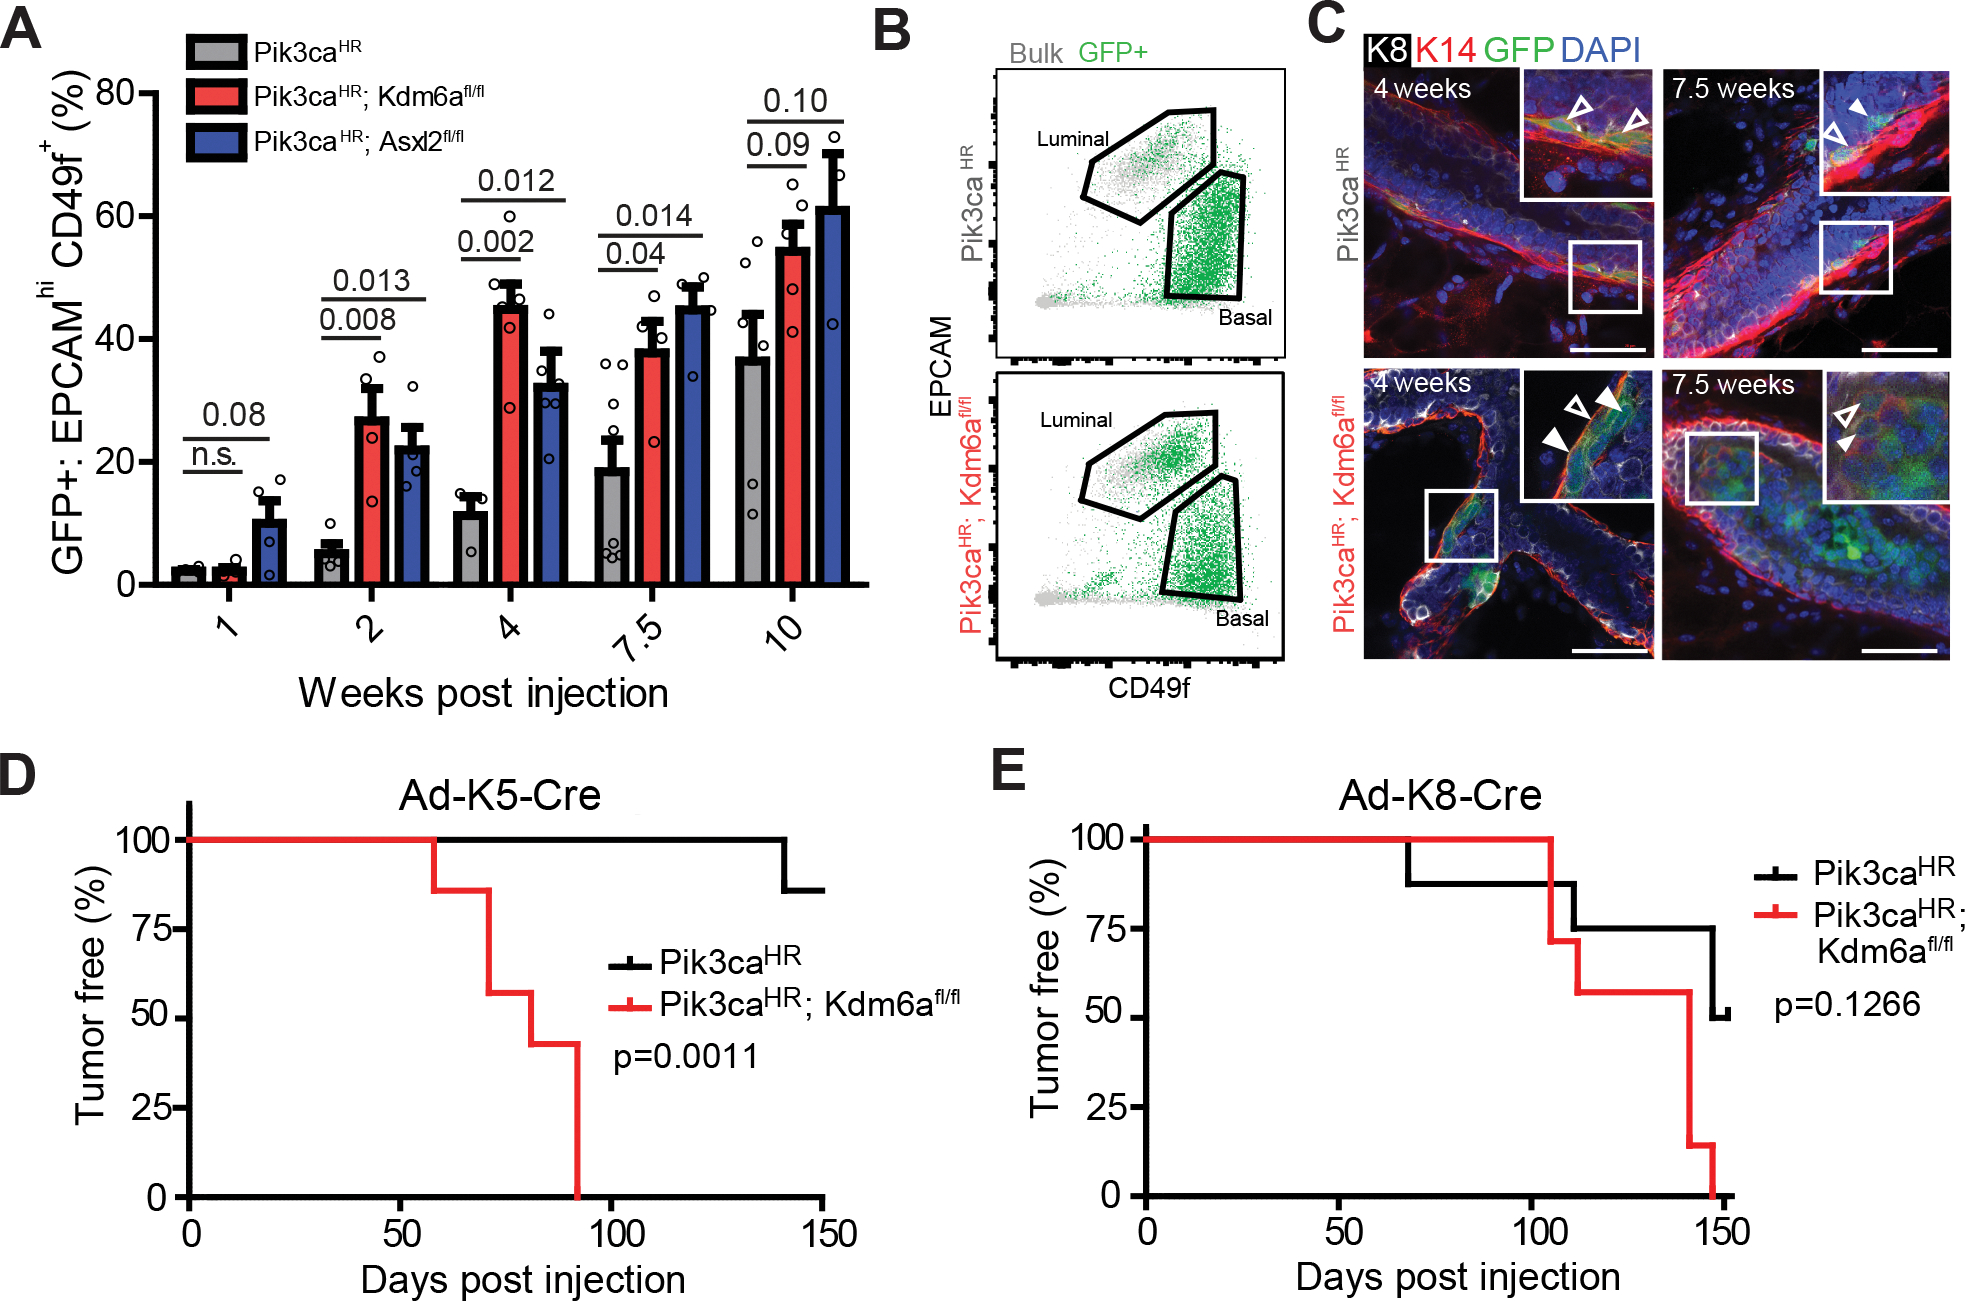
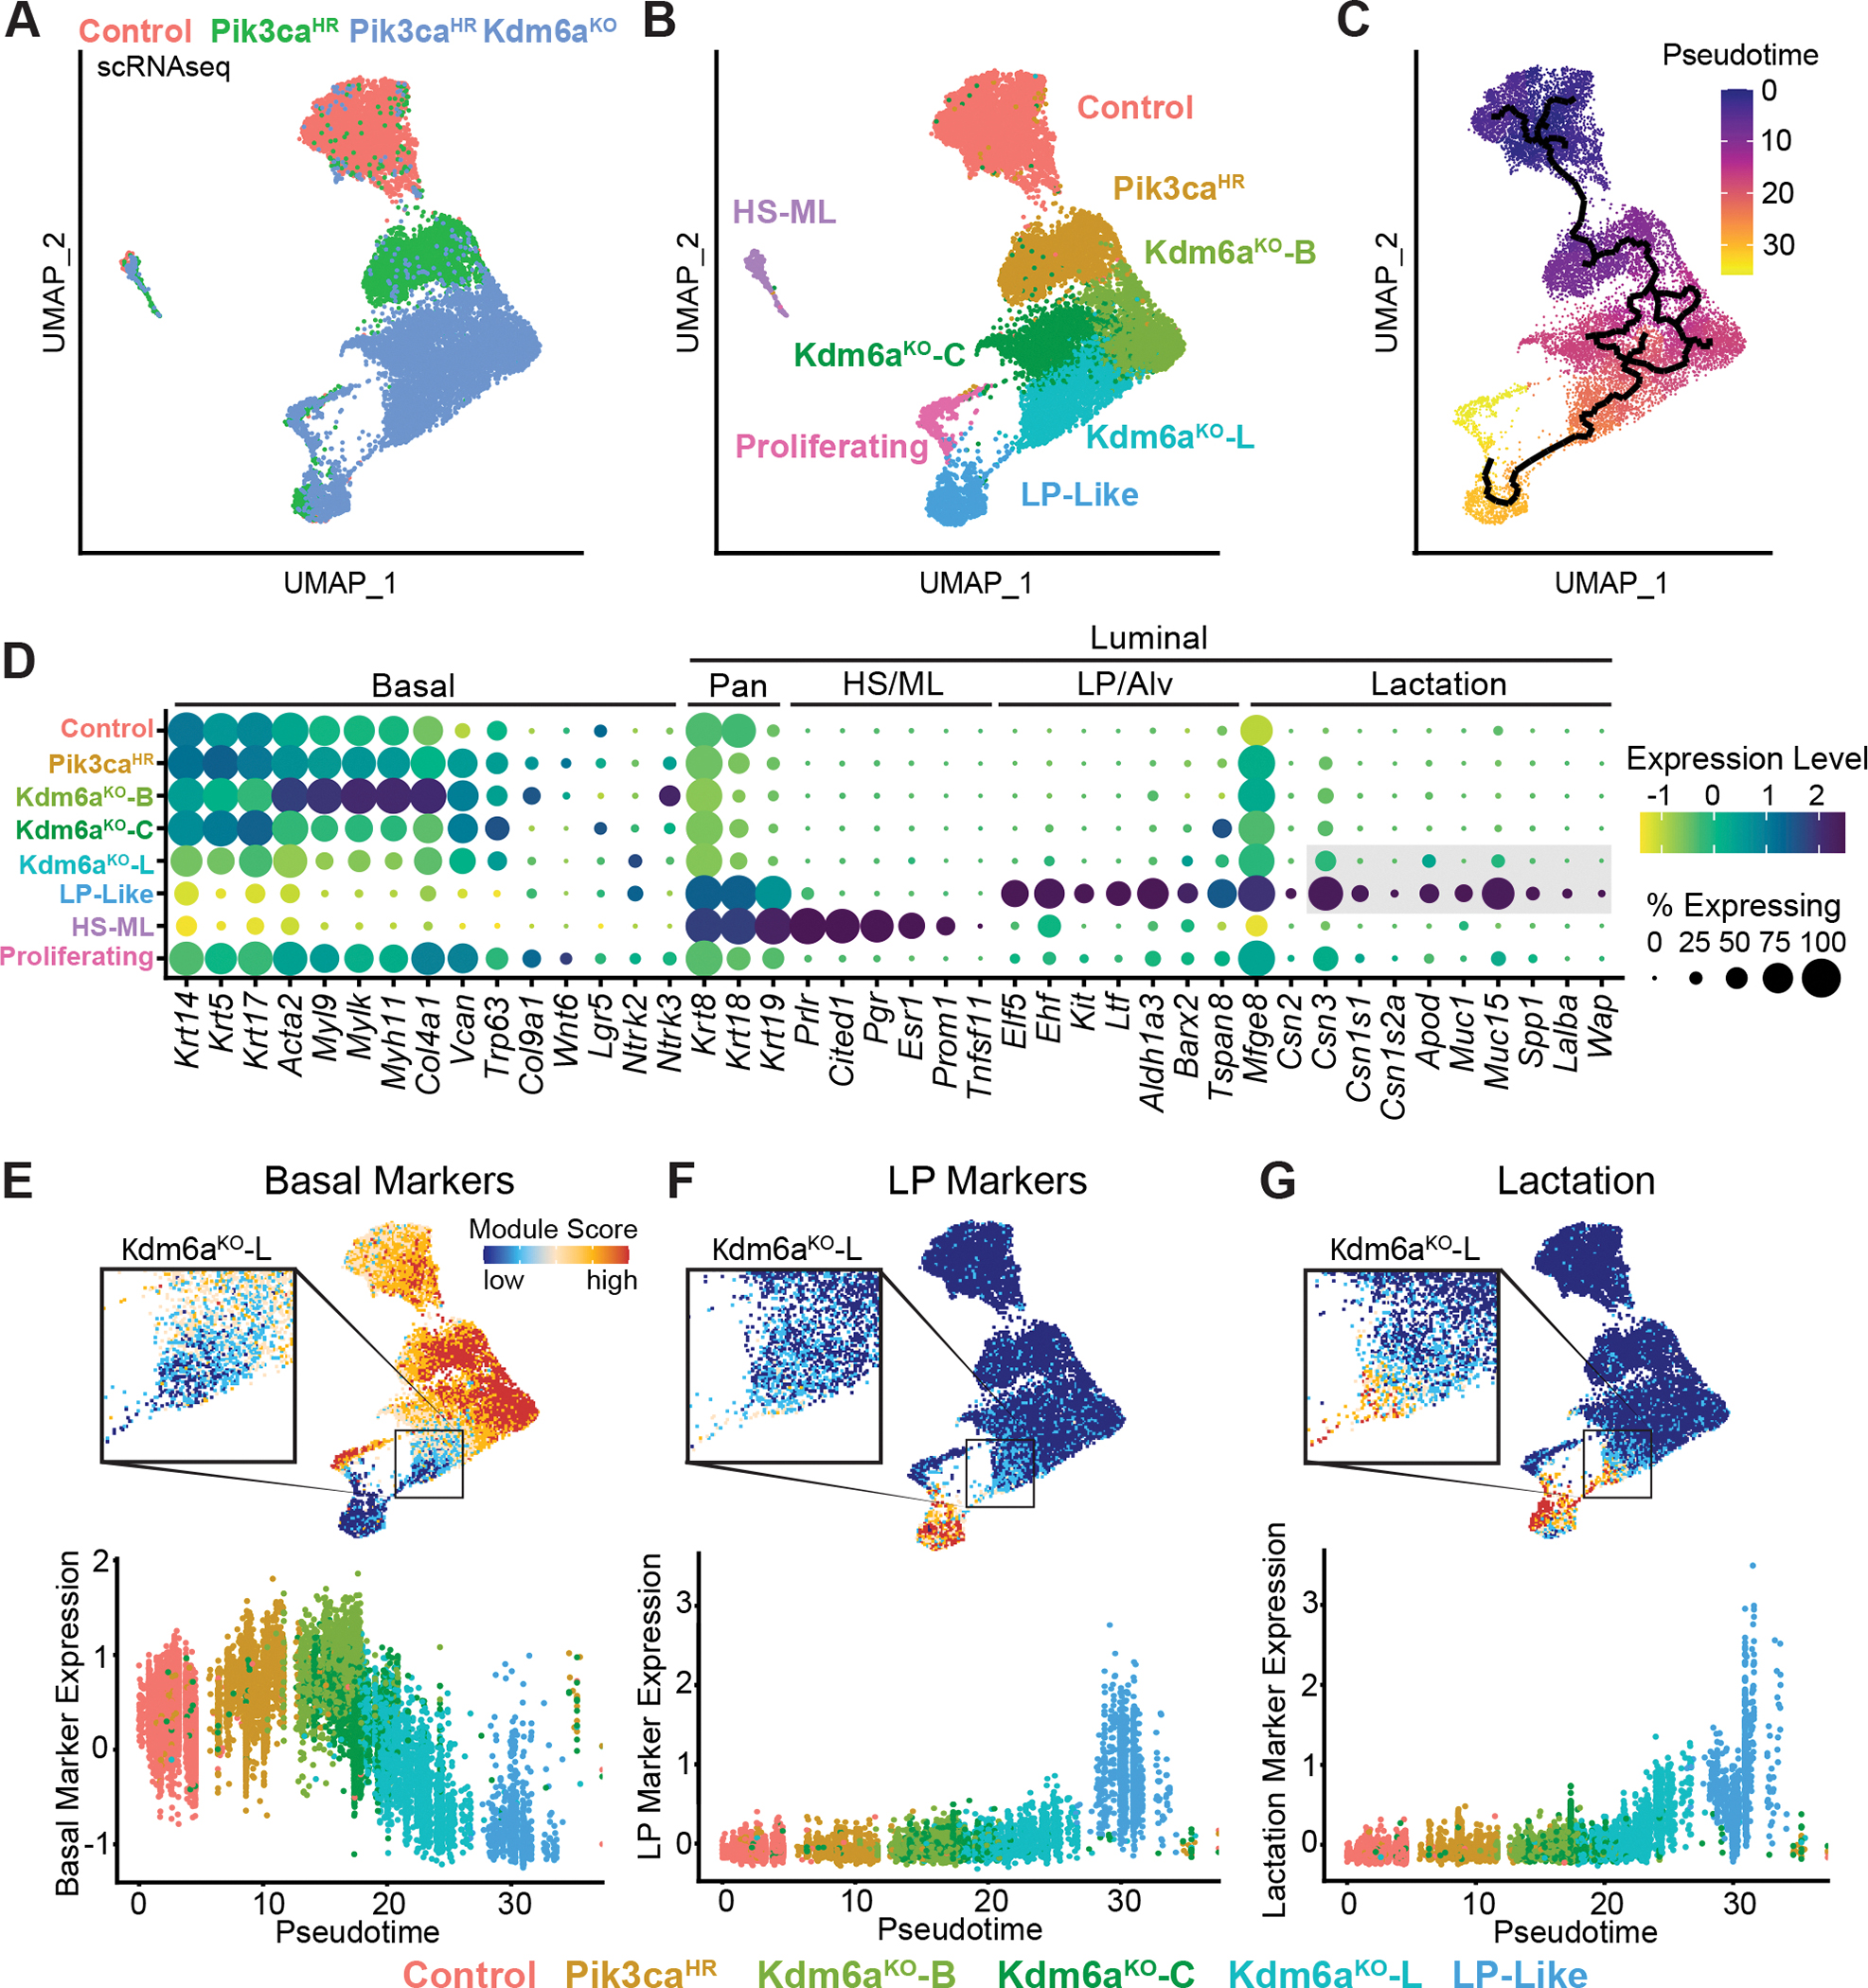
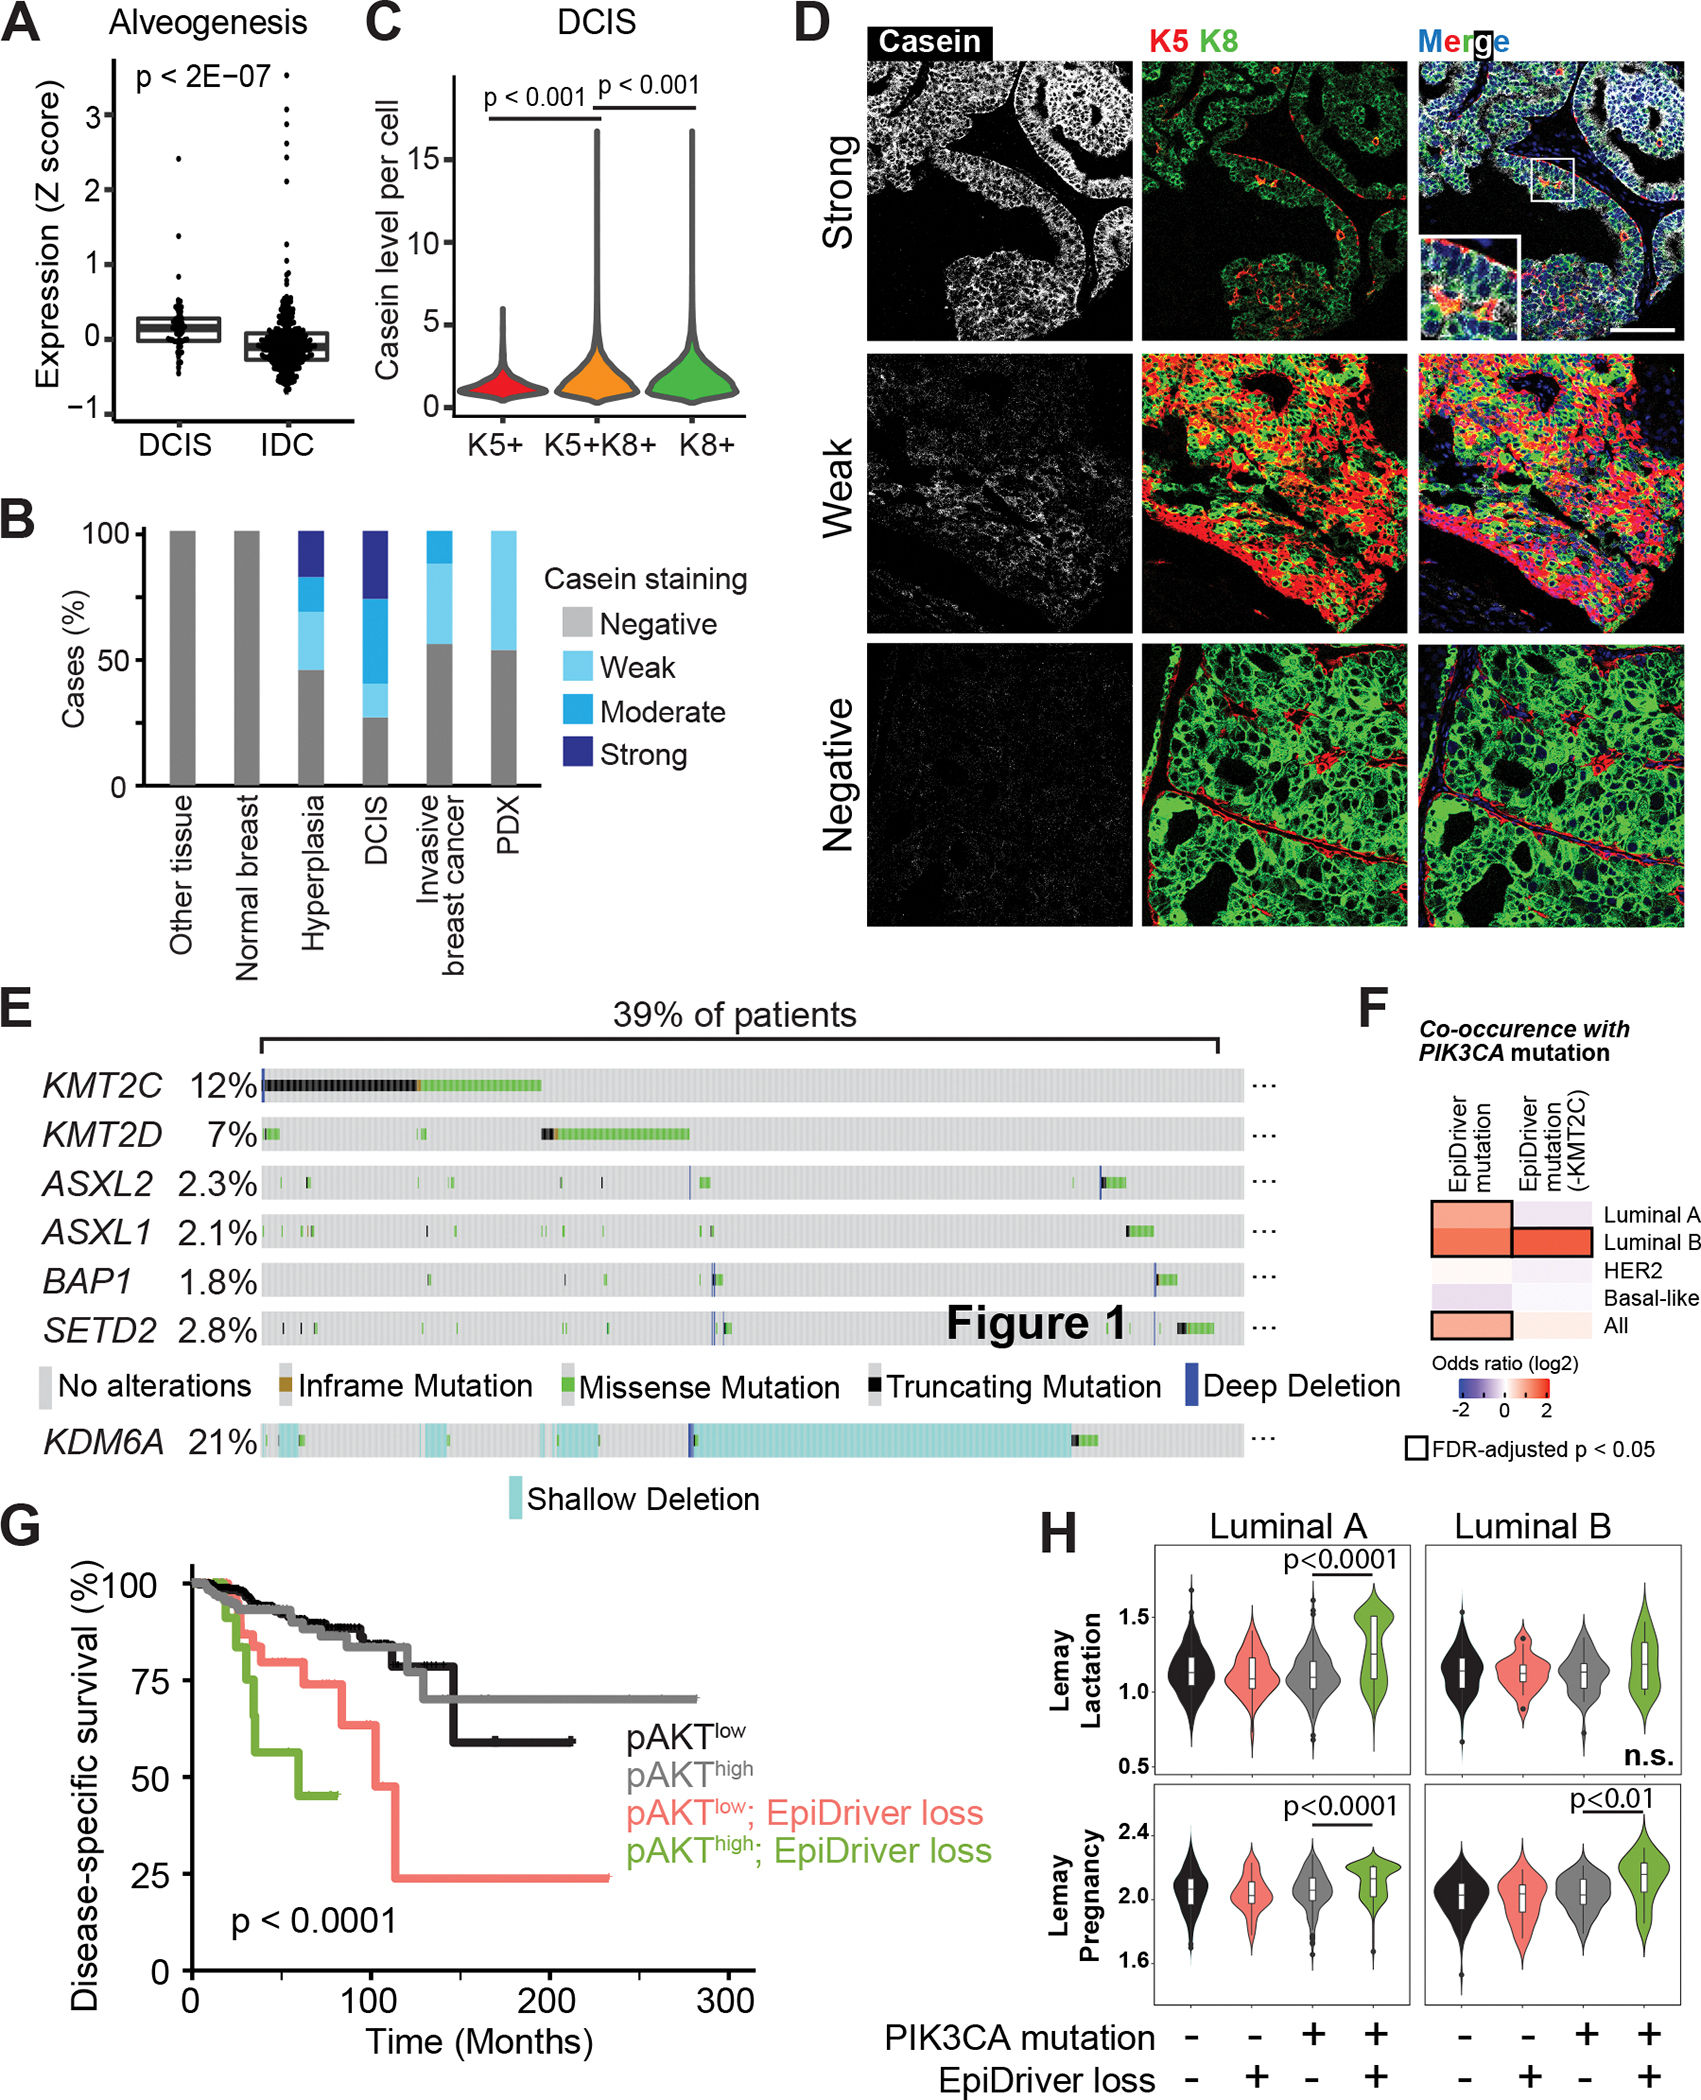
Systematically investigating the scores of genes mutated in cancer and discerning disease drivers from inconsequential bystanders is a prerequisite for precision medicine but remains challenging. Here, we developed a somatic CRISPR/Cas9 mutagenesis screen to study 215 recurrent "long-tail" breast cancer genes, which revealed epigenetic regulation as a major tumor-suppressive mechanism. We report that components of the BAP1 and COMPASS-like complexes, including KMT2C/D, KDM6A, BAP1, and ASXL1/2 ("EpiDrivers"), cooperate with PIK3CAH1047R to transform mouse and human breast epithelial cells. Mechanistically, we find that activation of PIK3CAH1047R and concomitant EpiDriver loss triggered an alveolar-like lineage conversion of basal mammary epithelial cells and accelerated formation of luminal-like tumors, suggesting a basal origin for luminal tumors. EpiDriver mutations are found in ∼39% of human breast cancers, and ∼50% of ductal carcinoma in situ express casein, suggesting that lineage infidelity and alveogenic mimicry may significantly contribute to early steps of breast cancer etiology.

Significance: Infrequently mutated genes comprise most of the mutational burden in breast tumors but are poorly understood. In vivo CRISPR screening identified functional tumor suppressors that converged on epigenetic regulation. Loss of epigenetic regulators accelerated tumorigenesis and revealed lineage infidelity and aberrant expression of alveogenesis genes as potential early events in tumorigenesis. This article is highlighted in the In This Issue feature, p. 2711.


Conflict of interest statement

The authors declare no potential conflicts of interest.

Figures

Fig. 1.
Fig. 1.. In vivo CRISPR screen reveals novel epigenetic breast cancer tumors suppressors ‘EpiDrivers’.
A, Experimental design for in vivo CRISPR screen, showing gene selection from long-tail mutations, intraductal injection of lentiviral libraries and tumor sequencing. B, Mammary epithelium transduced with lentiviral RFP. Arrows denote basal cells and arrow heads denote luminal cells. Scale bar = 25μm. C, Tumor-free survival of Pik3caH1047R;Cas9 mice transduced with a sgRNA library targeting putative breast cancer genes or a control sgRNA library. D, Pie chart showing putative tumor suppressor genes with enriched sgRNAs in tumor DNA (number of tumors are denoted in brackets). E, Schematic of COMPASS-like and ASXL/BAP1 complexes on epigenetic control of gene expression.
Fig. 2.
Fig. 2.. Validation and transcriptomic profiling of EpiDriver tumors.
A, Tumor-free survival of Pik3caH1047R;Cas9 mice injected with CRISPR lentivirus targeting the indicated gene or non-targeting control sgRNA (sgNT). Two independent sgRNAs/gene were used and data was combined (see Supplementary Fig. S2d for single sgRNA data). B, Tumor-free survival of Pik3caH1047R mice with conditional knockout of Asxl2 or Kdm6a. C, PC plot of all profiled tumor transcriptomes. D and E, METASCAPE analysis showing enriched (D) and depleted (E) pathways in common de-regulated genes in EpiDriver-KO tumors compared to control tumors. (F) K-means clustering of DE ChIP peak regions based on differential signal for H3K27Ac H3K27me3 and H3K4me1 between WT and sgKdm6a cells. Peaks were stratified as promoter proximal or distal based on a minimal distance of >= 2.5kb to an annotated TSS (see Methods).
Fig. 3.
Fig. 3.. Single-cell transcriptional profiling reveals alveogenic mimicry.
A, UMAP plot showing mammary epithelial cells from control, Pik3caH1047R and Pik3caH1047R;Kdm6afl/fl mutant mice 2 weeks after Ad-Cre injection. B, Dot Blot showing differentially expressed marker genes within the different epithelial lineages stratified by genotypes. C, Pathways differentially enriched in Pik3caH1047R;Kdm6afl/fl versus control and Pik3caH1047R;Kdm6afl/fl versus Pik3caH1047R mammary epithelial LP cells identified using g:Profiler (p <0.05 with Benjamini-Hochberg FDR correction, > 10-fold enrichment). The top 20 enriched pathways are shown. Heat- map depicts how these pathways are altered in the major 3 epithelial lineages. D, UMAP and violin blots showing alveogenesis signature. E, Immunohistochemistry of mammary glands 2 weeks post injection stained with anti-β-Casein. Scale bar is 100 μm.
Fig. 4.
Fig. 4.. Single-cell ATACseq reveals alveogenic mimicry and bridge-like clusters.
A, Unsupervised UMAP plot of snATACseq profile colored by genotype (left) and identified clusters (middle). Inlet (right) shows BA2 and LP2 clusters. B, Volcano plots showing differentially accessible chromatin peaks between Pik3caH1047R;Kdm6afl/fl and wild-type control or between Pik3caH1047R;Kdm6afl/fl and Pik3caH1047R or between Pik3caH1047R and wild-type control LP cells. C, Enrichment of transcription factor binding sites in differentially accessible chromatin. D, Pathways differentially enriched in Pik3caH1047R;Kdm6afl/fl versus all mammary epithelial LP cells inferred from gene accessibility ArchR Gene Scores. The top 12 enriched pathways are shown as identified using g:Profiler (p <0.05 with Benjamini-Hochberg FDR correction, >10-fold enrichment). E, UMAP plots showing open chromatin associated with alveolar/lactation-associated genes Lalba and Csn2. Inlet (right) shows open chromatin associated with alveolar/lactation gene Csn2, the basal marker gene Krt5 and the LP marker gene Kit in BA2 and LP2 clusters.
Fig. 5.
Fig. 5.. Loss of EpiDrivers induces multipotency.
A, Percent of GFP+ EPCAMhigh CD49fmid luminal cells at different time points after Ad-K5-Cre injection into mammary epithelium of mice with the indicated genotype. B, Representative FACS plot at 4 weeks post injection with Ad-K5-Cre. C, Whole-mount image of mammary glands 4 weeks and 7.5 weeks post Ad-K5-Cre injection showing K14+/K8- (empty arrows) as well as K14+/K8+ double-positive and K14-/K8+ GFP+ lineage-traced cells (filled arrows). Scale bar = 50 μm. D and E, Tumor-free survival of Pik3caH1047R;Kdm6afl/fl versus Pik3caH1047R after intraductal injection of Ad-K5-Cre (D) and Ad-K8-Cre (E).
Fig. 6.
Fig. 6.. scRNAseq reveals basal-to-alveolar transdifferentiating at the onset of breast cancer initiation.
A-C, UMAP plots showing Ad-K5-Cre lineage-traced basal mammary epithelial cells from control, Pik3caH1047R and Pik3caH1047R;Kdm6afl/fl mutant mice 2 weeks post-injection colored by genotype (A), clusters (B) and trajectories inferred by Monocle3 (C). D, Dot plot showing differentially expressed marker genes within the different epithelial clusters. E-G, UMAP and pseudo-time trajectory plots showing basal (E), luminal progenitor (F) and alveolar/lactation (G) marker signatures.
Fig. 7.
Fig. 7.. EpiDrivers function as Tumor Suppressors in Humans.
A, Average expression of the ‘Alveogenesis’ gene signature from 57 DCIS and 313 invasive tumors. B, Casein staining level by IHC in each tissue or tumor type. C, Casein staining intensity in individual cells in DCIS tumor cores separated by keratin staining. D, Representative imaging mass cytometry images of DCIS cores stained for casein and Krt5, Krt8 and nuclear stain. Scale bar = 100 μm. E, Prevalence of alterations in EpiDrivers in human breast tumors. Shallow deletion only displayed for KDM6A. F, Co-occurrence analysis of PIK3CA and EpiDriver mutations in the combined breast cancer dataset of TCGA and METABRIC. The results are shown for the complete set of identified EpiDrivers (left), or by excluding KMT2C (right), considering truncating and deleterious missense mutations. The heatmap shows the co-occurrence odds ratios (log2) across breast cancer subtypes, and all tumors considered, and significant (FDR-adjusted p < 0.05) associations are highlighted by black rectangles. g, Disease-specific survival (DSS) of breast cancer patients in the TCGA cohort stratified by phospho-Ser473 AKT (pAKT) and EpiDriver mutations. The long-rank p value is shown. h, Violin plots showing the expression of the Lemay Lactation and Pregnancy signatures in TCGA tumors with concurrent PIK3CA-EpiDriver mutations relative to other groups in luminal A and B breast cancer. The Mann-Whitney test p value is shown. The average value of the group with concurrent PIK3CA-EpiDriver mutations is depicted by a horizontal lilac line.

References

    1. Mateo J, Steuten L, Aftimos P, Andre F, Davies M, Garralda E, et al. Delivering precision oncology to patients with cancer. Nat Med 2022;28(4):658–65 doi 10.1038/s41591-022-01717-2. - DOI - PubMed
    1. Garraway LA, Lander ES. Lessons from the cancer genome. Cell 2013;153(1):17–37 doi 10.1016/j.cell.2013.03.002. - DOI - PubMed
    1. Vogelstein B, Papadopoulos N, Velculescu VE, Zhou S, Diaz LA Jr., Kinzler KW. Cancer genome landscapes. Science 2013;339(6127):1546–58 doi 10.1126/science.1235122. - DOI - PMC - PubMed
    1. Martincorena I, Raine KM, Gerstung M, Dawson KJ, Haase K, Van Loo P, et al. Universal Patterns of Selection in Cancer and Somatic Tissues. Cell 2017;171(5):1029–41 e21 doi 10.1016/j.cell.2017.09.042. - DOI - PMC - PubMed
    1. Castro-Giner F, Ratcliffe P, Tomlinson I. The mini-driver model of polygenic cancer evolution. Nat Rev Cancer 2015;15(11):680–5 doi 10.1038/nrc3999. - DOI - PubMed

Publication types