. 2022 Nov:143:36-47.
doi: 10.1016/j.clinph.2022.08.015. Epub 2022 Aug 30.

High-definition transcranial direct current stimulation modulates theta response during a Go-NoGo task in traumatic brain injury

Affiliations

High-definition transcranial direct current stimulation modulates theta response during a Go-NoGo task in traumatic brain injury

Hsueh-Sheng Chiang et al. Clin Neurophysiol. 2022 Nov.

Abstract

Objective: High Definition transcranial Direct Current Stimulation (HD-tDCS) has been shown to improve cognitive performance in individuals with chronic traumatic brain injury (TBI), although electrophysiological mechanisms remain unclear.

Methods: Veterans with TBI underwent active anodal (N = 15) vs sham (N = 10) HD-tDCS targeting the pre-supplementary motor area (pre-SMA). A Go-NoGo task was conducted simultaneously with electroencephalography (EEG) at baseline and after intervention completion.

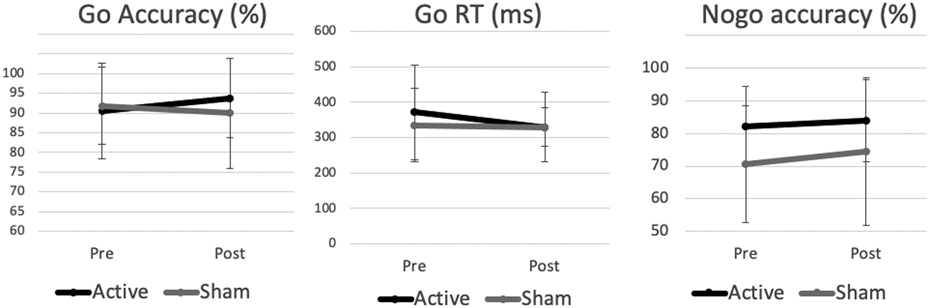
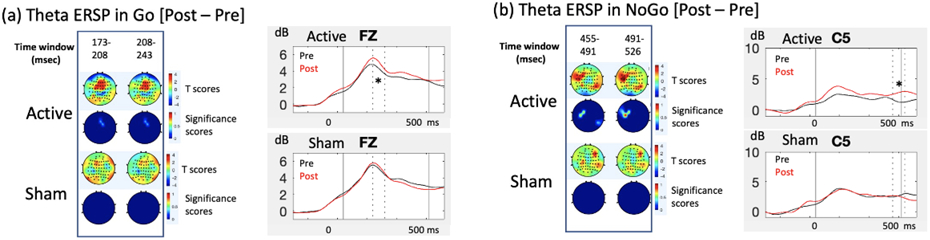
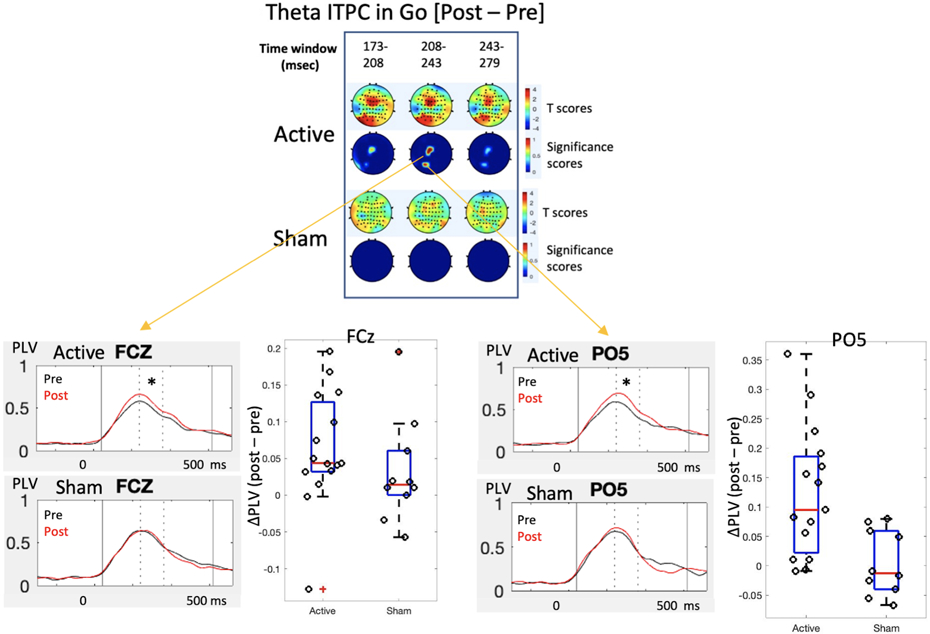
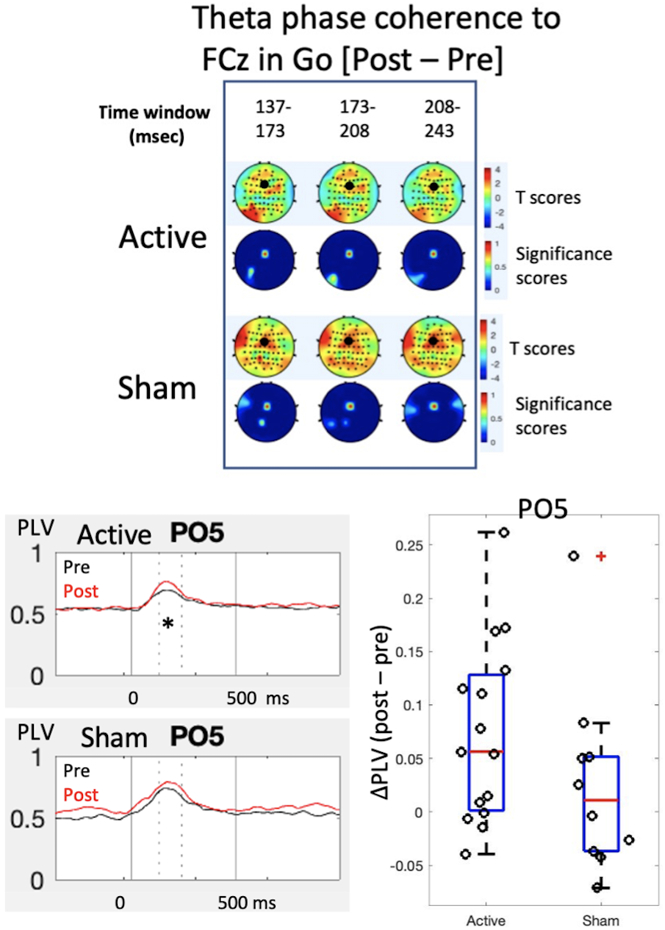
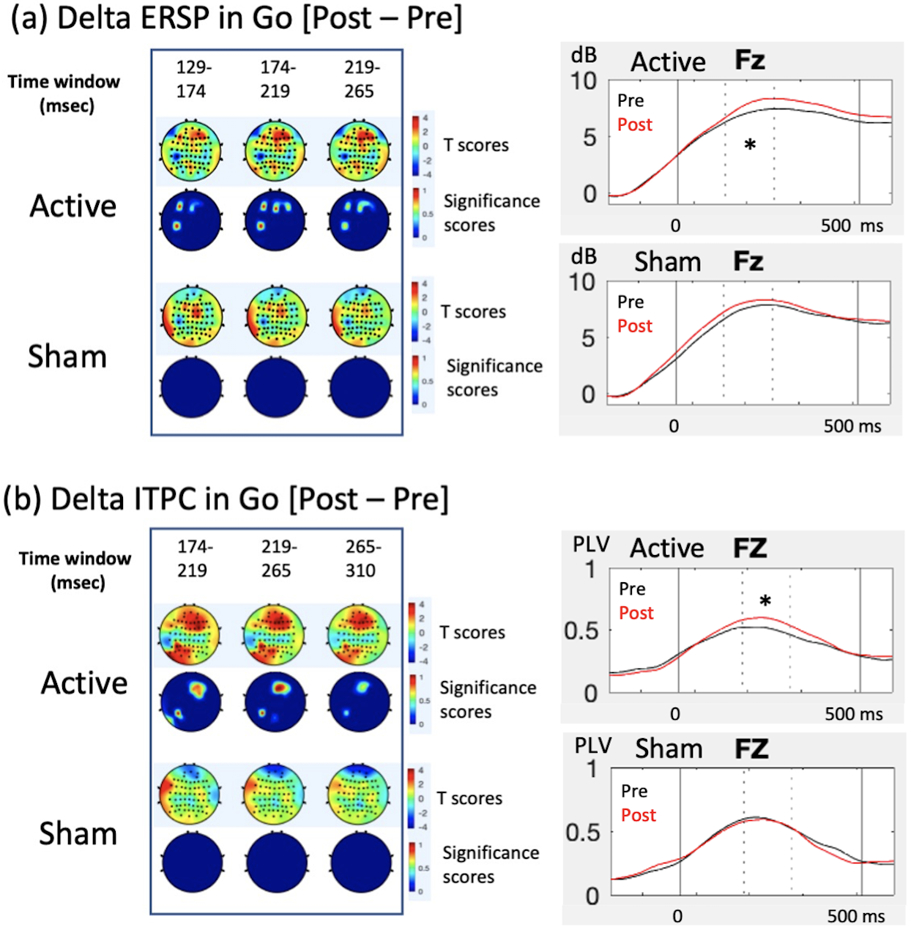
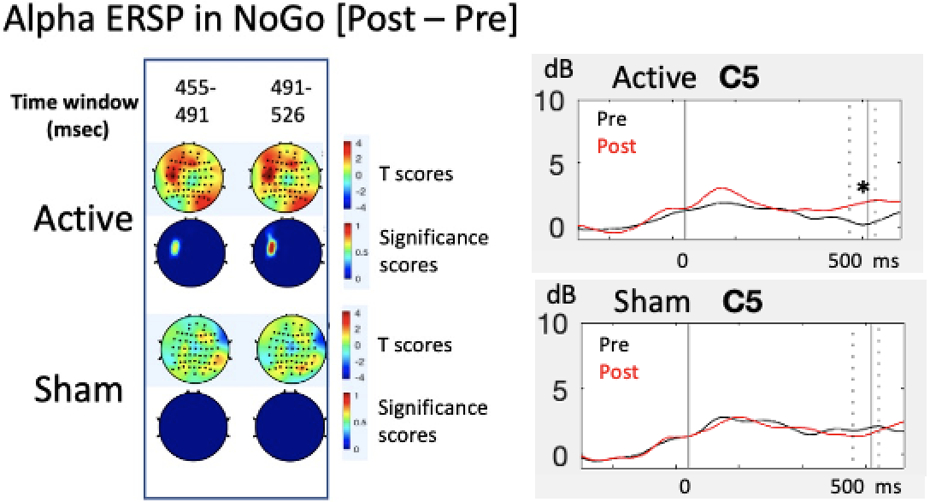
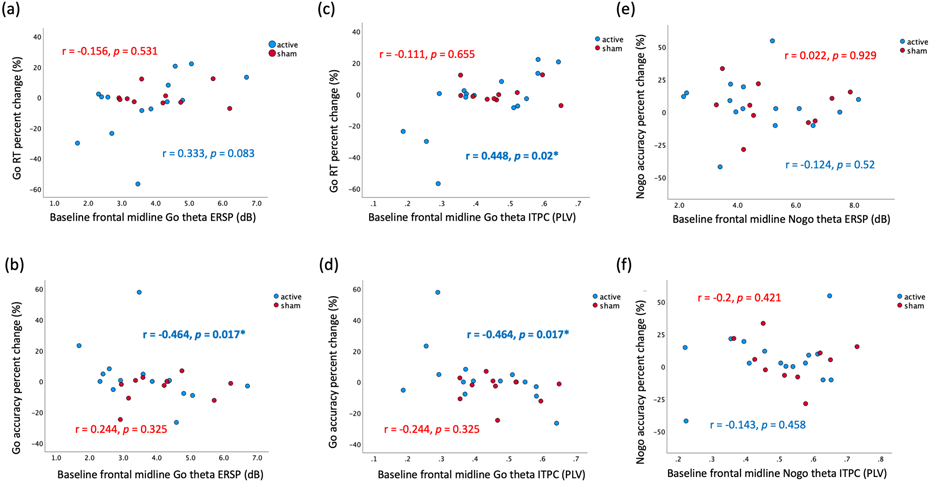
Results: We found increased theta event-related spectral perturbation (ERSP) and inter-trial phase coherence (ITPC) during Go in the frontal midline electrodes overlying the pre-SMA after active HD-tDCS intervention, but not after sham. We also found increased theta phase coherence during Go between the frontal midline and left posterior regions after active HD-tDCS. A late increase in alpha-theta ERSP was found in the left central region after active HD-tDCS. Notably, lower baseline theta ERSP/ITPC in the frontal midline region predicted more post-intervention improvement in Go performance only in the active group.

Conclusions: There are local and interregional oscillatory changes in response to HD-tDCS modulation in chronic TBI.

Significance: These findings may guide future research in utilizing EEG time-frequency metrics not only to measure interventional effects, but also in selecting candidates who may optimally respond to treatment.

Keywords: EEG; Electromodulation; Go-NoGo; HD-tDCS; Pre-SMA; TBI; Veterans; tDCS.


Conflict of interest statement

Declaration of Competing Interest The authors declare no known competing financial interests or personal relationships relevant to the work.

Figures

Figure 1.
Figure 1.
EEG task performance Error bars: standard deviations.
Figure 2.
Figure 2.
Theta ERSP results Permutation results showed a significant increase in the frontal midline theta ERSP around 173-243 ms post stimulus in the active group during Go, while no significant effects were found in the sham group (a, Left). Frontal midline theta ERSP (at Fz) during Go is represented separately for pre- and post-intervention data, showing difference (*) in the active group within this window (indicated by the dotted lines), but not in the sham group (a, Right). There was also a significant increase in the left central theta ERSP around 455-526 ms post stimulus in the active group during NoGo, while no significant effects were found in the sham group (b, Left). Left central theta ERSP (at C5) during NoGo is represented separately for pre- and post-intervention data, showing difference (*) in the active group within this window (indicated by the dotted lines), but not in the sham group (b, Right). In the depiction for each group, topography on top represents T scores (based on 2-tailed paired t tests within each group comparing post to pre data) averaged within each time window, while topography on bottom represents only those electrodes with significant difference (FDR < 0.05) within each corresponding time window. ERSP: event-related spectral perturbation; dB: decibel (unit of power).
Figure 3.
Figure 3.
Theta ITPC results Permutation results showed a significant increase in the frontal midline and left posterior theta ITPC around 173-279 ms post stimulus in the active group during Go, while no significant effects were found in the sham group (Top). Frontal midline and left posterior theta ITPC (at FCz and PO5, respectively) during Go is represented separately for pre- and post-intervention data, showing difference (*) in the active group within this window (indicated by the dotted lines), but not in the sham group (Bottom). Individual phase locking values (ΔPLV, difference between post and pre data) at these electrodes (FCz and PO5) during the time window of 173-279 ms post stimulus onset are represented in the boxplot separately for the active and sham groups (Bottom). In the depiction for each group, topography on top represents T scores (based on 2-tailed paired t tests within each group comparing post to pre data) averaged within each time window, while topography on bottom represents only those electrodes with significant difference (FDR < 0.05) within each corresponding time window. In these boxplots: the horizontal line (in red) inside of each box represents the sample median; the top and bottom edges of each box (in blue) represent the upper and lower quartiles, respectively; the whiskers represent the minimum and maximum values that are not outliers; outliers (> 1.5 interquartile range away from the top or bottom of the box) are plotted individually with a cross; black circles represent individual scores. ITPC: intertrial phase coherence; PLV: phase locking value (unit of phase coherence).
Figure 4.
Figure 4.
Theta phase coherence to FCz results Permutation results showed a significant increase in the theta (interareal) phase coherence between FCz (Top, indicated by the black dot in the topography) and the posterior electrodes (PO5) around 137-243 ms post stimulus in the active group during Go, while no significant effects were found in the sham group (Top). Left posterior theta (interareal) phase coherence to FCz (at PO5) during Go is represented separately for pre- and post-intervention data, showing difference (*) in the active group within this window (indicated by the dotted lines), but not in the sham group (Bottom Left). Individual phase locking values (ΔPLV, difference between post and pre data) at PO5 during the time window of 137-243 ms post stimulus onset are represented in the boxplot separately for the active and sham groups (Bottom Right). In the depiction for each group, topography on top represents T scores (based on 2-tailed paired t tests within each group comparing post to pre data) averaged within each time window, while topography on bottom represents only those electrodes with significant difference (FDR < 0.05) within each corresponding time window. In these boxplots: the horizontal line (in red) inside of each box represents the sample median; the top and bottom edges of each box (in blue) represent the upper and lower quartiles, respectively; the whiskers represent the minimum and maximum values that are not outliers; outliers (> 1.5 interquartile range away from the top or bottom of the box) are plotted individually with a cross; black circles represent individual scores. ITPC: intertrial phase coherence; PLV: phase locking value (unit of phase coherence).
Figure 5.
Figure 5.
Delta frequency results Permutation results showed a significant increase in the frontal midline delta ERSP around 129-265 ms post stimulus in the active group during Go, while no significant effects were found in the sham group (a, Left). Frontal midline delta ERSP (at Fz) during Go is represented separately for pre- and post-intervention data, showing difference (*) in the active group within this window (indicated by the dotted lines), but not in the sham group (a, Right). There was also a significant increase in the frontal midline delta ITPC around 174-310 ms post stimulus in the active group during Go, while no significant effects were found in the sham group (b, Left). Frontal midline delta ITPC (at Fz) during Go is represented separately for pre- and post-intervention data, showing difference (*) in the active group within this window (indicated by the dotted lines), but not in the sham group (b, Right). In the depiction for each group, topography on top represents T scores (based on 2-tailed paired t tests within each group comparing post to pre data) averaged within each time window, while topography on bottom represents only those electrodes with significant difference (FDR < 0.05) within each corresponding time window. ERSP: event-related spectral perturbation; ITPC: intertrial phase coherence; dB: decibel (unit of power); PLV: phase locking value (unit of phase coherence).
Figure 6.
Figure 6.
Alpha ERSP results Permutation results showed a significant increase in the left central alpha ERSP around 455-526 ms post stimulus in the active group during NoGo, while no significant effects were found in the sham group (Left). Left central theta ERSP (at C5) during NoGo is represented separately for pre- and post-intervention data, showing difference (*) in the active group within this window (indicated by the dotted lines), but not in the sham group (Right). In the depiction for each group, topography on top represents T scores (based on 2-tailed paired t tests within each group comparing post to pre data) averaged within each time window, while topography on bottom represents only those electrodes with significant difference (FDR < 0.05) within each corresponding time window. ERSP: event-related spectral perturbation; dB: decibel (unit of power).
Figure 7.
Figure 7.
Correlation results Baseline frontal midline Go theta ERSP did not show significant correlations with Go RT percent change in either group (a), while it did show a significant correlation with Go accuracy percent change in only active but not sham group (b). Baseline frontal midline Go theta ITPC showed significant correlations with both Go RT and accuracy percent change in the active group, but not in the sham group (c, d). Baseline frontal midline NoGo theta ITPC did not show significant correlations with NoGo accuracy percent change in either group (e, f). All correlation analyses were based on Kendall’s tau b correlation coefficient. Of note, correlations were still significant (p < 0.05) in the active group after the exclusions of one possible outlier in the active group (N = 14), as could be identified in the scattered plots (a-d). ERSP: event-related spectral perturbation; ITPC: intertrial phase coherence; dB: decibel (unit of power); PLV: phase locking value (unit of phase coherence).

Similar articles

Cited by

References

    1. Ahorsu DK, Adjaottor ES, Hung Lam BY. Intervention effect of non-invasive brain stimulation on cognitive functions among people with traumatic brain injury: A systematic review and meta-analysis. Brain Sci 2021;11. 10.3390/brainsci11070840. - DOI - PMC - PubMed
    1. Alario FX, Chainay H, Lehericy S, Cohen L. The role of the supplementary motor area (SMA) in word production. Brain Res 2006;1076:129–43. 10.1016/j.brainres.2005.11.104. - DOI - PubMed
    1. Allen C, Singh KD, Verbruggen F, Chambers CD. Evidence for parallel activation of the pre-supplementary motor area and inferior frontal cortex during response inhibition: A combined MEG and TMS study. R Soc Open Sci 2018;5. 10.1098/rsos.171369. - DOI - PMC - PubMed
    1. Bastos AM, Schoffelen JM. A tutorial review of functional connectivity analysis methods and their interpretational pitfalls. Front Syst Neurosci 2016;9. 10.3389/fnsys.2015.00175. - DOI - PMC - PubMed
    1. Benton LA, Hamsher K, and Sivan AB (1994). Multilingual Aphasia Examination. AJA Associates: Iowa City, IA.

Publication types