. 2022 Sep 26;57(18):2181-2203.e9.
doi: 10.1016/j.devcel.2022.08.009. Epub 2022 Sep 14.

Hedgehog signaling activates a mammalian heterochronic gene regulatory network controlling differentiation timing across lineages

Affiliations

Hedgehog signaling activates a mammalian heterochronic gene regulatory network controlling differentiation timing across lineages

Megan Rowton et al. Dev Cell. .

Abstract

Many developmental signaling pathways have been implicated in lineage-specific differentiation; however, mechanisms that explicitly control differentiation timing remain poorly defined in mammals. We report that murine Hedgehog signaling is a heterochronic pathway that determines the timing of progenitor differentiation. Hedgehog activity was necessary to prevent premature differentiation of second heart field (SHF) cardiac progenitors in mouse embryos, and the Hedgehog transcription factor GLI1 was sufficient to delay differentiation of cardiac progenitors in vitro. GLI1 directly activated a de novo progenitor-specific network in vitro, akin to that of SHF progenitors in vivo, which prevented the onset of the cardiac differentiation program. A Hedgehog signaling-dependent active-to-repressive GLI transition functioned as a differentiation timer, restricting the progenitor network to the SHF. GLI1 expression was associated with progenitor status across germ layers, and it delayed the differentiation of neural progenitors in vitro, suggesting a broad role for Hedgehog signaling as a heterochronic pathway.

Keywords: GLI transcription factors; Hedgehog signaling; congenital heart disease; differentiation; epigenetics; gene regulatory network; heart development; heterochrony; neuronal development; progenitor.


Conflict of interest statement

Declaration of interests The authors declare no competing interests.

Figures
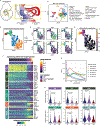
Figure 1.
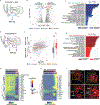
Figure 1.. Hedgehog signaling is specific to cardiac progenitors during cardiac differentiation in vivo.
(A) Diagram of Second Heart Field (SHF) and Heart Tube (HT) regions of an E10.5 mouse embryo. Dotted lines indicate the boundaries of microdissection for Drop-seq experiment (N = 2). (B) UMAP plot displaying 19 distinct cell type clusters identified from microdissected SHF and HT tissue. (C) tSNE plot showing 4 cardiac-associated clusters of pSHF and HT cells. (D) tSNE plots indicating the expression levels of cardiac transcription factors and CP/CM marker genes within the 4 CM-associated clusters. (E) Cardiac differentiation pseudotime (dpt) score indicated by cell color within tSNE plot of 4 cardiac-associated clusters. (F) Heatmap of individual cells from cardiac-associated Drop-seq clusters showing the denoised expression levels of target genes of 6 signaling pathways along the pseudotime differentiation trajectory. (G) Line plot indicating the aggregated relative expression levels of pathway target genes along the pseudotime differentiation trajectory. (H) Violin plots showing the metagene scores for signaling pathway target genes at the CP, intermediate and CM stages of cardiac differentiation for 6 signaling pathways. Int., intermediate; aSHF, anterior second heart field; pSHF, posterior second heart field; OFT, outflow tract; IFT, inflow tract; En, pulmonary endoderm.
Figure 2.
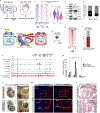
Figure 2.. Hedgehog signaling prevents premature activation of the cardiac differentiation program in the second heart field.
(A) Diagram of the SHF and HT regions of an E10.5 mouse embryo. Dotted lines indicate the boundaries of microdissection for a SHF-specific RNA-seq from Shh+/+ and Shh−/− embryos (N = 4–5). (B) Volcano plot displaying activated and repressed genes in the Shh−/− relative to Shh+/+ pSHF. Red and blue dots signify significantly upregulated and downregulated genes, respectively. (C) Gene ontology (GO) analysis of Shh−/− repressed genes. (D) Gene ontology (GO) analysis of Shh−/− activated genes. (E) Diagram of the SHF and HT regions of an E10.0 mouse embryo with dotted lines that indicate the boundaries of microdissection for RNA-seq comparing the pSHF and HT (N = 6). (F) MA plot and box plots illustrating the distribution of Shh−/− dysregulated genes superimposed on the distribution of differentially expressed genes between the wild type pSHF and HT. (G) Heatmap showing the wild type expression levels of Shh−/− repressed genes along the pseudotime differentiation trajectory from cardiac-associated Drop-seq clusters. (H) Heatmap showing the wild type expression levels of Shh−/− activated genes along the pseudotime differentiation trajectory from cardiac-associated Drop-seq clusters. (I) Immunofluorescent staining for sarcomeric myosin (MF20) in the E10.5 pSHF of Shh+/+ and Shh−/− embryos. MF20 staining is shown in red and DAPI counterstain is shown in grey. White bracket demarcates the forming DMP (N = 3–4). Scale bars = 200μm. DMP, dorsal mesenchymal protrusion. *** P ≦ 0.005.
Figure 3.
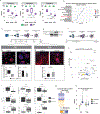
Figure 3.. The Hh signaling transcription factor GLI1 is sufficient to delay cardiomyocyte differentiation in vitro.
(A) Diagram of a doxycycline-inducible GLI1-FTA transgenic cassette inserted into the Hprt locus in mESCs. (B) Western blot showing induction of GLI1 protein, a marker of active Hh signaling, after doxycycline treatment for 24 hours in CPs. (C) Schematic representation of the experimental design employed for transient GLI1 overexpression (GLI1 OE) in mESC-derived CM differentiations. (D) Immunofluorescent staining for cardiac troponin (cTnT) in control and GLI1 OE cells harvested at D8. cTnT staining is shown in red and DAPI staining is shown in blue. Scale bar = 100μm. (E) Quantification of the area of cTnT-positivity in control and GLI1 OE cells at D8 (N = 10). (F) Quantification of the number of beating foci in videos of control and GLI1 OE cells at D8 (N = 10). (G) Immunofluorescent staining for cardiac troponin in control and GLI1 OE cells harvested at D12. cTnT staining is shown in red and DAPI staining is shown in blue. Scale bar = 100μm. (H) Quantification of the area of cTnT-positivity in control and GLI1 OE cells at D12 (N = 10). (I) Quantification of the number of beating foci in videos of control and GLI1 OE cells at D12 (N = 10). (J) Schematic representation of transient GLI1 overexpression (GLI1 OE) experimental design in mESC-derived CM differentiation for RNA-seq time series analysis. (K) Time-series heatmap of differentially expressed genes in GLI1 OE CPs relative to control differentiations at D6, D8 and D12 (N = 2–4). (L) Volcano plot displaying activated and repressed genes in GLI1 OE CPs relative to control CPs embryos at D6. Blue and yellow dots signify significantly activated and repressed genes, respectively (N = 4). (M) Gene ontology (GO) analysis of GLI1 OE activated genes at D6. (N) Gene ontology (GO) analysis of GLI1 OE repressed genes at D6. (O) Boxplots showing repression of cardiac differentiation markers in GLI1 OE mESC-CPs at D6. (P) Diagram of the SHF and HT regions of an E10.0 mouse embryo with dotted lines that indicate the boundaries of microdissection for RNA-seq experiment comparing the pSHF and HT of E10.0 wild type embryos (N = 6). (Q) MA plot with box plots illustrating the distribution of GLI1 OE dysregulated genes superimposed on the distribution of differential expression between the wild type E10.0 pSHF and HT. n.s., not significant. * P ≦ 0.05, *** P ≦ 0.005.
Figure 4.
Figure 4.. GLI1 directly activates a GRN comprised of progenitor genes controlled by distal enhancers.
(A) Schematic representation of experimental design for ChAP/ChIP-seq in GLI1 overexpression (GLI1 OE) mESC-derived cardiac differentiations (N = 2). (B) Heatmap showing GLI1-FTA ChAP-seq signal Z-scores in mESC-CPs at D6 at all GLI1-bound regions. (C) Bar plot revealing the percentage of D6 GLI1-bound regions annotated to genomic features. (D) Heatmap showing the H3K27ac ChIP-seq signal Z-scores in mESC-CPs at D6 at all GLI1-bound regions. (E) Violin plot depicting the fold enrichment over input of H3K27ac ChIP-seq signal at GLI1-bound regions in D6 control and GLI1 OE conditions. (F) Volcano plot displaying activated and deactivated enhancers in GLI1 OE CPs relative to control CPs embryos at D6. Gold dots label all GLI1-bound regions. (G) Heatmap of individual cells from cardiac-associated Drop-seq clusters showing the denoised expression levels of GLI1 GRN genes associated with developmental regulation along the pseudotime differentiation trajectory. (H) Heatmap of individual cells from cardiac-associated Drop-seq clusters showing the denoised expression levels of GLI1 GRN genes associated with cell adhesion or migration along the pseudotime differentiation trajectory. (I) Genome browser view of the GLI1 GRN developmental regulators Ncor2 and Smad3, with H3K27ac signal enrichment in D6 control and GLI1 OE. GLI1 GRN enhancers are highlighted in grey boxes. (J) Genome browser view of the GLI1 GRN adhesion/migration regulators Sema3e and Snai1, with H3K27ac signal enrichment in D6 control and GLI1 OE. GLI1 GRN enhancers are highlighted in grey boxes. GRN, gene regulatory network. **** P ≦ 0.001.
Figure 5.
Figure 5.. The GLI1 GRN is pSHF-like and is activated de novo in mESC-CPs.
(A) Schematic representation of experimental design for ATAC-seq in GLI1 overexpression (GLI1 OE) mESC-derived cardiac differentiations (N = 2). (B) Heatmap showing the ATAC-seq signal Z-scores in mESC-CPs at D7 at GLI1 GRN enhancers. (C) Violin plot depicting the fold enrichment over background of ATAC-seq signal at GLI1 GRN enhancers in D7 control and GLI1 OE conditions. (D) Density plot showing the GLI1-mediated log2FC in ATAC-seq and H3K27ac ChIP-seq enrichment for all putative regulatory regions in D6 and D7 mESC-CPs. Blue hexes label all GLI1-bound regions. (E) Bar plot depicting the proportion of GLI1 GRN enhancers demonstrating accessibility at D5 prior to GLI1 OE. (F) Upset plot showing the intersection of accessible regions in D5, D7 control and D7 GLI1 OE conditions. Pink bars represent the regions in each intersection bin that are GLI1 GRN enhancers. (G) GLI1-FTA ChAP-seq and ATAC-seq signal fold enrichment over input near the GLI1 target gene, Ptch1. GLI1 GRN enhancers with D5 accessibility (N = 2) are highlighted in blue boxes, and de novo accessible GLI1 GRN enhancers (N = 13) are highlighted in purple boxes. (H) Diagram of the SHF and HT of an E10.0 mouse embryo with dotted lines that indicate the boundaries of microdissection for a pSHF-specific ATAC-seq (N = 3). (I) Scatterplots of normalized ATAC-seq counts comparing accessibility between D7 control and D7 GLI1 OE in vitro, and the in vivo pSHF. (J) Genome browser view of a locus 76kb upstream of Foxf1, a GLI1 GRN gene, with ATAC-seq data from D7 control and GLI1 OE in vitro and the in vivo pSHF. GLI1 GRN enhancers that demonstrate de novo accessibility due to GLI1 in mESC-CPs are highlighted in grey boxes. *** P ≦ 0.001.
Figure 6.
Figure 6.. A GLI TF transition restricts the heterochronic GRN to the SHF and prevents Congenital Heart Disease.
(A) Diagram of the SHF and HT regions of an E10.0 mouse embryo and an adult mouse heart with dotted lines that indicate the boundaries of microdissection for ATAC-seq or protein isolation (N = 3). (B) Heatmap showing ATAC-seq signal Z-scores in the pSHF, HT and adult heart at GLI1 GRN enhancers. (C) Violin plot comparing mean ATAC-seq fold enrichment in the pSHF, HT and adult heart at GLI1 GRN enhancers. (D) Western blot demonstrating the expression level of GLIA and GLIR proteins in the E10.0 wild type pSHF and HT. (E) Bar plot showing the relative proportion of GLIA and GLIR proteins in the E10.0 wild type pSHF and HT, from (D). (F) Schematic of a model describing how Hh GLIA and GLIR TFs could regulate GLI1 GRN genes in a spatiotemporal manner in the mouse embryo to control SHF CM differentiation timing (G) Schematic representation of experimental design for ChAP-seq in GLI3R-FTA overexpression (GLI3 OE) mESC-derived cardiac differentiations (N = 2). (H) Heatmap showing GLI3R-FTA ChAP-seq signal Z-scores in mESC-CPs at D6 at all in vivo-accessible GLI1 GRN enhancers. (I) Bar plot depicting the proportion of GLI1 GRN genes with GLI3R-FTA binding within 200kb of the TSS. (J) Genome browser view of the Foxf1 locus showing the Foxf1 TSS and a GLI1 GRN enhancer upstream of the TSS (grey box, Fox enhancer). (K) Bar plots depicting luciferase reporter activity resulting from co-transfection of TBX5 with either GLI1 or GLI3R (N = 3). (L) Transient transgenic analysis of lacZ reporter expression in the E10.0 pSHF (red box) and HT (gold box) driven by wild type and GLI binding site mutant versions of the Fox enhancer (N = 5–8). (M) Immunofluorescent staining for MYL7 in the E10.5 pSHF from control and GLI3R OE embryos (blue = DAPI, red = MYL7). White bracket demarcates the forming DMP (N = 3). Scale bars = 200μm. (N) Histological sections of E14.5 hearts from control and GLI3R OE embryos. Black arrowheads highlight incidence of AVSD (N = 5). Scale bars = 200μm. GBS, GLI binding site. * P ≦ 0.05, **** P ≦ 0.001.
Figure 7.
Figure 7.. GLI1 expression in neural progenitors transiently delays neuronal differentiation.
(A) Gene expression rankings for Gli1 and Gapdh from transcriptional profiling of mouse germ layer-specific differentiation series (N = 2–6). (B) Dot plot of GO term analysis of genes expressed more highly in progenitor cells than in differentiated cells across all germ layers in mice. (C) Schematic representation of the transient GLI1 OE experimental design in mESC-derived differentiating neurons. (D) Western blot showing induction of GLI1 protein expression in neural progenitors after doxycycline treatment for 48 hours. (E) Immunofluorescent staining for pan-neuronal marker TUJ1 in control and GLI1 OE cells harvested at D5. TUJ1 staining is shown in red and DAPI counterstain is shown in blue. Scale bar = 100μm. (F) Quantification of the ratio of axons to neurospheres in control and GLI1 OE cells at D5 (N = 10). (G) Quantification of the area of TUJ1-positivity in control and GLI1 OE cells at D5 (N = 10). (H) Immunofluorescent staining for TUJ1 in control and GLI1 OE cells harvested at D10. TUJ1 staining is shown in red and DAPI counterstain is shown in blue. Scale bar = 100μm. (I) Quantification of the area of TUJ1-positivity in control and GLI1 OE cells at D10 (N = 10). (J) Schematic representation of the transient GLI1 overexpression (GLI1 OE) experimental design in mESC-derived differentiating neurons for RNA-seq time series (N = 3). (K) Volcano plot displaying activated and repressed genes in GLI1 OE neural progenitors relative to control neural progenitors at D5. Blue and yellow dots signify significantly dysregulated genes. (L) Boxplots showing repression of neurogenic TFs (top) and neural differentiation products (middle) and activation of neural progenitor TFs (bottom) in GLI1 OE mESC-NPs at D5. (M) Time-series heatmap of the log2 FC values of genes differentially expressed in GLI1 OE neural cells relative to control at D5 and at D10. (N) Boxplots showing a time series of the mean log2 fold change of genes activated and repressed by GLI1 OE in neural cells at Day 5 and Day 10, relative to all genes. * P ≦ 0.05, ** P ≦ 0.01, *** P ≦ 0.005.

References

    1. Agathocleous M, Locker M, Harris WA, Perron M, 2007. A general role of hedgehog in the regulation of proliferation. Cell Cycle. 10.4161/cc.6.2.3745 - DOI - PubMed
    1. Akerberg BN, Gu F, VanDusen NJ, Zhang X, Dong R, Li K, Zhang B, Zhou B, Sethi I, Ma Q, Wasson L, Wen T, Liu J, Dong K, Conlon FL, Zhou J, Yuan GC, Zhou P, Pu WT, 2019. A reference map of murine cardiac transcription factor chromatin occupancy identifies dynamic and conserved enhancers. Nat. Commun. 2019 101 10, 1–16. 10.1038/s41467-019-12812-3 - DOI - PMC - PubMed
    1. Ambros V, Horvitz HR, 1984. Heterochronic mutants of the nematode Caenorhabditis elegans. Science 226, 409–416. 10.1126/science.6494891 - DOI - PubMed
    1. Averbukh I, Lai SL, Doe CQ, Barkai N, 2018. A repressor-decay timer for robust temporal patterning in embryonic drosophila neuroblast lineages. eLife 7. 10.7554/eLife.38631 - DOI - PMC - PubMed
    1. Bademci G, Abad C, Incesulu A, Elian F, Reyahi A, Diaz-Horta O, Cengiz FB, Sineni CJ, Seyhan S, Atli EI, Basmak H, Demir S, Nik AM, Footz T, Guo S, Duman D, Fitoz S, Gurkan H, Blanton SH, Walter MA, Carlsson P, Walz K, Tekin M, 2019. FOXF2 is required for cochlear development in humans and mice. Hum. Mol. Genet. 28, 1286–1297. 10.1093/HMG/DDY431 - DOI - PMC - PubMed

Publication types