. 2022 Oct;610(7933):791-795.
doi: 10.1038/s41586-022-05319-3. Epub 2022 Sep 15.

Structures of α-synuclein filaments from human brains with Lewy pathology

Affiliations

Structures of α-synuclein filaments from human brains with Lewy pathology

Yang Yang et al. Nature. 2022 Oct.

Abstract

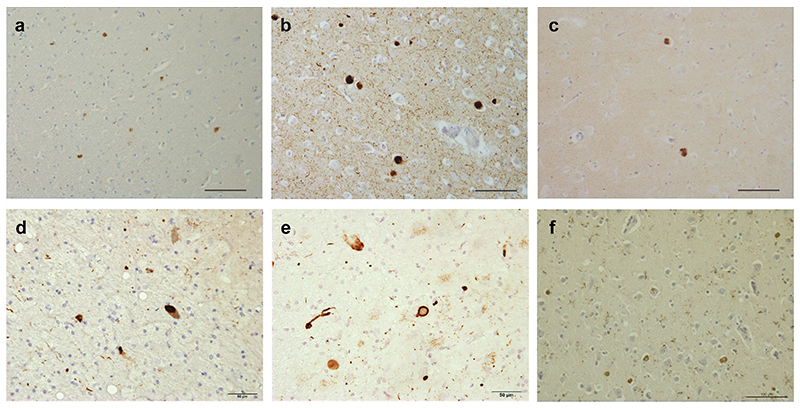
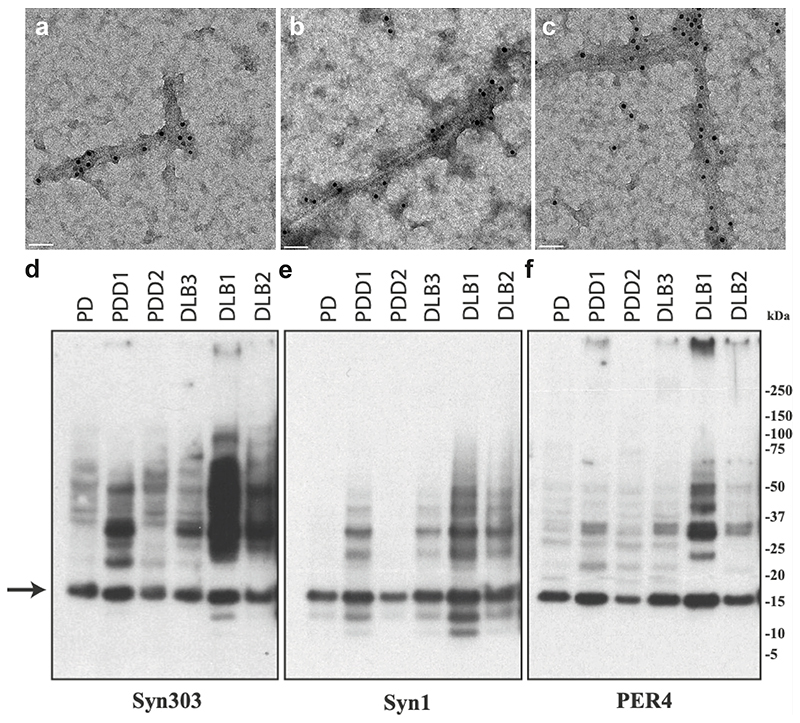
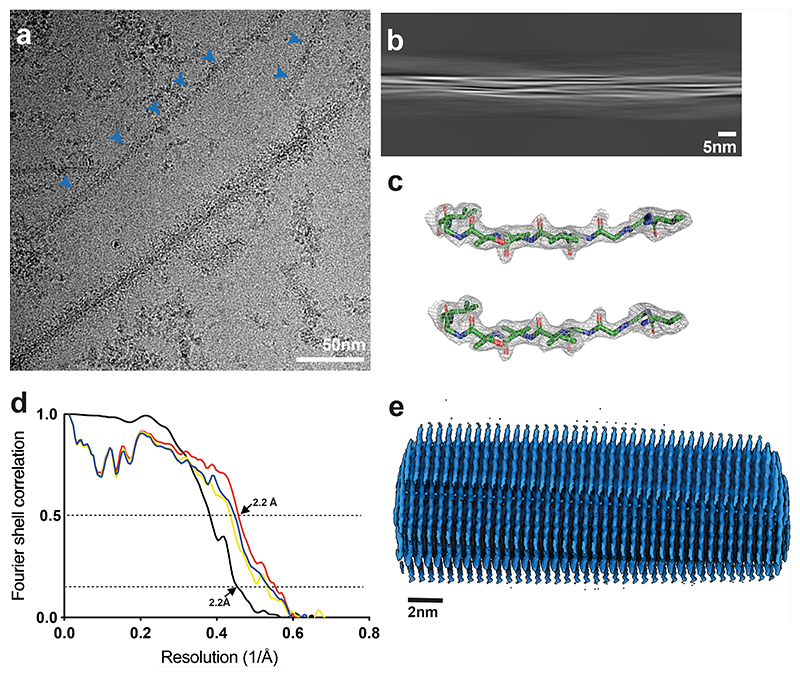
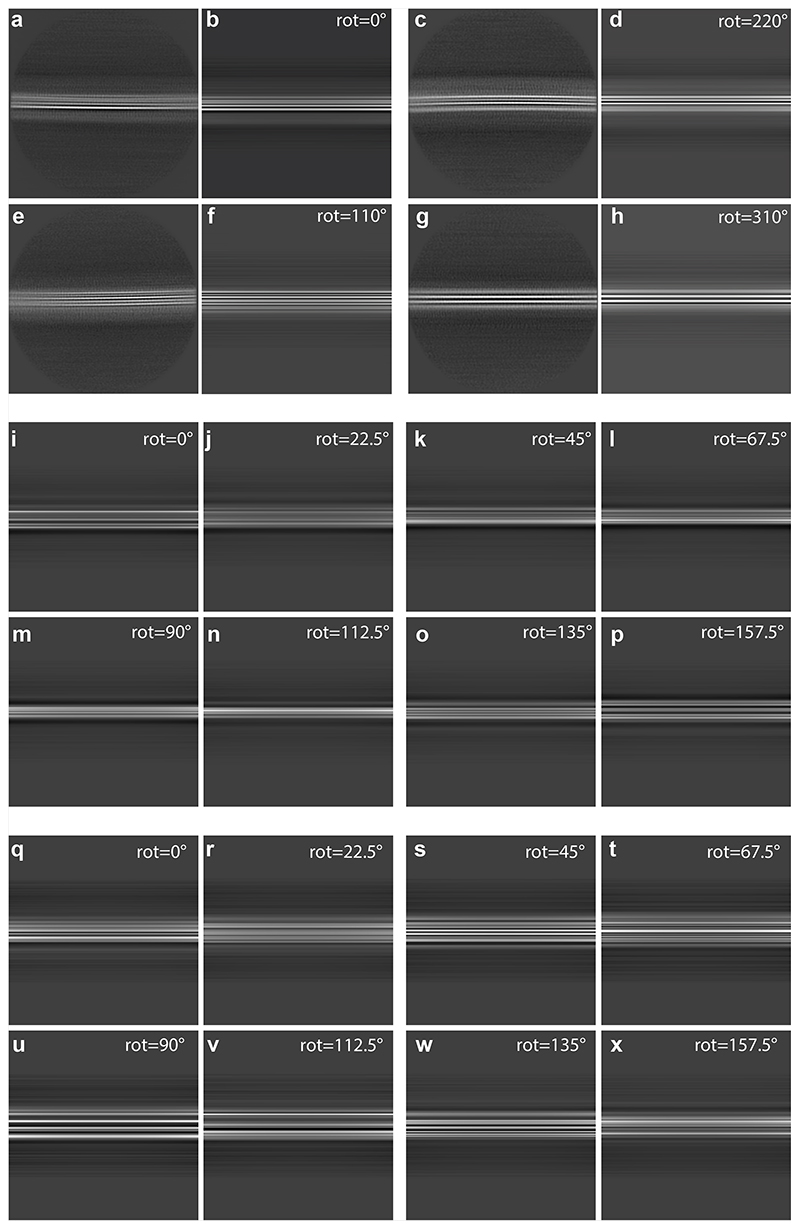
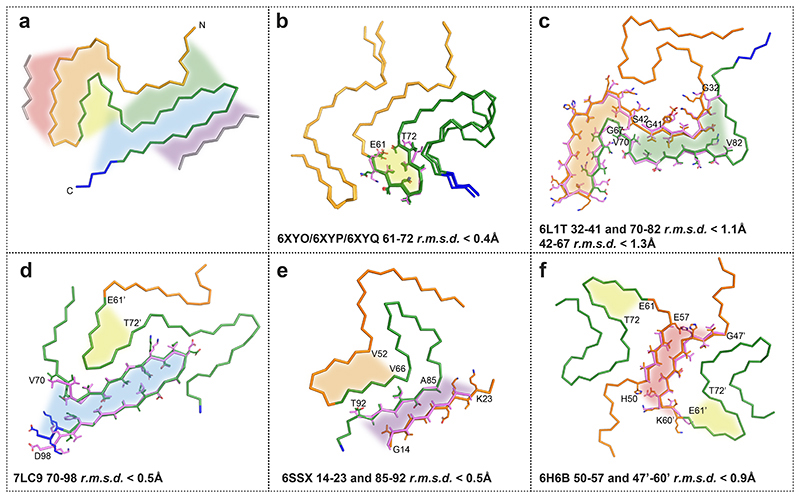
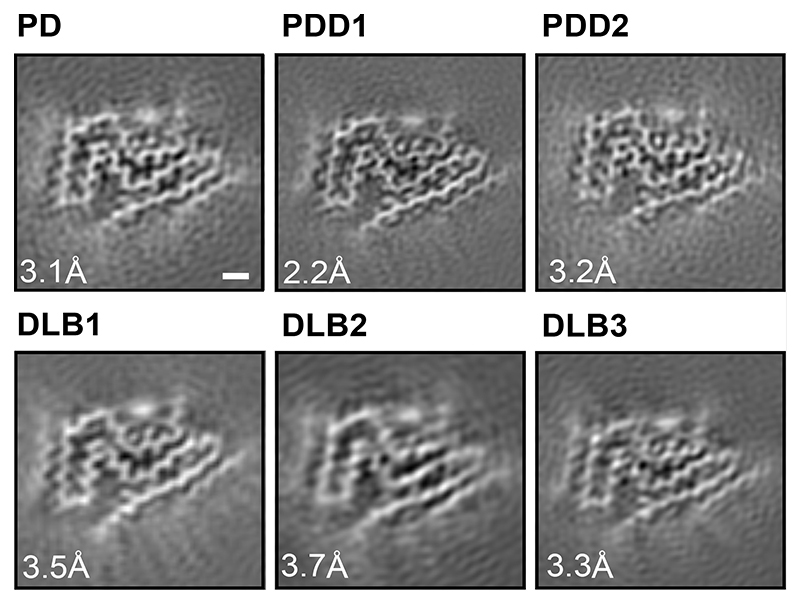
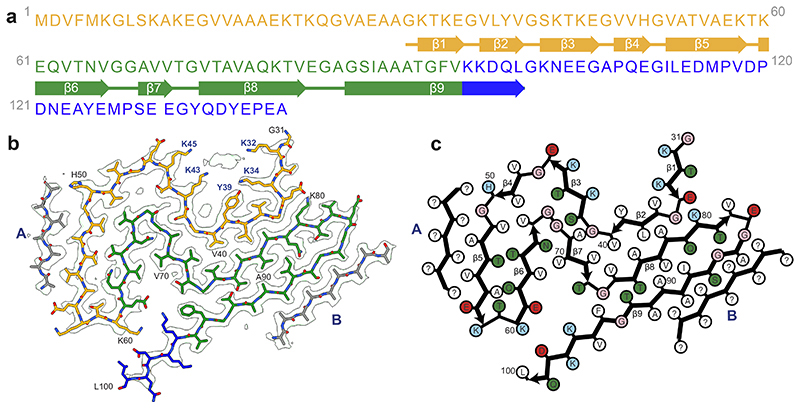
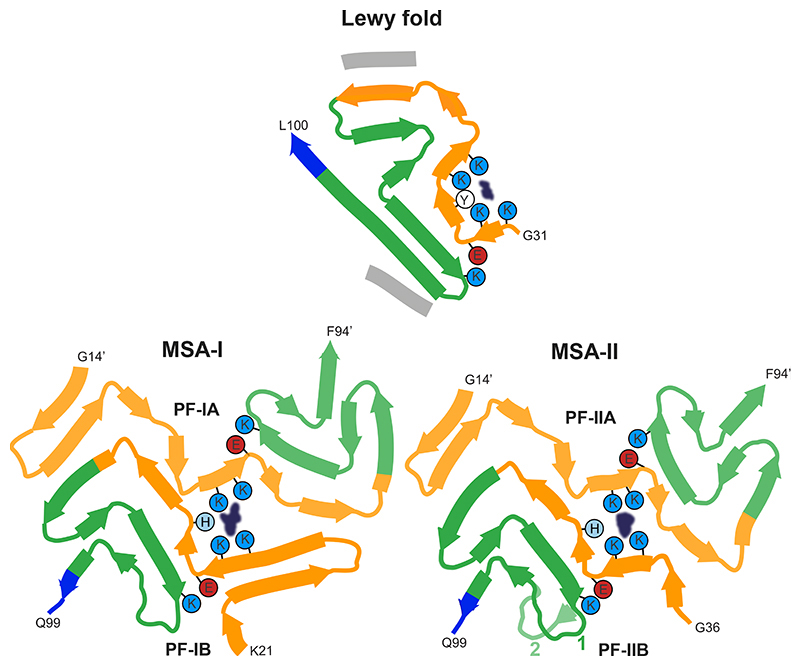
Parkinson's disease (PD) is the most common movement disorder, with resting tremor, rigidity, bradykinesia and postural instability being major symptoms1. Neuropathologically, it is characterized by the presence of abundant filamentous inclusions of α-synuclein in the form of Lewy bodies and Lewy neurites in some brain cells, including dopaminergic nerve cells of the substantia nigra2. PD is increasingly recognised as a multisystem disorder, with cognitive decline being one of its most common non-motor symptoms. Many patients with PD develop dementia more than 10 years after diagnosis3. PD dementia (PDD) is clinically and neuropathologically similar to dementia with Lewy bodies (DLB), which is diagnosed when cognitive impairment precedes parkinsonian motor signs or begins within one year from their onset4. In PDD, cognitive impairment develops in the setting of well-established PD. Besides PD and DLB, multiple system atrophy (MSA) is the third major synucleinopathy5. It is characterized by the presence of abundant filamentous α-synuclein inclusions in brain cells, especially oligodendrocytes (Papp-Lantos bodies). We previously reported the electron cryo-microscopy structures of two types of α-synuclein filament extracted from the brains of individuals with MSA6. Each filament type is made of two different protofilaments. Here we report that the cryo-electron microscopy structures of α-synuclein filaments from the brains of individuals with PD, PDD and DLB are made of a single protofilament (Lewy fold) that is markedly different from the protofilaments of MSA. These findings establish the existence of distinct molecular conformers of assembled α-synuclein in neurodegenerative disease.


Conflict of interest statement

Competing Interests

The authors declare no competing interests.

Figures

Extended Data Figure 1
Extended Data Figure 1. Immunostaining of α-synuclein inclusions.
Sections from brain regions contralateral to those used for cryo-EM structure determination were stained with monoclonal antibody Syn1 (1:1,000). (a), Cingulate cortex from PD; (b), Cingulate cortex from PDD1; (c), Cingulate cortex from PDD2; (d), Frontal cortex from DLB1; (e), Frontal cortex from DLB2; (f), Cingulate cortex from DLB3. Scale bars: a-c, f, 100 μm; d,e, 50 μm.
Extended Data Figure 2
Extended Data Figure 2. Negative-stain immunoelectron microscopy and immunoblotting of sarkosyl-insoluble material.
PER4 was used at 1:50 in (a-c). (a), PD (Cingulate cortex); (b), PDD1 (Cingulate cortex); (c), DLB3 (Cingulate cortex); Syn303, Syn1 and PER4 were used at 1:4,000 in (d-f). The brain regions used for cryo-EM were also used for immunoblotting. The arrow points to the position of monomeric α-synuclein.
Extended Data Figure 3
Extended Data Figure 3. Cryo-EM maps, cryo-EM images and resolution estimates.
(a), α-Synuclein filaments (blue arrows) from PDD1. Scale bars, 50 nm. (b), Projection features of Lewy filament. Scale bars, 5 nm. (c), Zoomed-in view of the main chain showing density of the oxygen atoms. (d), Fourier shell correlation (FSC) curves for cryo-EM maps are shown in black; for the final refined atomic model against the final cryo-EM map in red; for the atomic model refined in the first half map against that half map in blue; for the refined atomic model in the first half map against the other half map in yellow. (e), Side view of the Lewy fold.
Extended Data Figure 4
Extended Data Figure 4. Twisted and untwisted filaments in 2D class averages and projections.
(a,c,e,g), 2D class averages without twist for case 1 of PDD; (b,d,f,h) projections of untwisted models with the Lewy fold, rotated by 0, 220, 110 and 310 degrees, respectively, along the first Euler angle (rot). Box size, 640 Å. (i-p) Projections of untwisted models of the type 3 filaments from seeded assembly with MSA brain (EMD-12269, PDB 7NCK), rotated by 0, 22.5, 45, 67.5, 90, 112.5, 135 and 157.5 degrees, respectively. (q-x) Projections of untwisted models with the MSA type IIA fold (EMD-10651, PDB 6XYP), rotated by 0, 22.5, 45, 67.5, 90, 112.5, 135 and 157.5 degrees, respectively.
Extended Data Figure 5
Extended Data Figure 5. Twisted and untwisted segments coexist within filaments.
(a,b,c), Micrographs of filaments with untwisted and twisted segments. Blue indicates segments that contributed to twisted 2D class averages; red indicates segments that contributed to untwisted 2D class averages.
Extended Data Figure 6
Extended Data Figure 6. Comparison of the Lewy fold with structures of α-synuclein filaments from human brains or assembled from recombinant proteins.
(a), Ribbon plot of the Lewy fold; the protein chain is coloured as in Figure 2. Highlighted by red, orange, yellow, green, blue and purple areas are substructures that are individually shared with other filament structures. These local similarities are indicated with the same coloured areas and the overlays of the corresponding substructures are shown in sticks on the following panels (b-f). (b), Common core structure of MSA Type I and Type II filaments (made of PFIA/IIA 14-47 and PFIB/IIB 41-99), with a shared substructure highlighted in yellow. (c), pY39 α-synuclein protofilament (PDB:6L1T) with two different substructures highlighted in orange and green. (d), N-terminally truncated α-synuclein (40-140) dimeric filament (PDB:7LC9), with two different substructures in its protofilaments, highlighted in blue and yellow. Residue numbers with apostrophes indicate those from the other protofilament. (e), Polymorph 2a filament (PDB:6SSX), with two substructures highlighted in purple and orange. (f), Polymorph 1a filament (PDB:6H6B) contains yellow-coloured substructures in its protofilaments and a red-coloured substructure in their dimeric interface.
Extended Data Figure 7
Extended Data Figure 7. Zoomed-in cryo-EM densities around Y39 of α-synuclein in the Lewy fold.
(a), model and cryo-EM densities of the Lewy fold. Models are shown as sticks in green; densities as grey mesh. (b), model and cryo-EM densities of the MSA type I fold (6XYO, EMD-10650). Models are shown as sticks in yellow. (c), model and cryo-EM densities of α-synuclein filaments with phosphorylated Y39 (6L1T, EMD-0801). Models are shown as sticks in blue.
Figure 1
Figure 1. Cross-sections of α-synuclein filaments (Lewy fold) perpendicular to the helical axis, with a projected thickness of approximately one rung.
PD, Parkinson’s disease; PDD, Parkinson’s disease dementia; DLB, Dementia with Lewy bodies. Scale bar, 1 nm.
Figure 2
Figure 2. Cryo-EM structure of α-synuclein filaments from Parkinson’s disease, Parkinson’s disease dementia and dementia with Lewy bodies (Lewy fold).
(a). Amino acid sequence of human α-synuclein. N-terminal region (residues 1-60) in orange, NAC region (residues 61-95) in green and C-terminal region (residues 96-140) in blue. Thick connecting lines with arrowheads indicate β-strands. (b). Cryo-EM density map and atomic model of the Lewy fold. The filament core extends from G31-L100. Islands A and B are indicated in grey. (c). Schematic of the Lewy filament fold of α-synuclein. Negatively charged residues are in red, positively charged residues in blue, polar residues in green, apolar residues in white, sulfur-containing residues in yellow and glycines in pink. Thick connecting lines with arrowheads indicate β-strands. Unknown residues are indicated by question marks.
Figure 3
Figure 3. Comparison of the Lewy and MSA α-synuclein filament folds.
Schematic of secondary structure elements in the Lewy and MSA folds, depicted as a single rung, and coloured as in Figure 2 (N-terminal region of α-synuclein in orange, NAC region in green and C-terminal region in blue; thick connecting lines with arrowheads indicate β-strands). The extra densities in all structures are depicted in dark blue. The positions of their surrounding residues, as well as the supporting salt bridges between E35 and K80 in the Lewy fold and between E46 and K80 in MSA protofilaments, are highlighted with coloured circles. Residue numbers with apostrophes indicate those from the other protofilament.

Comment in

References

    1. Berg D, et al. Time to redefine Parkinson’s disease? Introductory statement of the MDS taskforce on the definition of Parkinson’s disease. Mov Disord. 2014;29:454–462. - PMC - PubMed
    1. Goedert M, Spillantini MG, Del Tredici K, Braak H. 100 years of Lewy pathology. Nature Rev Neurol. 2013;9:13–24. - PubMed
    1. Aarsland D, Andersen K, Larsen JP, Lolk A, Kragh-Sørensen P. Prevalence and characteristics of dementia in Parkinson disease: an 8-year prospective study. Arch Neurol. 2003;60:387–392. - PubMed
    1. McKeith IG, et al. Diagnosis and management of dementia with Lewy bodies. Fourth consensus report of the DLB consortium. Neurology. 2017;879:88–100. - PMC - PubMed
    1. Fanciulli A, Wenning GK. Multiple system atrophy. N Engl J Med. 2015;372:249–263. - PubMed

Publication types

Substances