. 2023 Jul;72(7):1271-1287.
doi: 10.1136/gutjnl-2021-326451. Epub 2022 Sep 15.

Biopsy and blood-based molecular biomarker of inflammation in IBD

Affiliations

Biopsy and blood-based molecular biomarker of inflammation in IBD

Carmen Argmann et al. Gut. 2023 Jul.

Abstract

Objective: IBD therapies and treatments are evolving to deeper levels of remission. Molecular measures of disease may augment current endpoints including the potential for less invasive assessments.

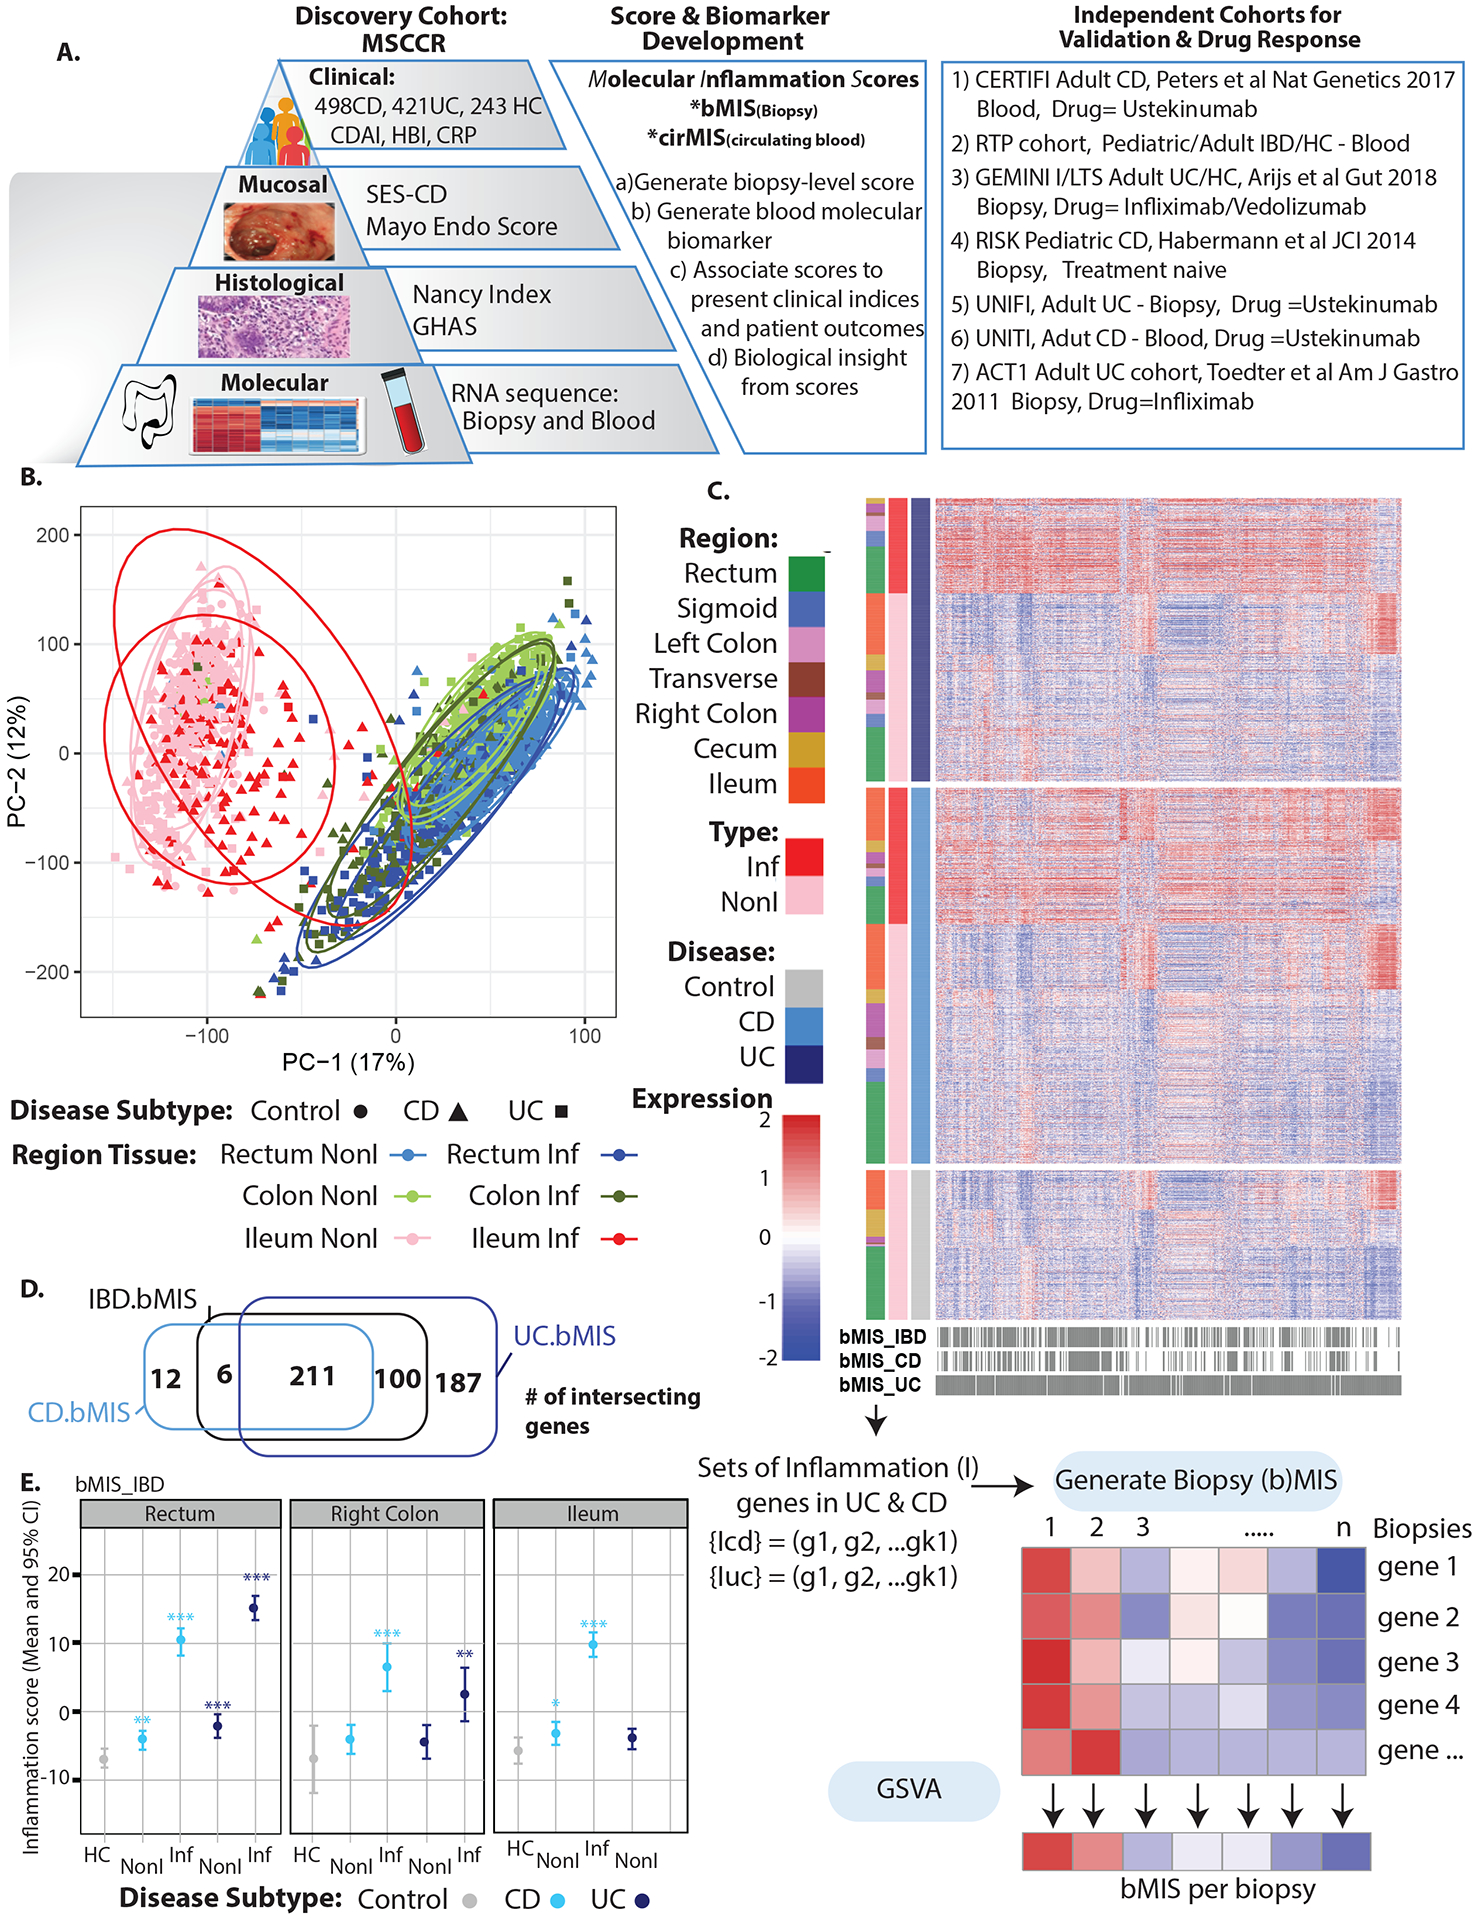
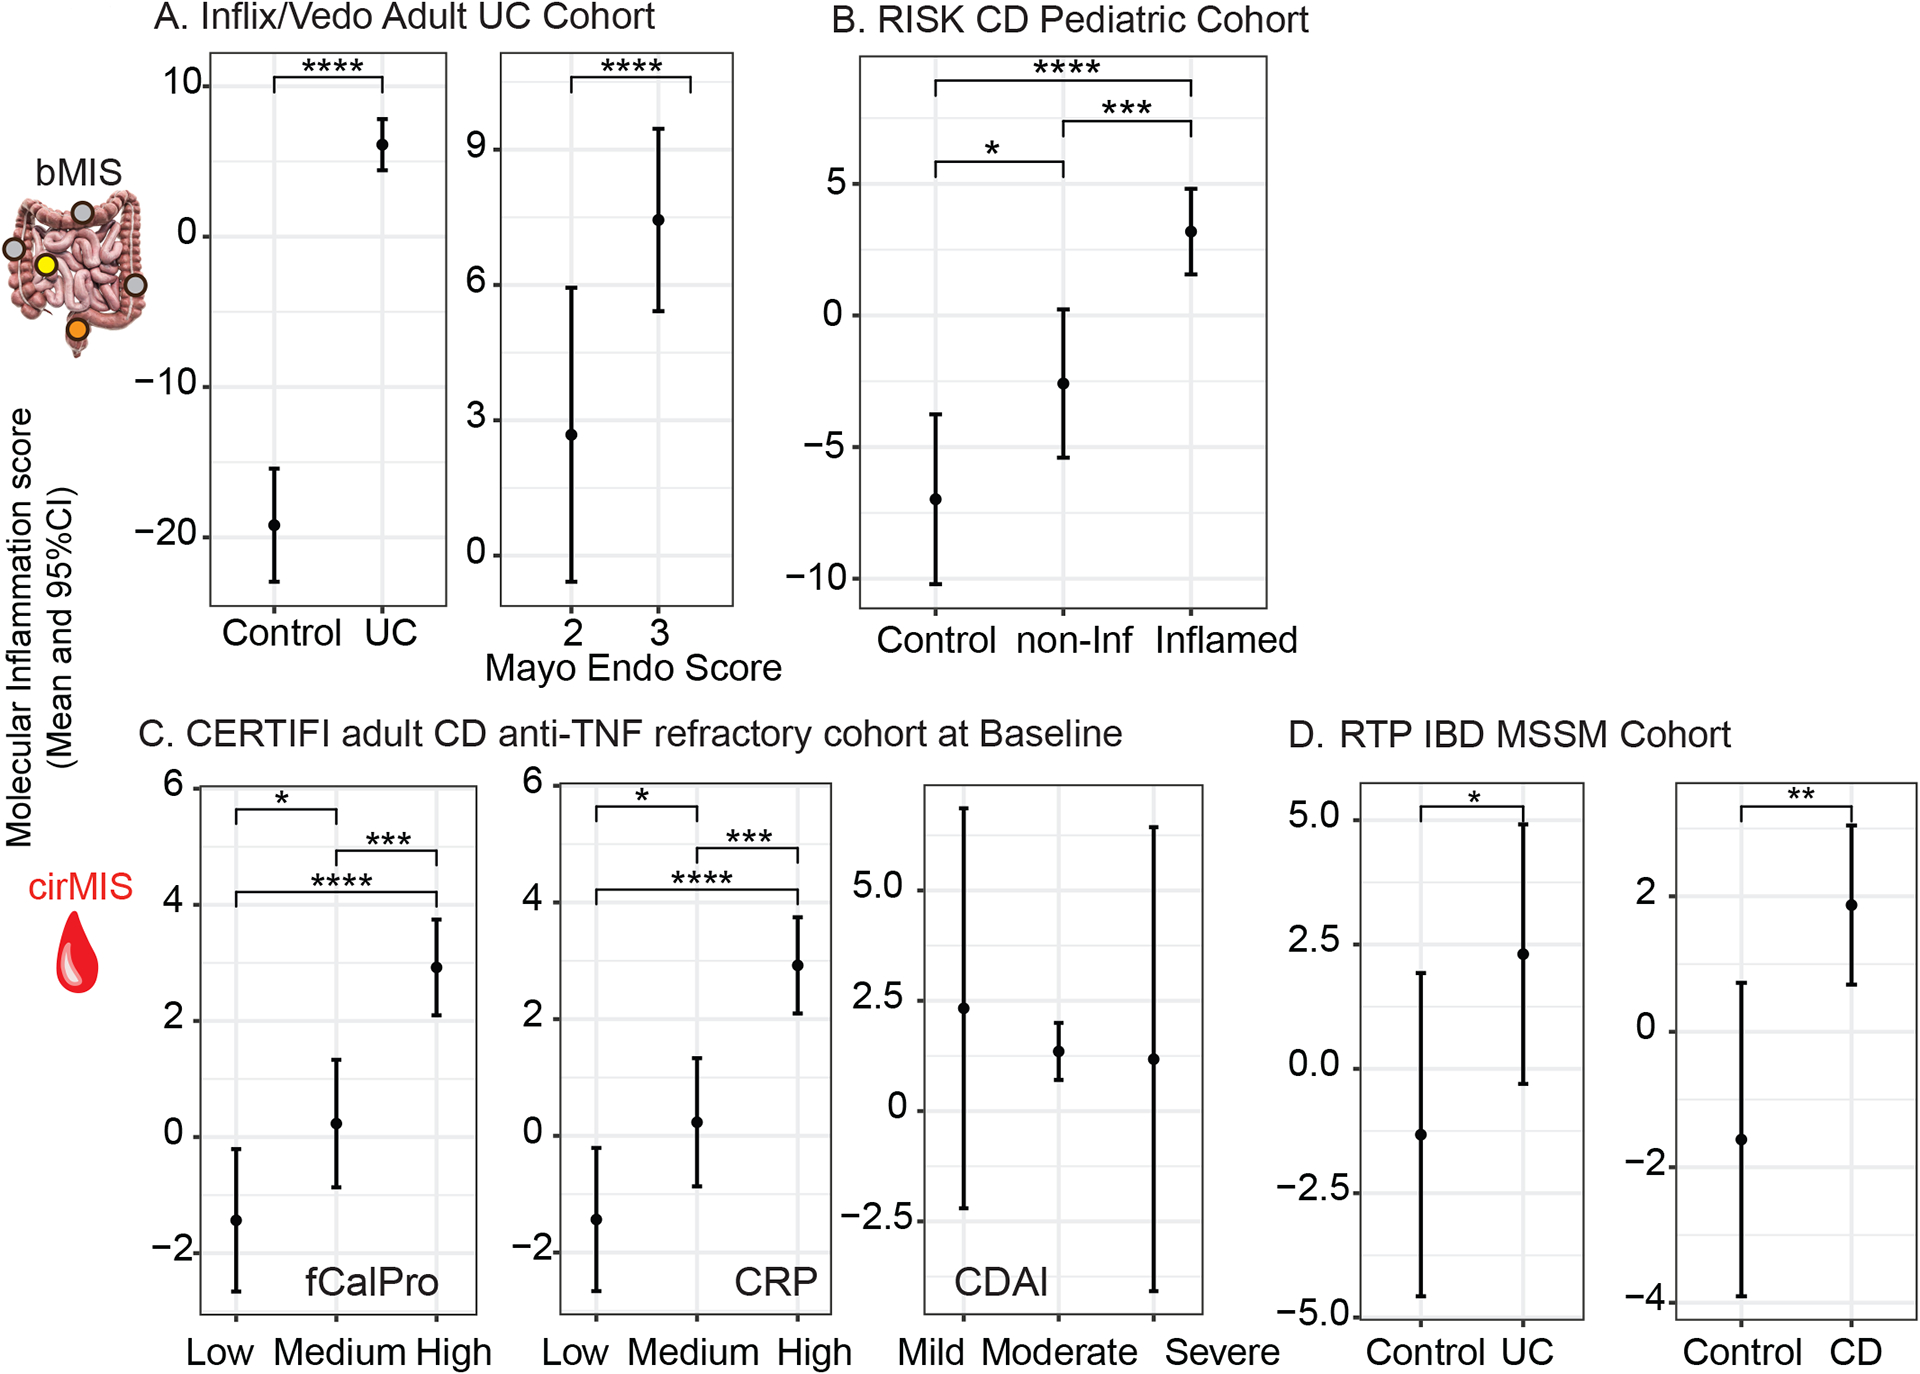
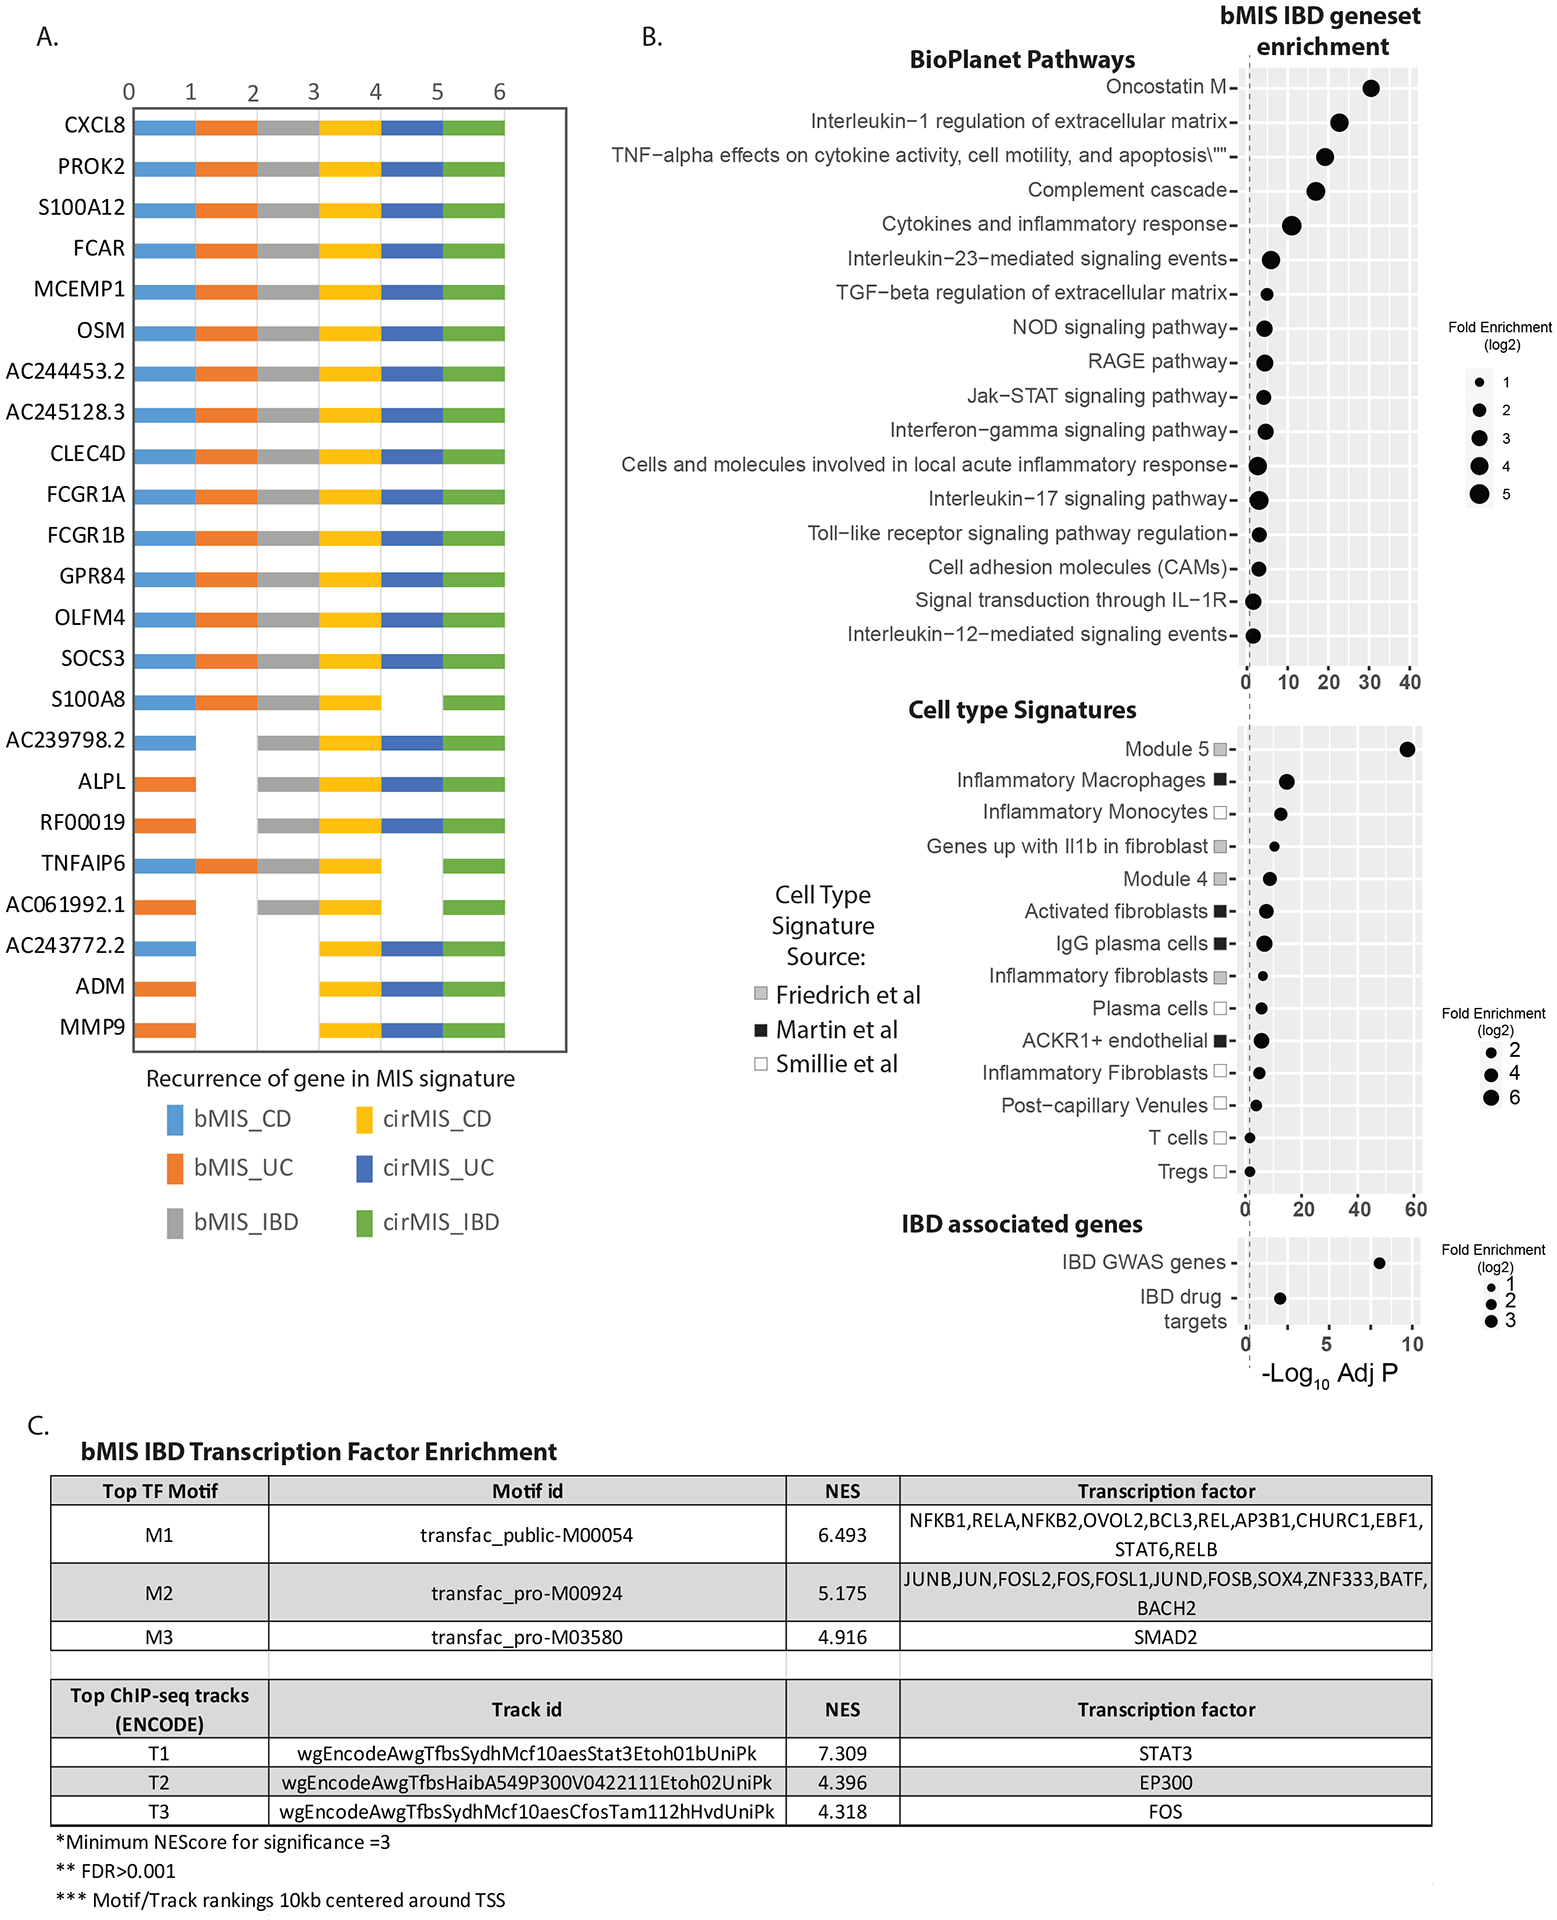
Design: Transcriptome analysis on 712 endoscopically defined inflamed (Inf) and 1778 non-inflamed (Non-Inf) intestinal biopsies (n=498 Crohn's disease, n=421 UC and 243 controls) in the Mount Sinai Crohn's and Colitis Registry were used to identify genes differentially expressed between Inf and Non-Inf biopsies and to generate a molecular inflammation score (bMIS) via gene set variance analysis. A circulating MIS (cirMIS) score, reflecting intestinal molecular inflammation, was generated using blood transcriptome data. bMIS/cirMIS was validated as indicators of intestinal inflammation in four independent IBD cohorts.

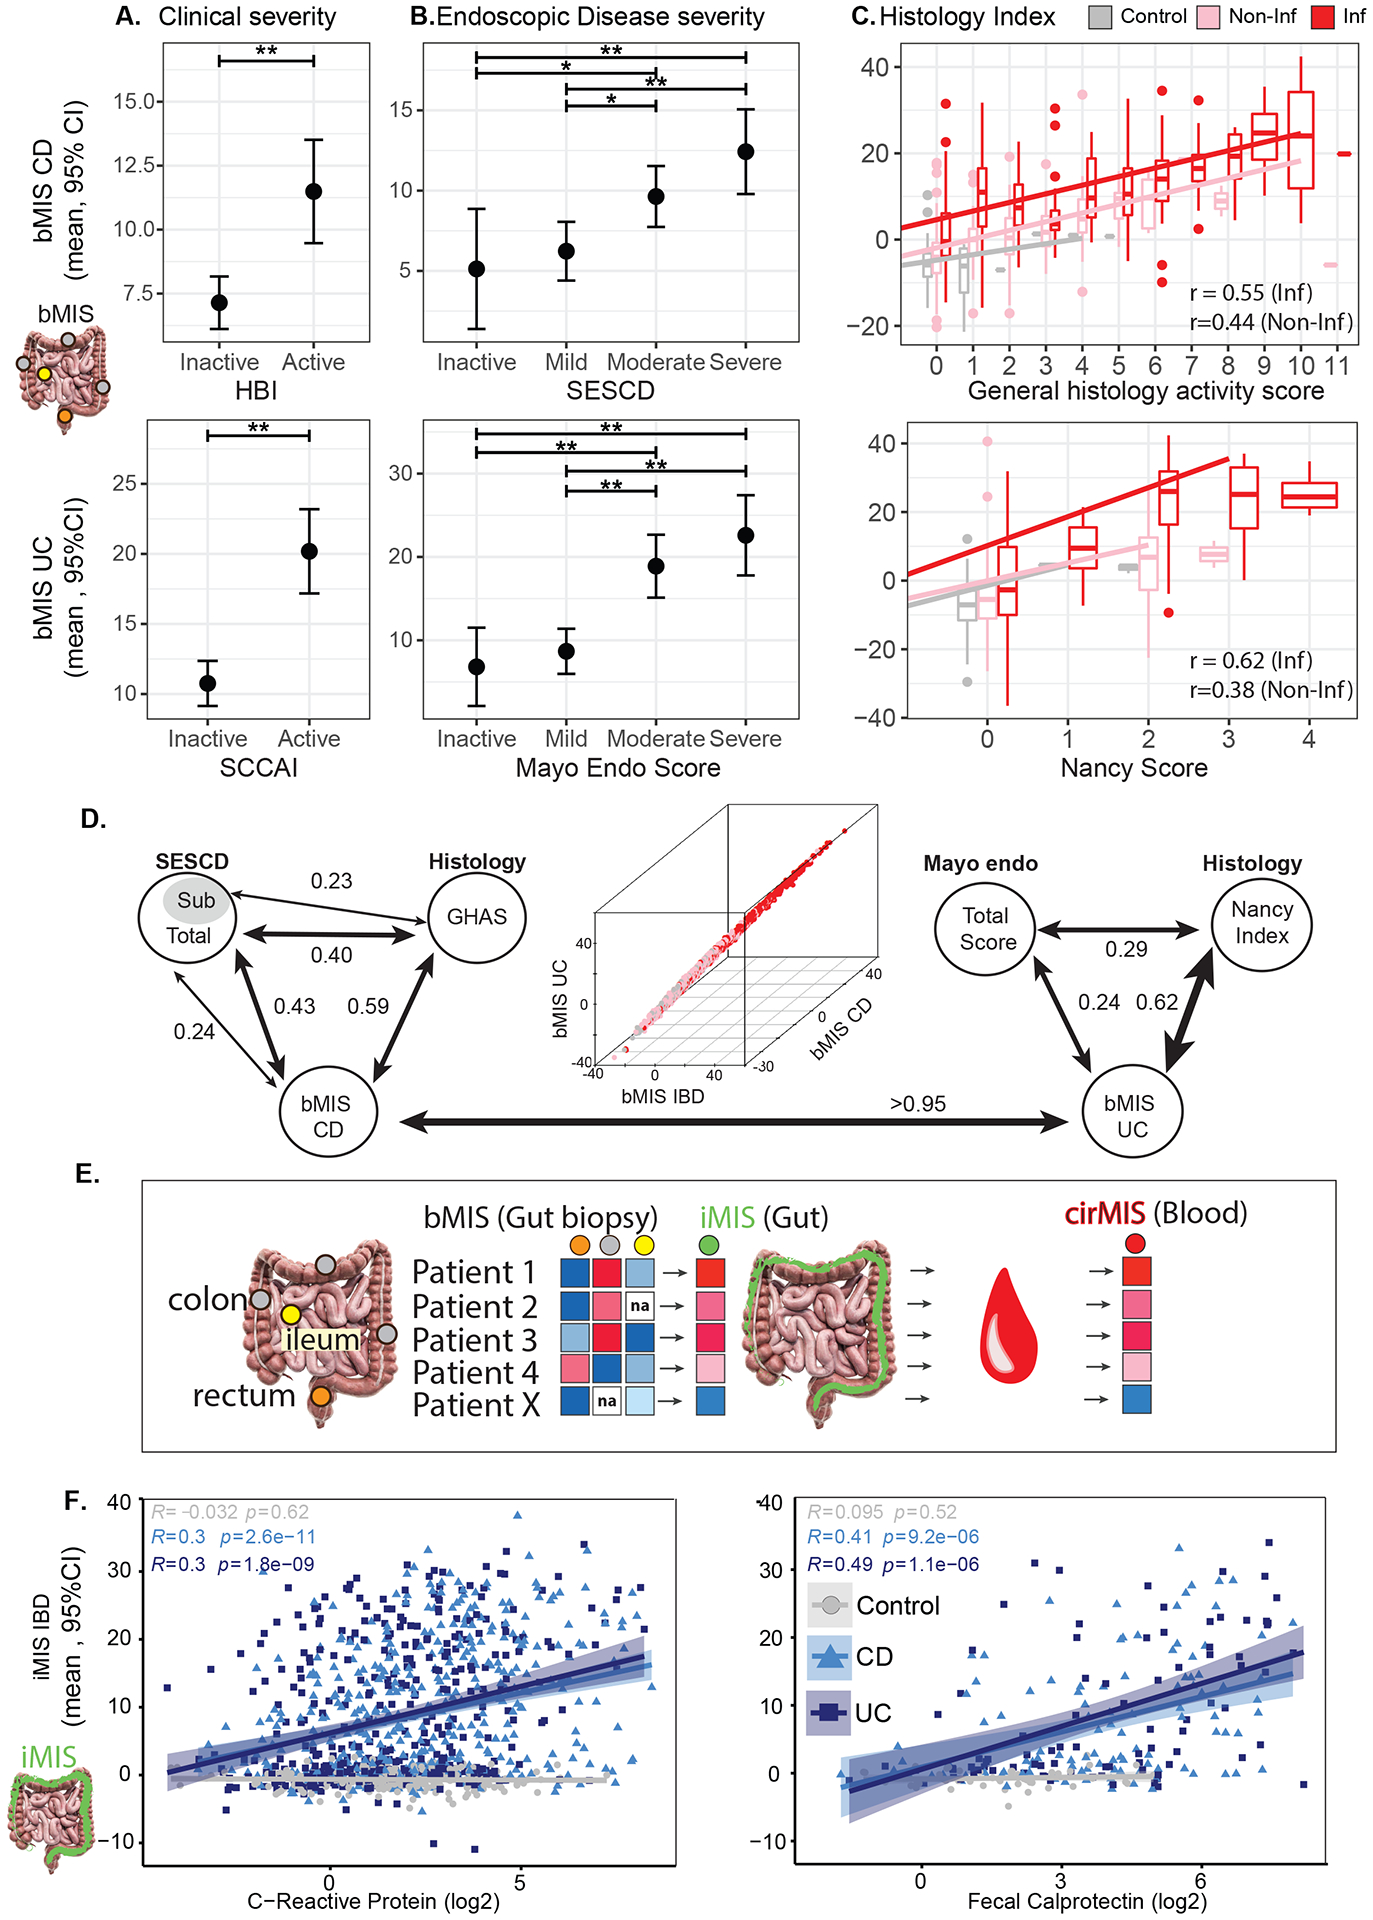
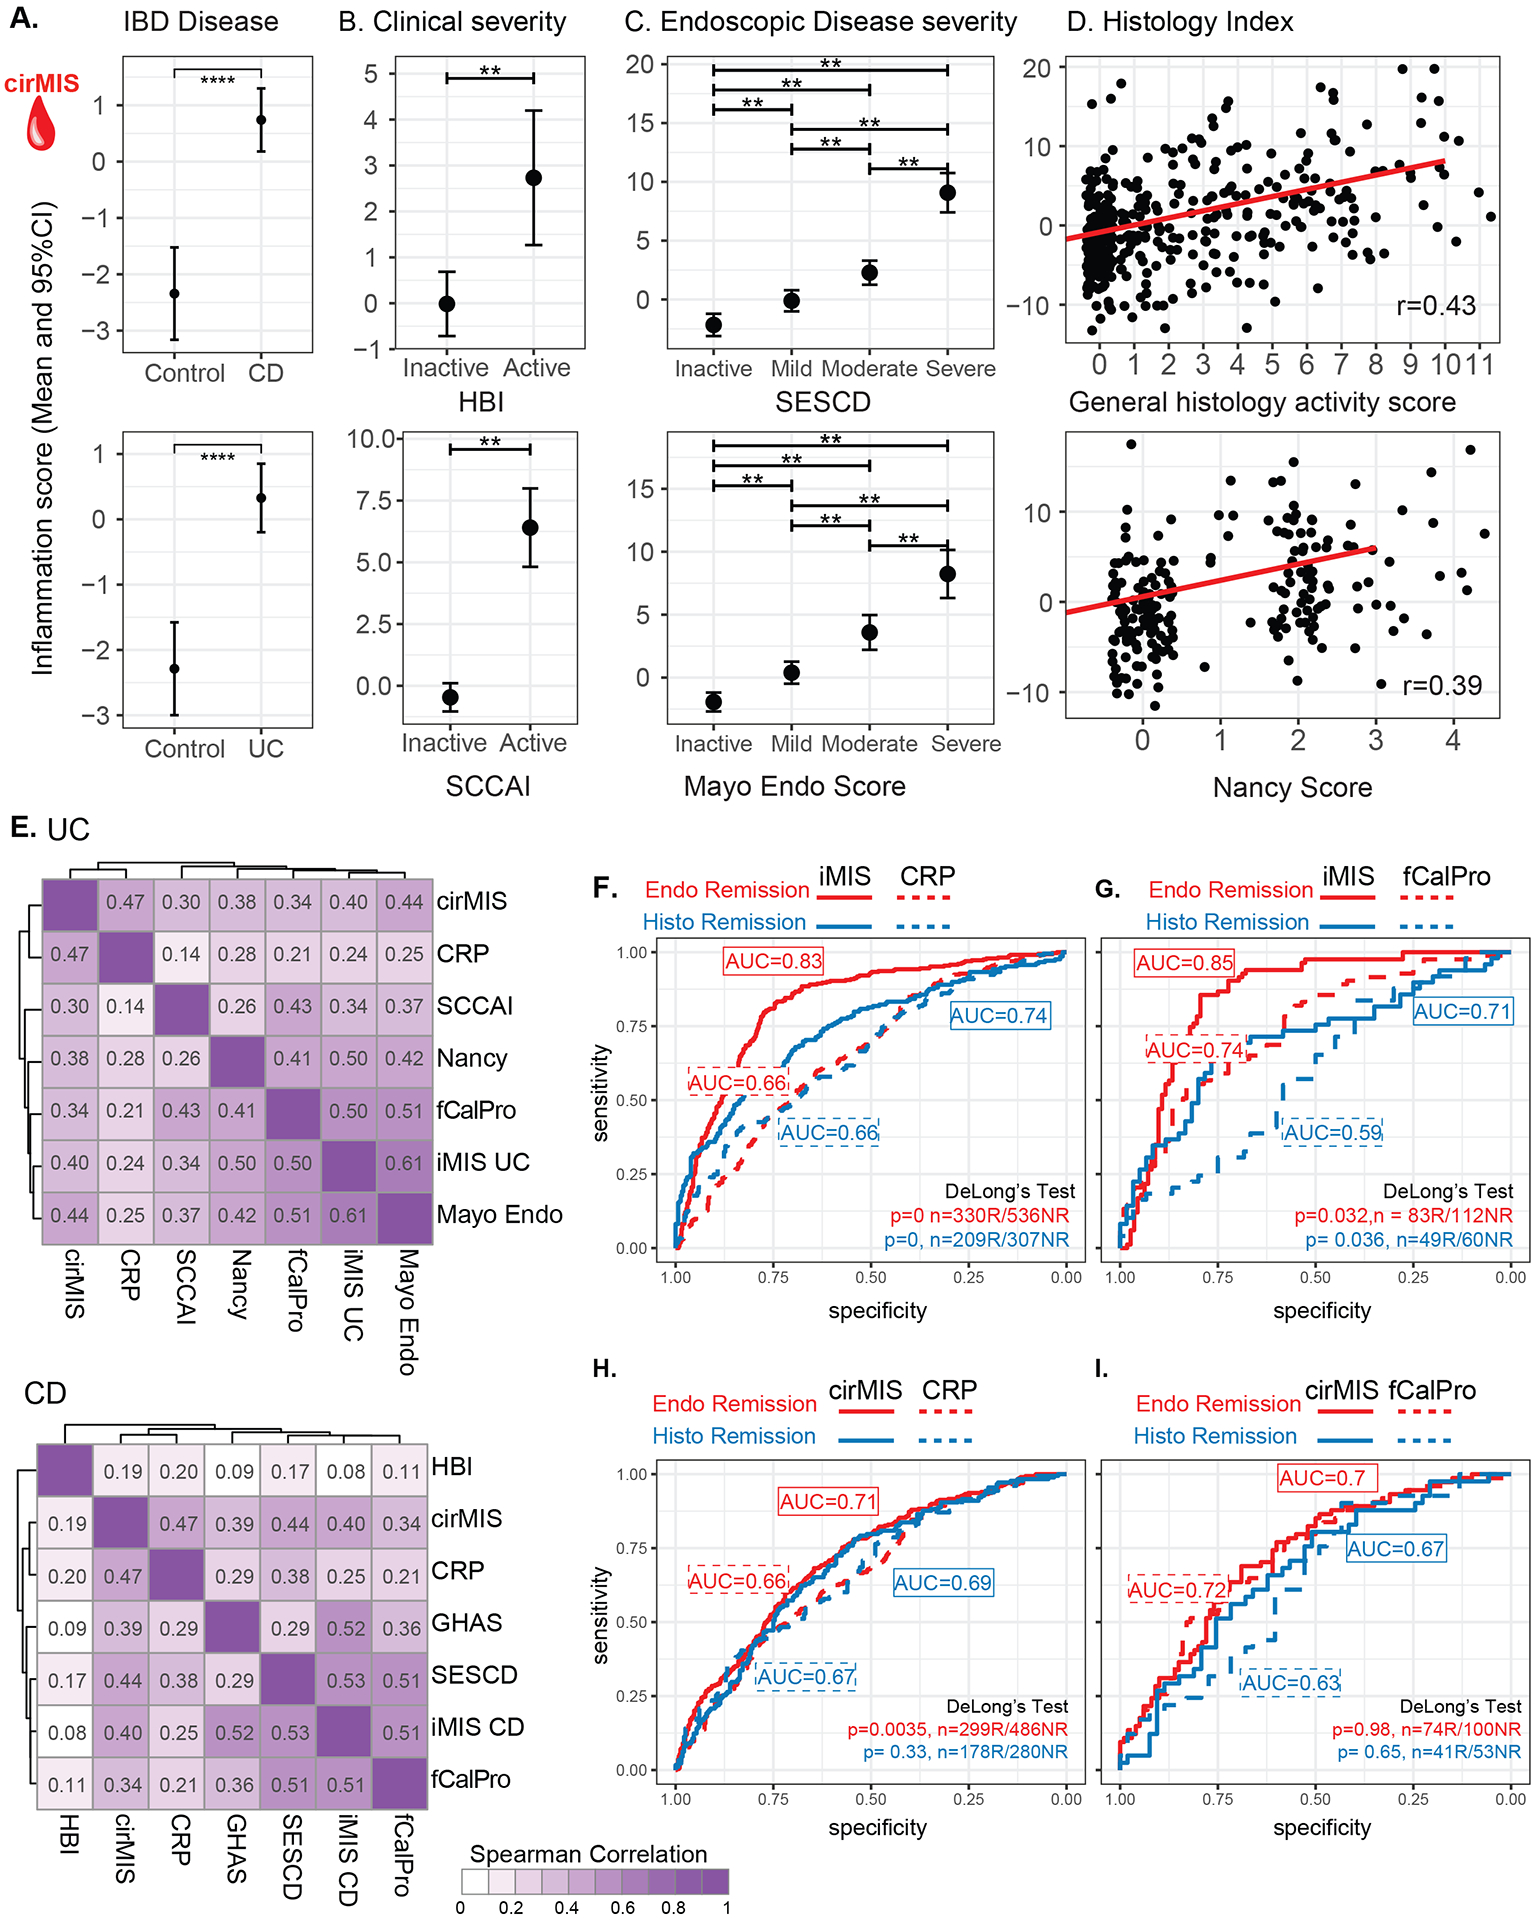
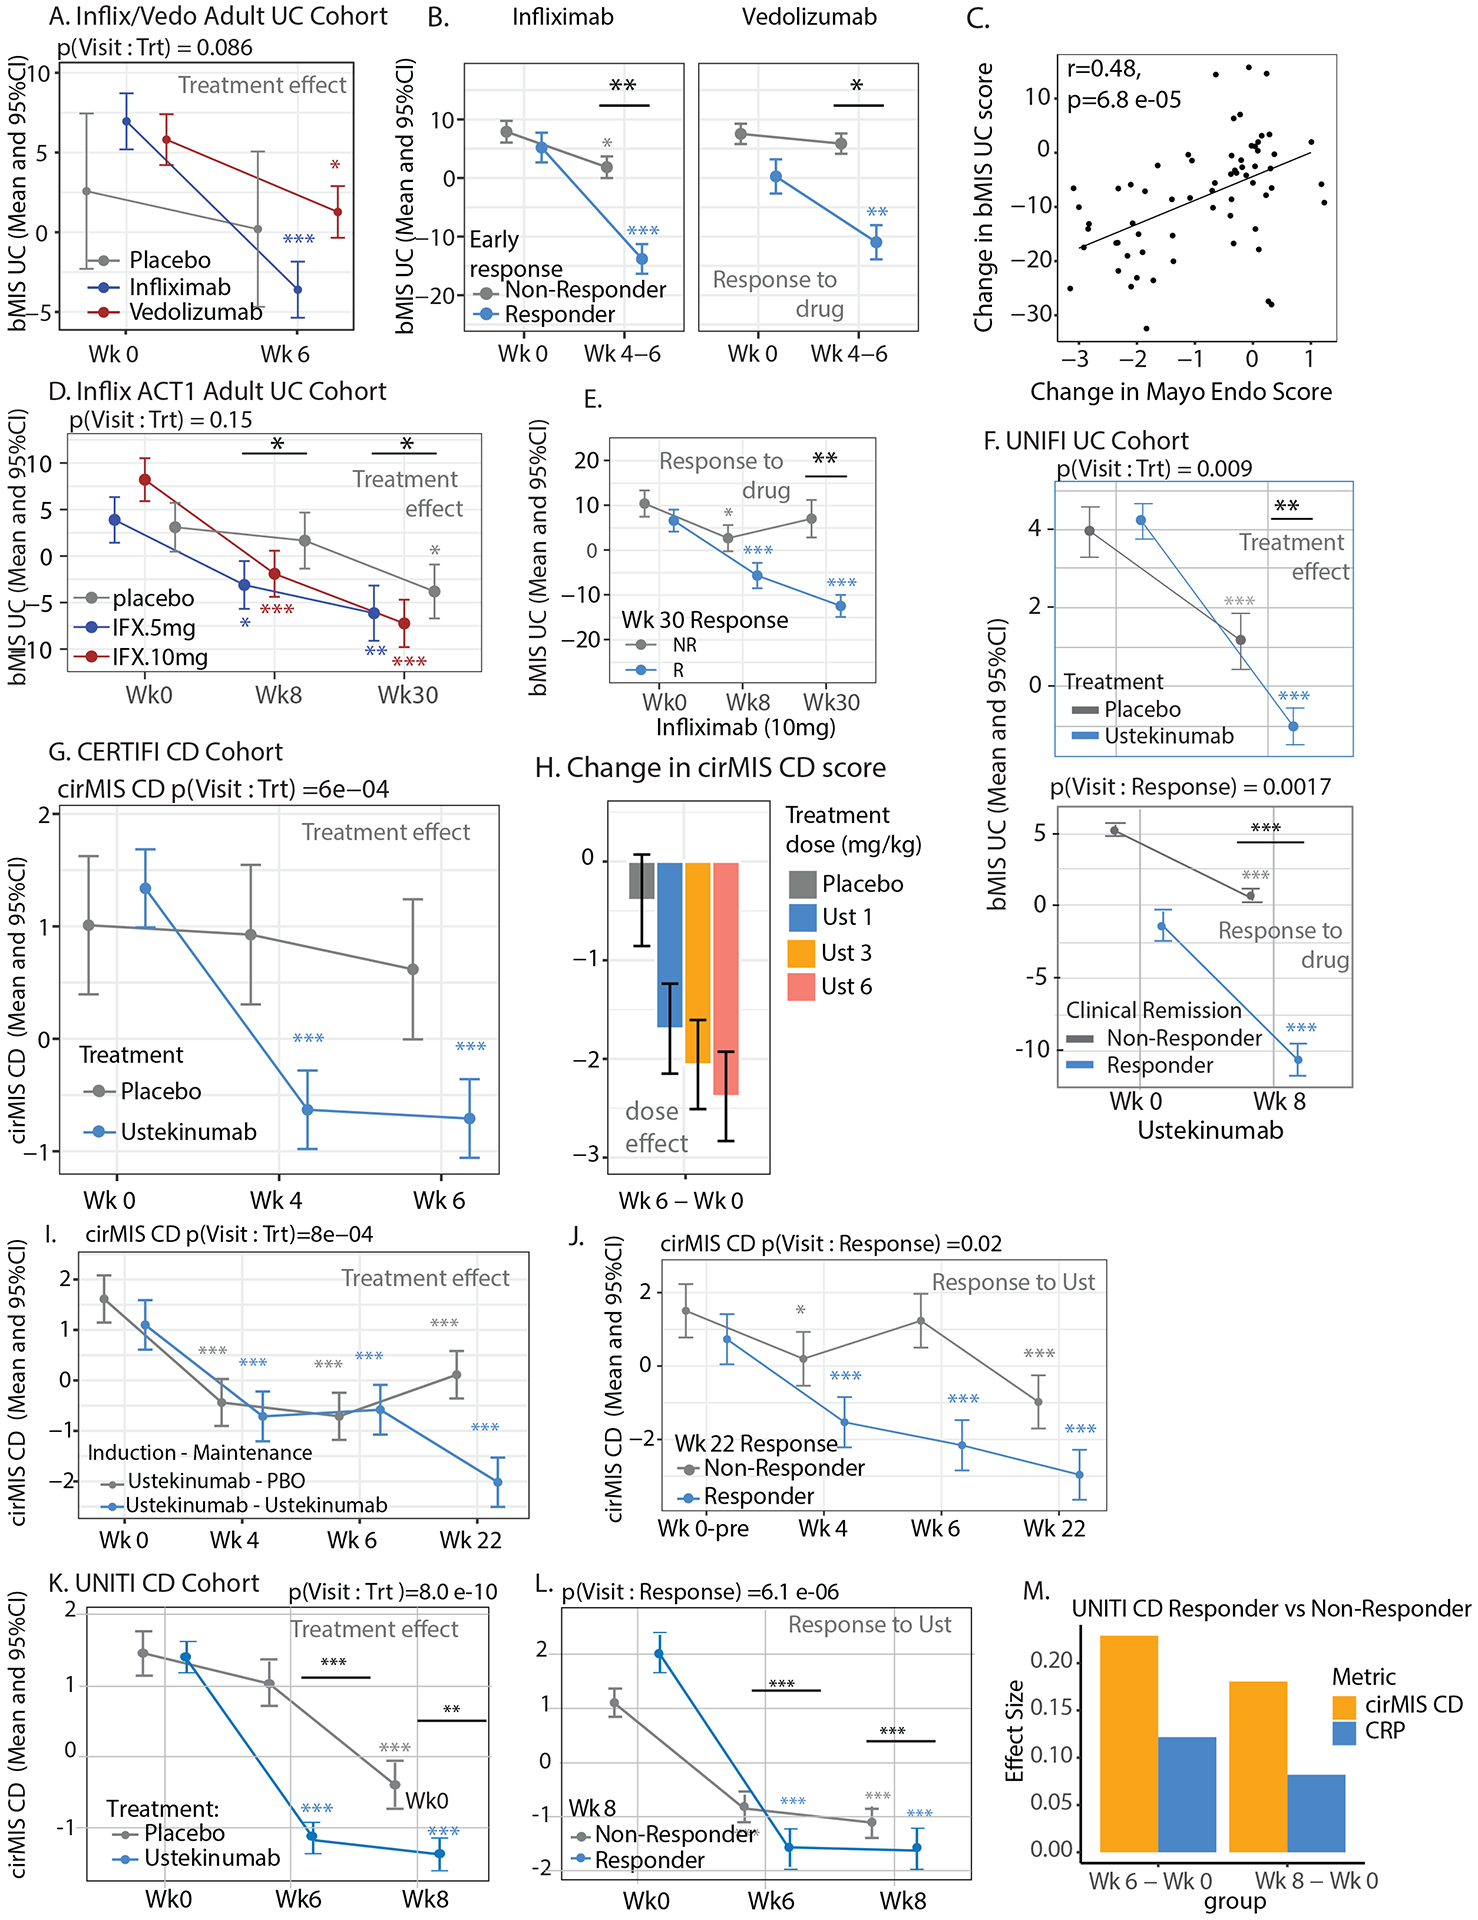
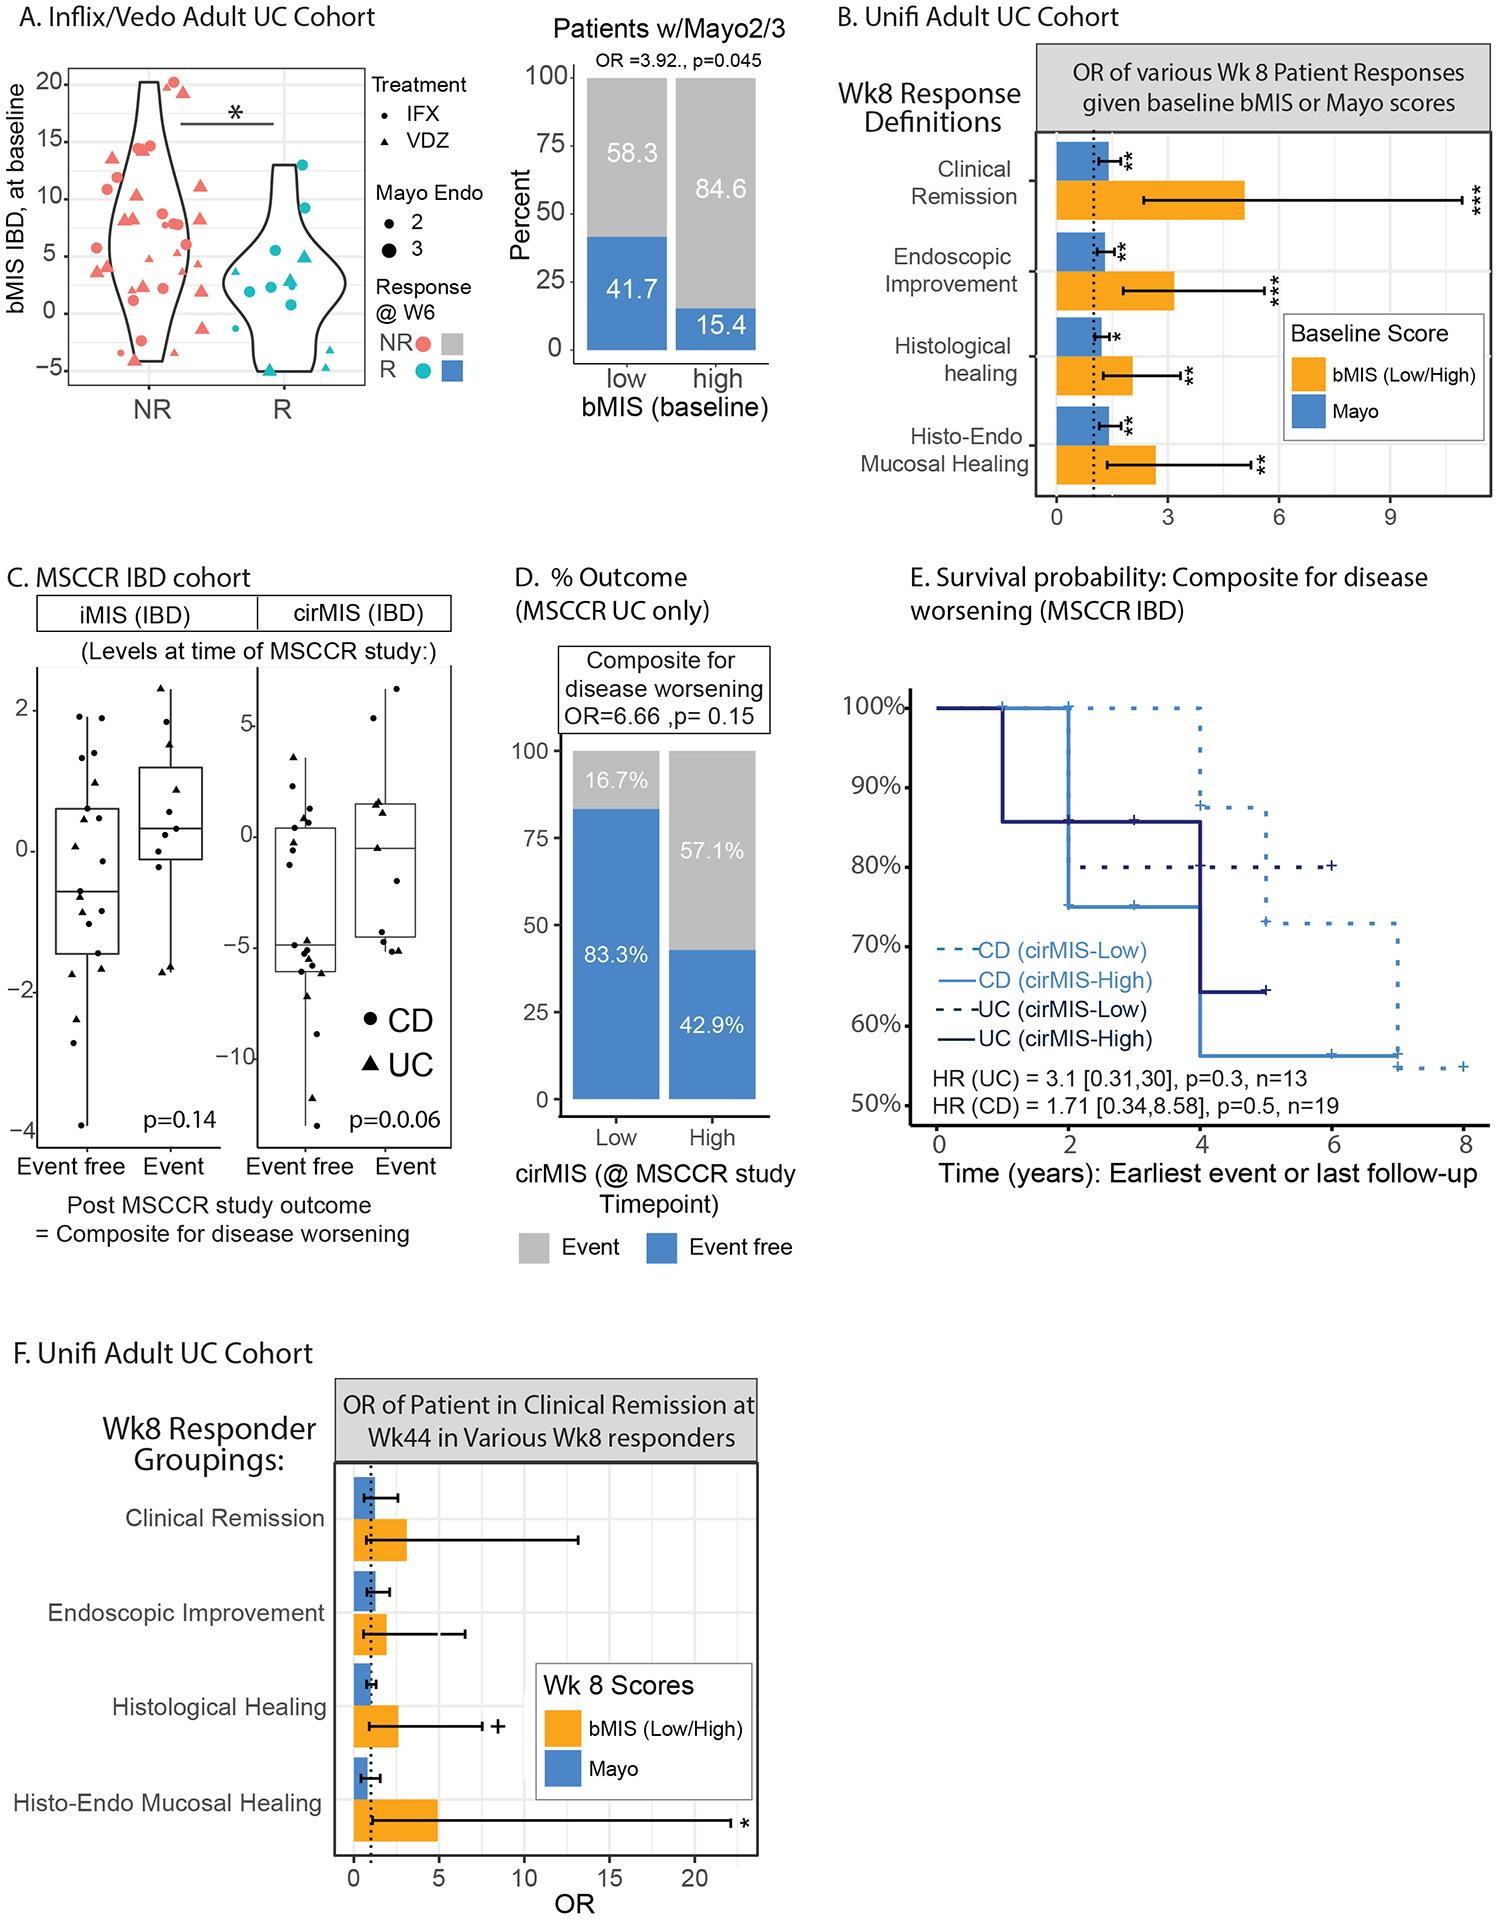
Results: bMIS/cirMIS was strongly associated with clinical, endoscopic and histological disease activity indices. Patients with the same histologic score of inflammation had variable bMIS scores, indicating that bMIS describes a deeper range of inflammation. In available clinical trial data sets, both scores were responsive to IBD treatment. Despite similar baseline endoscopic and histologic activity, UC patients with lower baseline bMIS levels were more likely treatment responders compared with those with higher levels. Finally, among patients with UC in endoscopic and histologic remission, those with lower bMIS levels were less likely to have a disease flare over time.

Conclusion: Transcriptionally based scores provide an alternative objective and deeper quantification of intestinal inflammation, which could augment current clinical assessments used for disease monitoring and have potential for predicting therapeutic response and patients at higher risk of disease flares.

Keywords: IBD; IBD CLINICAL; MOLECULAR MECHANISMS; MOLECULAR PATHOLOGY; STATISTICS.


Conflict of interest statement

Competing interests: Mount Sinai co-authors (from Genetics and Genomics, Icahn Institute for Data Science and Genomic Technology, Population Health Science and Policy, Division of Gastroenterology, Pediatric GI and Hepatology, Susan and Leonard Feinstein IBD Clinical Center at Icahn School of Medicine at Mount Sinai) were partially funded as part of research alliance between Janssen Biotech and The Icahn School of Medicine at Mount Sinai. SV, PTD, PB, AS, JP, CB, MC, EL-S and JW are employees at Janssen Biotech, Inc. Joshua R. Friedman is a former employee at Janssen Biotech, Inc. KH, MM, AK, AD and ES are employees at Sema4. BS, J-FC and MCD are consultants for Janssen. MCD is an advisory board member of Janssen.RCU has served as an advisory board member or consultant for AbbVie, Bristol Myers Squibb, Janssen, Pfizer, and Takeda; research support from AbbVie, Boehringer Ingelheim, Eli Lilly, and Pfizer.B.E.S. discloses the following: consulting fees from 4D Pharma, Abbvie, Allergan, Amgen, Arena Pharmaceuticals, AstraZeneca, Boehringer Ingelheim, Boston Pharmaceuticals, Capella Biosciences, Celgene, Celltrion Healthcare, EnGene, Ferring, Genentech, Gilead, Hoffmann-La Roche, Immunic, Ironwood Pharmaceuticals, Janssen, Lilly, Lyndra, MedImmune, Morphic Therapeutic, Oppilan Pharma, OSE Immunotherapeutics, Otsuka, Palatin Technologies, Pfizer, Progenity, Prometheus Laboratories, Redhill Biopharma, Rheos Medicines, Seres Therapeutics, Shire, Synergy Pharmaceuticals, Takeda, Target PharmaSolutions, Theravance Biopharma R&D, TiGenix, and Vivelix Pharmaceuticals; honoraria for speaking in CME programs from Takeda, Janssen, Lilly, Gilead, Pfizer, and Genetech; and research funding from Celgene, Pfizer, Takeda, Theravance Biopharma R&D, and Janssen.M.C.D. discloses consulting fees from Abbvie, Allergan, Amgen, Arena Pharmaceuticals, AstraZeneca, Boehringer Ingelheim, Celgene, Ferring, Genentech, Gilead, Hoffmann-La Roche, Janssen, Pfizer, Prometheus Biosciences, Takeda, and Target PharmaSolutions and research funding from Abbvie, Janssen, Pfizer, and Prometheus Biosciences Takeda.J-F.C. reports: receiving research grants from AbbVie, Janssen Pharmaceuticals, and Takeda; receiving payment for lectures from AbbVie, Amgen, Allergan, Inc., Ferring Pharmaceuticals, Shire, and Takeda; receiving consulting fees from AbbVie, Amgen, Arena Pharmaceuticals, Boehringer Ingelheim, Bristol Myers Squibb, Celgene Corporation, Eli Lilly, Ferring Pharmaceuticals, Galmed Research, Glaxo Smith Kline, Geneva, Iterative Scopes, Janssen Pharmaceuticals, Kaleido Biosciences, Landos, Otsuka, Pfizer, Prometheus, Sanofi, Takeda, and TiGenix; and holding stock options in Intestinal Biotech Development.S.M. has received investigator-initiated grant funding from Takeda Pharma and Genentech and has served as consultant or paid speaker for Takeda Pharma, Genentech, Morphic, and Glaxo Smith Kline. RCU supported by an NIH K23 Career Development Award (K23KD111995-01A1). CA, LP, PHC, GW and ES were supported in part by The Leona M. and Harry B. Helmsley Charitable Trust and LP, ES, CA and PHC also by an RC2 DK122532/DK/NIDDK NIH.

Figures

Figure 1.
Figure 1.
A. Schematic of analysis plan B. PCA of biopsy expression data for the MSCCR cohort by colonic region, endoscopically defined inflamed (Inf) or non-inflamed (NonI) tissue and by disease subtype (UC/CD and non-IBD controls). C. Heatmap representing the expression levels of the set of bMIS genes (UC, CD or IBD) in IBD patient or non-IBD control biopsies and labeled by region, disease type and inflammation status. D. Venn Diagrams showing the number of differentially expressed genes for bMIS IBD, bMIS UC and bMIS CD signatures. E. Estimated marginal mean (EMM) and 95% CI for bMIS_IBD levels by intestinal region, inflammation status and disease subtype (HC = healthy controls).
Figure 2.
Figure 2.
Association of bMIS in inflamed tissue with (A) Clinical (HBI for CD patients, SCCAI for UC patients), (B) Endoscopic (SESCD for CD patients, Mayo score for UC patients) and (C) Histological (GHAS for CD patients, Nancy score for UC patients) disease severity for CD (top) and UC (bottom). A-B Estimated marginal mean (EMM) and 95% CI for bMIS estimated from a mixed-effect model including clinical activity or disease severity, age, sex and region as fixed-effects. C. Scatter plots representing the distribution of bMIS across histological scores for CD and UC with corresponding regression line. The pink and red line corresponds to the regression line for inflamed and non-inflamed tissue. (GHAS (top): Inflamed tissue, bMIS=2.619 + 1.997*GHAS, Pearson r: 0.55; Non-inflamed tissue, bMIS = −3.926+2.018*GHAS, Pearson r: 0.44; Nancy (bottom): Inflamed tissue: bMIS=1.74+8.457*Nancy, Pearson r: 0.62; Non-inflamed tissue: bMIS= −5.269+5.216*Nancy, Pearson r: 0.38). *: p<0.05; **: p<0.01; ***: p<0.001; ****: p<0.0001. D. Pair-wise correlation analysis (Spearman values) between bMIS scores in biopsies and corresponding endoscopic and histologic scores for CD (left) or UC (right) in MSCCR patients. 3D plot showing correlations (Spearman) between bMIS_UC, bMIS_CD and bMIS_IBD. E. Schema showing the process of obtaining an intestine-level molecular-based inflammation measure (iMIS) per patient using the multiple regions sampled per patient and their bMIS (biopsy-based) scores (see methods). The blood gene expression data was then modeled using a linear model with the continuous variable iMIS (see methods) to identify genes that reflects intestinal inflammation and then generate a circulating molecular score (cirMIS) using GSVA. F. Scatterplots between iMIS_IBD levels and CRP (log2) (left) or fecal calprotectin (log2) (right) within each group (Control, CD, and UC), with Pearson’s correlation coefficients r and p value.
Figure 3.
Figure 3.
Association of cirMIS with IBD Disease (A) as well as Clinical (B) Endoscopic (C) and Histological assessements (D). A-C. Estimated marginal mean (EMM) and 95% CI for cirMIS from a mixed-effect model including IBD disease status (A) or clinical disease severity (B) or endoscopic disease severity (C), age, sex and genetic PCs as a fixed-effects. D. Scatter plots representing the distribution of cirMIS across histological scores, maximum GHAS for CD and maximum Nancy score for UC. The red line corresponds to the regression line (Max GHAS (top): cirMIS = −1.756+0.901*GHAS, Pearson r: 0.43; Max Nancy (bottom) cirMIS = −1.21+1.802*Nancy, Pearson r: 0.39). E. Heatmaps showing the Spearman correlations between iMIS and cirMIS with molecular (CRP and fecal calprotectin [fCalPro]), endoscopic (HBI for CD and Mayo for UC), histological (GHAS for CD and Nancy for UC), and clinical markers (SESCD for CD and SCCAI for UC) of UC (upper) and CD (lower). F-I Comparison of iMIS and cirMIS with CRP and fecal calprotectin (fCalPro) to classify endoscopic remission (SESCD<3 in CD patients or Mayo endo score=0 in UC patients) and histological remission (GHAS score=0 in CD patients or Nancy score =0 in UC patients). F-I. Delong’s method was used to compare AUCs. *: p<0.05; **: p<0.01; ***: p<0.001; ****: p<0.0001.
Figure 4.
Figure 4.
Validation of bMIS/cirMIS in independent IBD cohorts. A. Line plots showing bMIS_UC can differentiate between control and UC disease status and associate with Mayo endoscopic scores in colonic biopsies from GEMINI-I/LTS trial and anti-TNF UC participants. B. Line plots showing bMIS_CD could differentiate between control, non-inflamed ileum and inflamed ileum biopsies form the RISK pediatric CD Cohort. C. Line plots showing cirMIS_CD associates with fecal calprotectin (fCalPro) and CRP, but not CDAI in the CERTIFI CD cohort. D. Line plots showing cirMIS_UC and cirMIS_CD can differentiate between control and UC or CD disease status in the RTP-IBD MSSM cohort. (A-D) Each plot represents the estimated marginal mean and 95% CI through a linear mixed-effect model on the baseline data. *: p<0.05; **: p<0.01; ***: p<0.001; ****: p<0.0001
Figure 5:
Figure 5:
Molecular scores of inflammation and IBD treatment effects and response. A. Change in bMIS_UC levels from week 0 to week 6 in placebo, IFX, and VDZ groups in colonic biopsies from GEMINI-I/LTS trial and anti-TNF UC participants. The linear mixed-effect model included visit, treatment and, its interaction as fixed effects, and random intercept for each subject. B. Change in bMIS_UC levels from week 0 to week 4–6 in responders and non-responders within the IFX and VDZ medication groups in colonic biopsies. Patients with induction treatment as infliximab or VDZ were analyzed. Linear mixed-effect model with a three-way interaction visit, treatment and week 6 or week 4–6 status as fixed effects, and random intercept for each subject. Response to therapy was defined as endoscopic mucosal healing (Mayo endo score 0–1). C. Correlation between changes in Mayo endo scores and bMIS_UC scores between week 0 to week 4–6, week 6, or week 52 in GEMINI-I/LTS trial and anti-TNF UC participants. D. bMIS_UC scores in colonic biopsies from ACT1 UC trial participants at various timepoints treated with either 5 or 10mg/kg of IFX. The linear mixed-effect model included visit, treatment and, its interaction as fixed effects, and random intercept for each subject. E. bMIS_UC levels from week 0 to week 4 and 30 in week 30 responders and non-responders within the infliximab 10mg/kg groups in colonic biopsies from ACT1 UC trial participants. Patients with induction treatment as infliximab and maintenance were studied. Linear mixed-effect model was used. Clinical response was defined as a decrease from baseline in the total Mayo score (of at least three points). F. bMIS_UC levels from week 0 to week 8 in placebo and UST groups in colonic biopsies from UNIFI UC trial participants (upper panel). The linear mixed-effect model included visit, treatment and, its interaction as fixed effects, and random intercept for each subject. Change in bMIS_UC levels from week 0 to week 8 in responders and non-responders within the UST medication groups in colonic biopsies from UNIFI trial participants (lower panel). Patients with induction treatment as UST were analyzed. Response to therapy was clinical remission (defined as a total score of ⩽ 2 on the Mayo scale and no subscore >1). G-H. Changes in cirMIS_CD levels during the induction phase (from week 0 to 6) differentiate placebo from UST treated CERTIFI CD patients and (G) exhibit a dose response to UST (1, 3 and 6 mg/kg) (H). I. Changes in cirMIS_CD levels at weeks 0, 4 and 6 (induction phase) and during maintenance treatment starting week 6 in CERTIFI CD patients with UST induction treatment and UST or placebo as maintenance treatment. Plots represent the EMM ± SEM estimated through a linear mixed-effect model with visit, treatment combination and, its interaction as fixed effects, and random intercept for each subject. J. cirMIS_CD levels at week 0, 4, 6 and 22 in week 22 responders and non-responders in CERTIFI CD patients that received UST during induction and maintenance phases. EMM and ± SEM from a linear mixed-effect model with visit, response status at week 22 and its interaction as fixed effects, and random intercept for each subject. Clinical response was defined as a decrease of 100 or more in CDAI score from baseline at week 22. K. Changes in cirMIS_CD levels during the induction phase (from week 0 to 8) differentiate placebo from UST treated UNITI CD patients as well as responders compared to non-responders. L. Response (at week 8) was defined as clinical remission (CDAI score < 150 points). M. Effect size of the delta between either week 6 and baseline or week 8 and baseline for either cirMIS_CD or CRP levels as determined in responders versus non-responders. *: p < 0.05; **: p < 0.01; ***: p < 0.001; ****: p < 0.0001 Black line/asterisk represent significance of the delta between a timepoint and baseline for treated vs placebo group.
Figure 6.
Figure 6.
Residual molecular inflammation and clinical outcomes. A. Baseline bMIS_IBD levels in patients from the GEMINI-I/LTS UC and anti-TNF treated patients according to response to therapy (endoscopic mucosal healing (Mayo endoscopic score 0–1) as assessed for VDZ at W6 and for IFX at W4–6) (left panel). The proportion of patients that were considered responders to therapy in the baseline high vs low bMIS group (right panel). B. UNIFI adult UC cohort and the odd’s ratio of having a response, according to various definitions from clinical remission, endoscopic improvement, histological healing and combined histo-endoscopic mucosal healing (see methods) at week 8 of therapy (UST) in baseline high vs low cirMIS group’s (based on median levels) or according to baseline Total Mayo score. An additive model was used. C. A subset of MSCCR patients were identified that were in endoscopic and histological remission at the time of the MSCCR study (called MSCCR endo-histo-remission) see methods). These patients were then categorized as having high or low cirMIS levels based on the tertiles of expression and their post-MSCCR outcomes considered as a composite score to reflect disease worsening were reviewed in their charts. The levels of bMIS_IBD and cirMIS_IBD of the MSCCR endo-histo-remission patient subsets were generally higher in those patients that subsequently had a disease worsening event post-MSCCR study. For the composite score of events reflecting disease worsening, 1 of 6 MSCCR UC patients with low cirMIS had an event while 4 out of 7 patients with a high cirMIS had an event (D). For the CD MSCCR endo-histo-remission patients, the proportion of patients that were event free was the same between high and low cirMIS levels (SF3B). However, Kaplan-Maier survival curves (E) show that patients with higher cirMIS levels, were more likely to have a disease worsening event recorded earlier than compared to the low cirMIS group (in either UC or CD subsets). Specifically, the Cox models reported that for UC patients, the hazard ratio is 3.1 times higher [0.31,30, p=0.3] than the low cirMIS group, and in CD patients, the hazard ratio was 1.71 (0.34,8.58, p=0.5] times higher than the low cirMIS group. (G). UNIFI adult UC cohort and the odd’s ratio of being in response at week 44 (outcome = clinical remission) in patients considered responders at week 8 according to various definitions from clinical remission (n=33), endoscopic improvement (44), histological healing (65) and HEMH (34) (see methods), based on their baseline high vs low cirMIS status, versus their week 8 Total Mayo score. An additive model was used. +: p<0.1; *: p < 0.05; **: p < 0.01; ***: p < 0.001.
Figure 7.
Figure 7.
(A.) Summary of the genes according to recurrence in the various molecular inflammation score genesets. (B). Dotpots showing selected top significantly enrichments of the bMIS_IBD geneset in i) Bioplant pathways ii) Cell type signatures (see methods) iii) IBD GWAS genes and curated known IBD drug targets. Summary of the magnitude (log 2 Fold enrichment) and significance level (negative log10 BH adjusted P value) are shown. (C). Transcription factor enrichment analysis of the promoters of the bMIS_IBD geneset. The iRegulon application within Cytoscape was used to assess the promoters (10kb centered around transcription start site) of genes within the bMIS_geneset for enrichment in either transcription factor motifs or ChIP-seq tracks from ENCODE. Normalized enrichment scores (NES) of >3 considered significant with FDR >0.001. The top 3 scoring motifs or tracks, and their associated transcription factors are shown.

Comment in

References

    1. Kobayashi T et al. Ulcerative colitis. Nature Reviews Disease Primers 6, 74 (2020). - PubMed
    1. Roda G et al. Crohn’s disease. Nature Reviews Disease Primers 6, 22 (2020). - PubMed
    1. Ungaro R, Colombel JF, Lissoos T & Peyrin-Biroulet L A Treat-to-Target Update in Ulcerative Colitis: A Systematic Review. Am J Gastroenterol (2019). - PMC - PubMed
    1. Peyrin-Biroulet L et al. Selecting Therapeutic Targets in Inflammatory Bowel Disease (STRIDE): Determining Therapeutic Goals for Treat-to-Target. Am J Gastroenterol 110, 1324–38 (2015). - PubMed
    1. Le Berre C, Peyrin-Biroulet L & group S.-I.s. Selecting End Points for Disease-Modification Trials in Inflammatory Bowel Disease: the SPIRIT Consensus From the IOIBD. Gastroenterology 160, 1452–1460 e21 (2021). - PubMed

Publication types