

In Vivo Prenylomic Profiling in the Brain of a Transgenic Mouse Model of Alzheimer's Disease Reveals Increased Prenylation of a Key Set of Proteins
- PMID: 36109170
- PMCID: PMC9799064
- DOI: 10.1021/acschembio.2c00486
In Vivo Prenylomic Profiling in the Brain of a Transgenic Mouse Model of Alzheimer's Disease Reveals Increased Prenylation of a Key Set of Proteins
Abstract
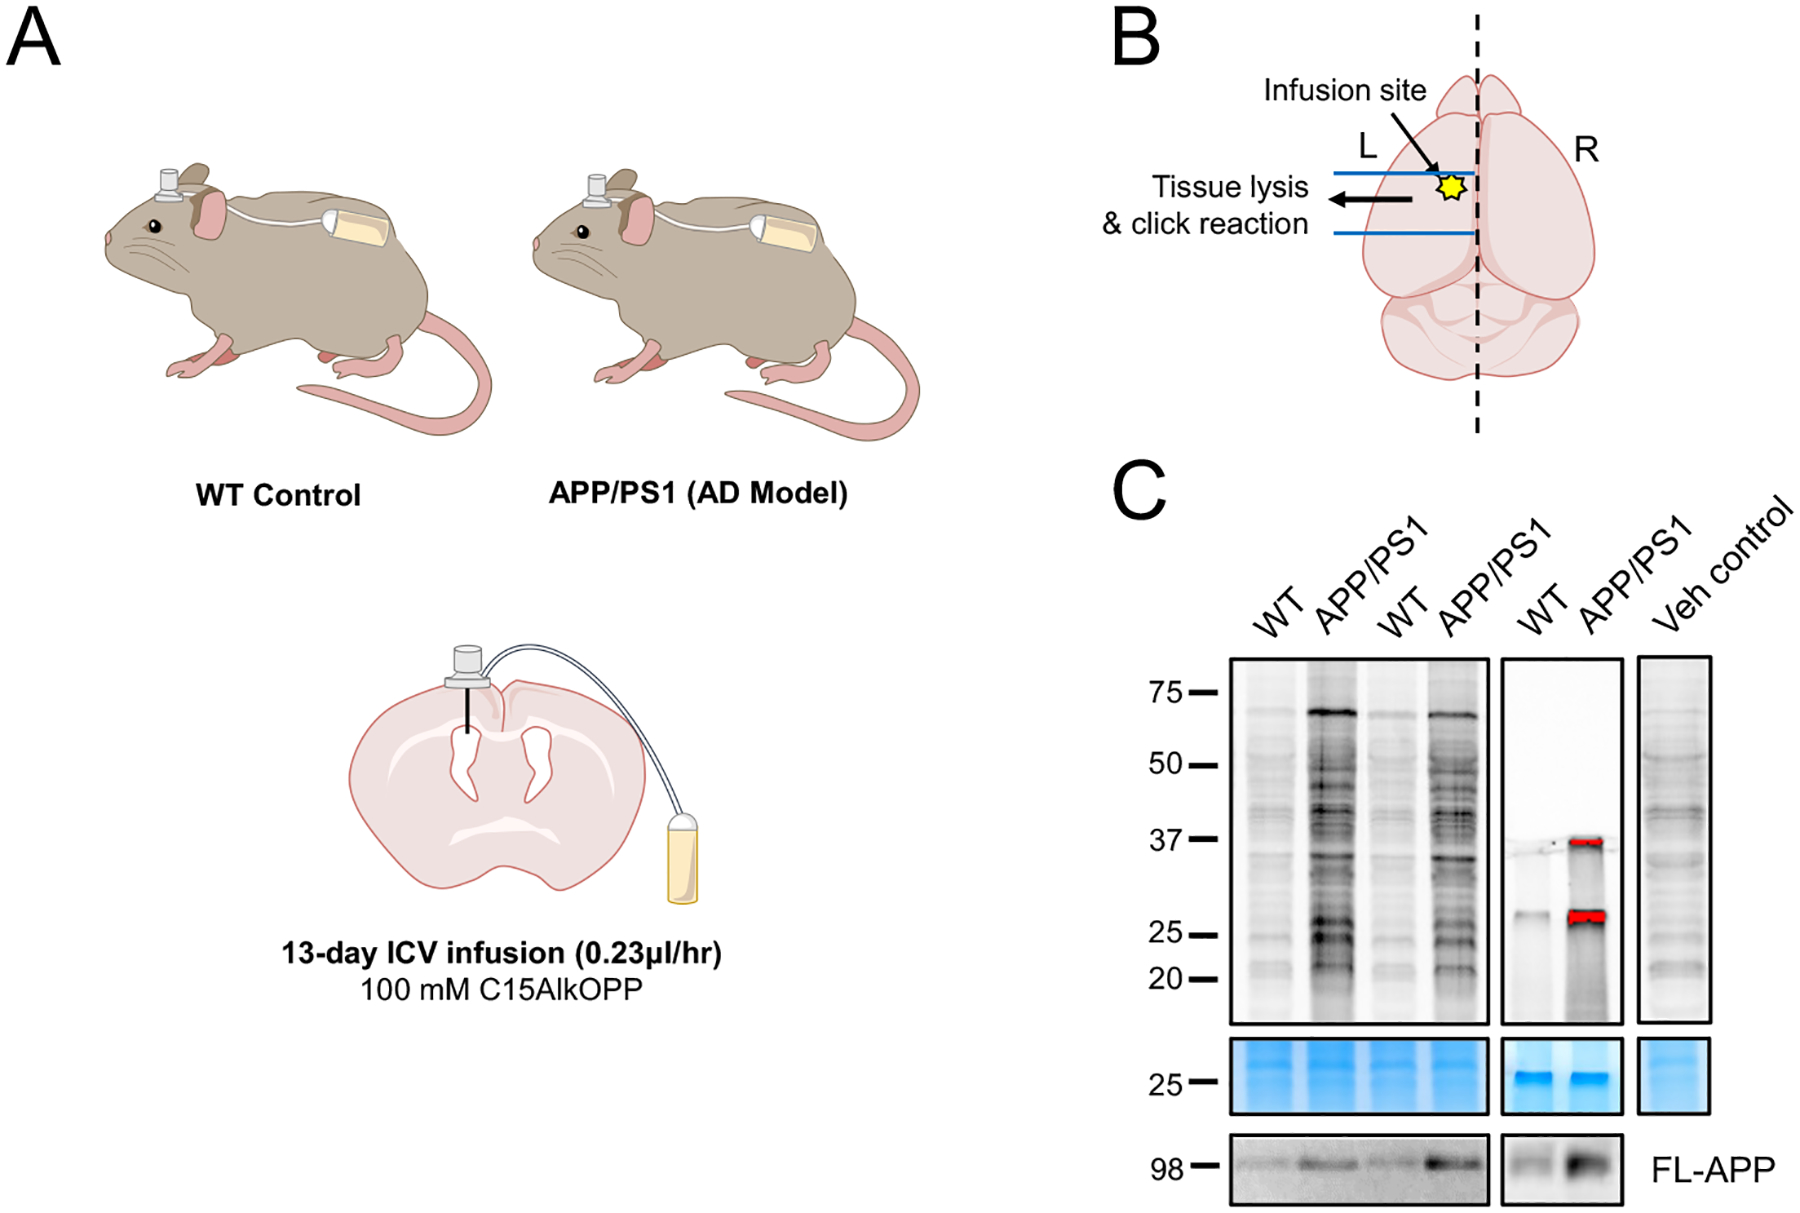
Dysregulation of protein prenylation has been implicated in many diseases, including Alzheimer's disease (AD). Prenylomic analysis, the combination of metabolic incorporation of an isoprenoid analogue (C15AlkOPP) into prenylated proteins with a bottom-up proteomic analysis, has allowed the identification of prenylated proteins in various cellular models. Here, transgenic AD mice were administered with C15AlkOPP through intracerebroventricular (ICV) infusion over 13 days. Using prenylomic analysis, 36 prenylated proteins were enriched in the brains of AD mice. Importantly, the prenylated forms of 15 proteins were consistently upregulated in AD mice compared to nontransgenic wild-type controls. These results highlight the power of this in vivo metabolic labeling approach to identify multiple post-translationally modified proteins that may serve as potential therapeutic targets for a disease that has proved refractory to treatment thus far. Moreover, this method should be applicable to many other types of protein modifications, significantly broadening its scope.
Conflict of interest statement
Competing interests
None
Figures


Similar articles
-
An Alkyne-Containing Isoprenoid Analogue Based on a Farnesyl Diphosphate Scaffold Is a Biologically Functional Universal Probe for Proteomic Analysis.Biochemistry. 2025 Jan 7;64(1):138-155. doi: 10.1021/acs.biochem.4c00558. Epub 2024 Dec 9. Biochemistry. 2025. PMID: 39652878
-
Isoprenoids and protein prenylation: implications in the pathogenesis and therapeutic intervention of Alzheimer's disease.Crit Rev Biochem Mol Biol. 2018 Jun;53(3):279-310. doi: 10.1080/10409238.2018.1458070. Crit Rev Biochem Mol Biol. 2018. PMID: 29718780 Free PMC article. Review.
-
Improved synthesis and application of an alkyne-functionalized isoprenoid analogue to study the prenylomes of motor neurons, astrocytes and their stem cell progenitors.Bioorg Chem. 2024 Jun;147:107365. doi: 10.1016/j.bioorg.2024.107365. Epub 2024 Apr 16. Bioorg Chem. 2024. PMID: 38636436 Free PMC article.
-
Metabolic labeling with an alkyne probe reveals similarities and differences in the prenylomes of several brain-derived cell lines and primary cells.Sci Rep. 2021 Feb 23;11(1):4367. doi: 10.1038/s41598-021-83666-3. Sci Rep. 2021. PMID: 33623102 Free PMC article.
-
Isoprenoids and Alzheimer's disease: a complex relationship.Neurobiol Dis. 2006 May;22(2):209-22. doi: 10.1016/j.nbd.2005.11.007. Epub 2006 Jan 10. Neurobiol Dis. 2006. PMID: 16406223 Review.
Cited by
-
Evaluating protein prenylation of human and viral CaaX sequences using a humanized yeast system.Dis Model Mech. 2024 May 1;17(5):dmm050516. doi: 10.1242/dmm.050516. Epub 2024 May 31. Dis Model Mech. 2024. PMID: 38818856 Free PMC article.
-
Updates on protein-prenylation and associated inherited retinopathies.Front Ophthalmol (Lausanne). 2024 Jul 4;4:1410874. doi: 10.3389/fopht.2024.1410874. eCollection 2024. Front Ophthalmol (Lausanne). 2024. PMID: 39026984 Free PMC article. Review.
-
Photoredox-catalyzed diastereoselective dearomative prenylation and reverse-prenylation of electron-deficient indole derivatives.Nat Commun. 2023 Jun 30;14(1):3876. doi: 10.1038/s41467-023-39633-9. Nat Commun. 2023. PMID: 37391418 Free PMC article.
-
A Humanized Yeast System for Evaluating the Protein Prenylation of a Wide Range of Human and Viral CaaX Sequences.bioRxiv [Preprint]. 2023 Sep 20:2023.09.19.558494. doi: 10.1101/2023.09.19.558494. bioRxiv. 2023. Update in: Dis Model Mech. 2024 May 1;17(5):dmm050516. doi: 10.1242/dmm.050516. PMID: 37786692 Free PMC article. Updated. Preprint.
-
An Alkyne-Containing Isoprenoid Analogue Based on a Farnesyl Diphosphate Scaffold Is a Biologically Functional Universal Probe for Proteomic Analysis.Biochemistry. 2025 Jan 7;64(1):138-155. doi: 10.1021/acs.biochem.4c00558. Epub 2024 Dec 9. Biochemistry. 2025. PMID: 39652878
References
Publication types
MeSH terms
Substances
Grants and funding
LinkOut - more resources
Full Text Sources
Medical
Molecular Biology Databases
