. 2022 Sep 15;13(1):5415.
doi: 10.1038/s41467-022-32905-w.

Sirtuin 6 inhibition protects against glucocorticoid-induced skeletal muscle atrophy by regulating IGF/PI3K/AKT signaling

Affiliations

Sirtuin 6 inhibition protects against glucocorticoid-induced skeletal muscle atrophy by regulating IGF/PI3K/AKT signaling

Sneha Mishra et al. Nat Commun. .

Abstract

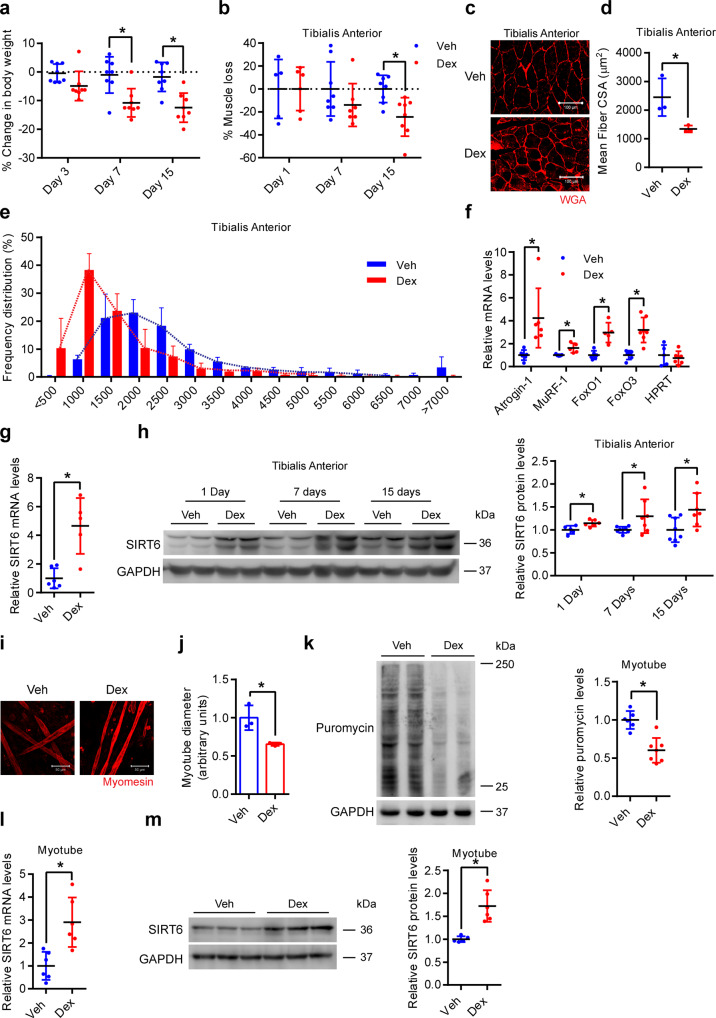
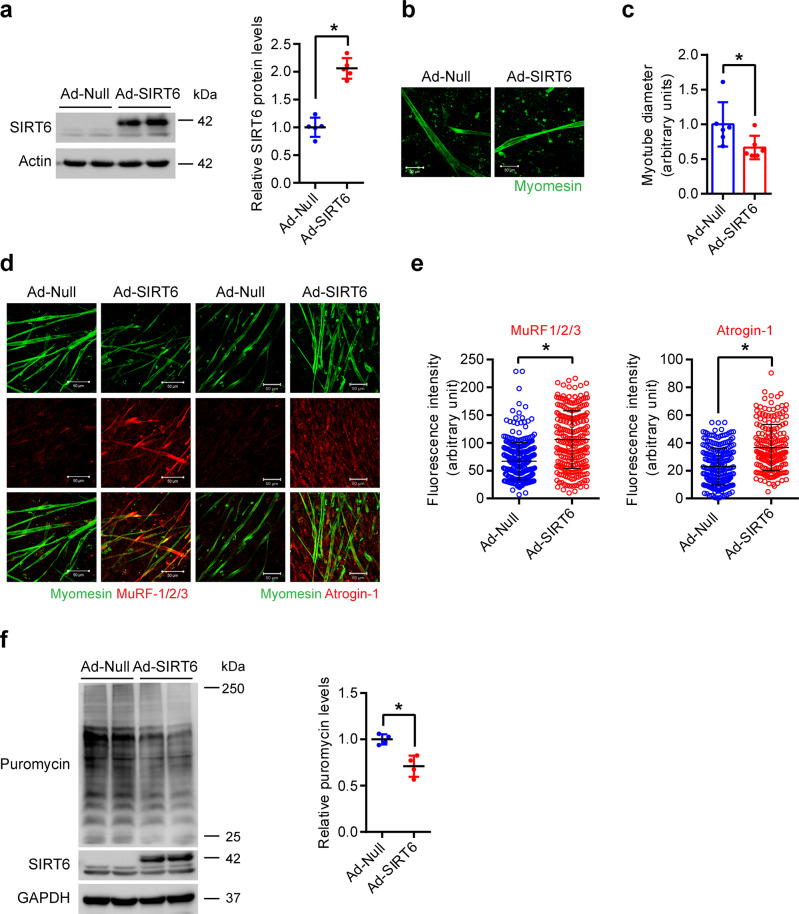
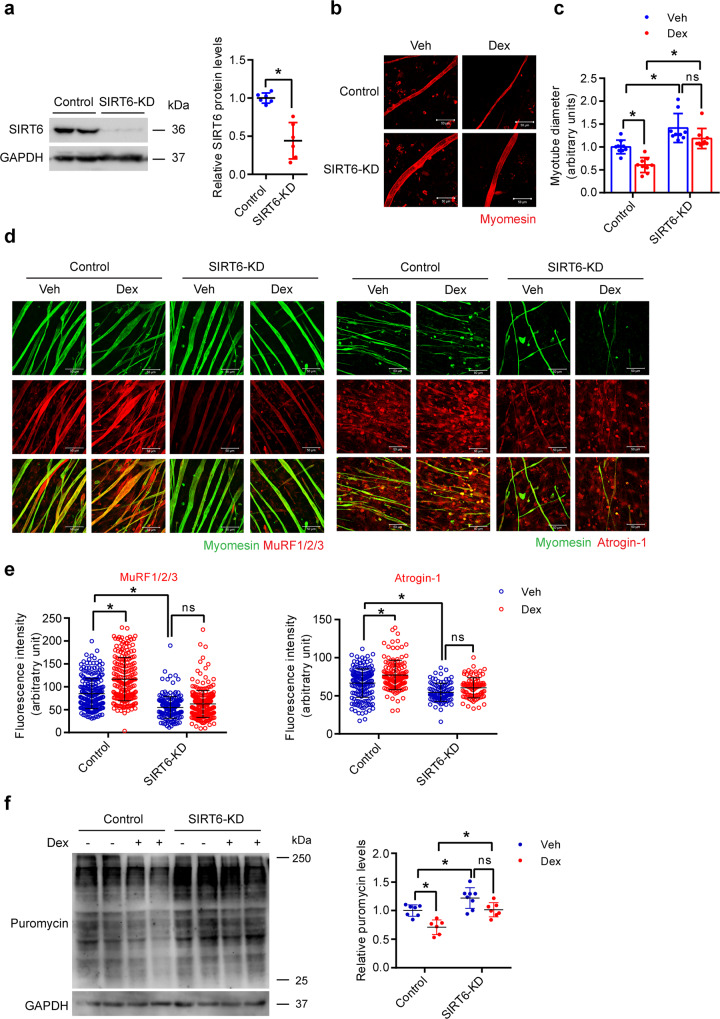
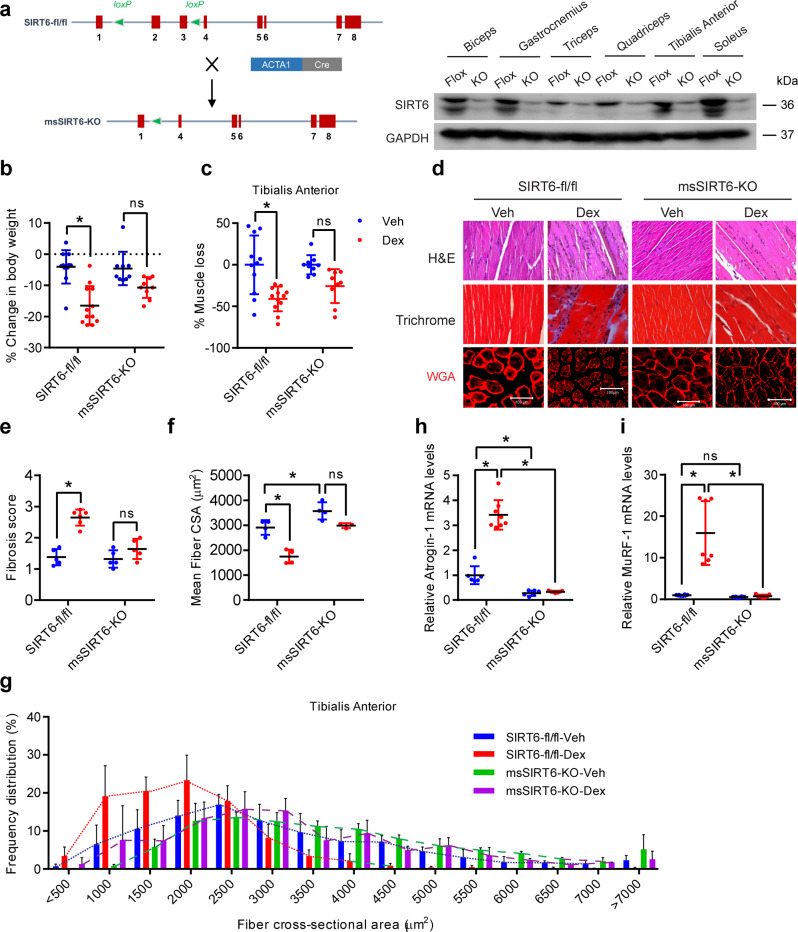
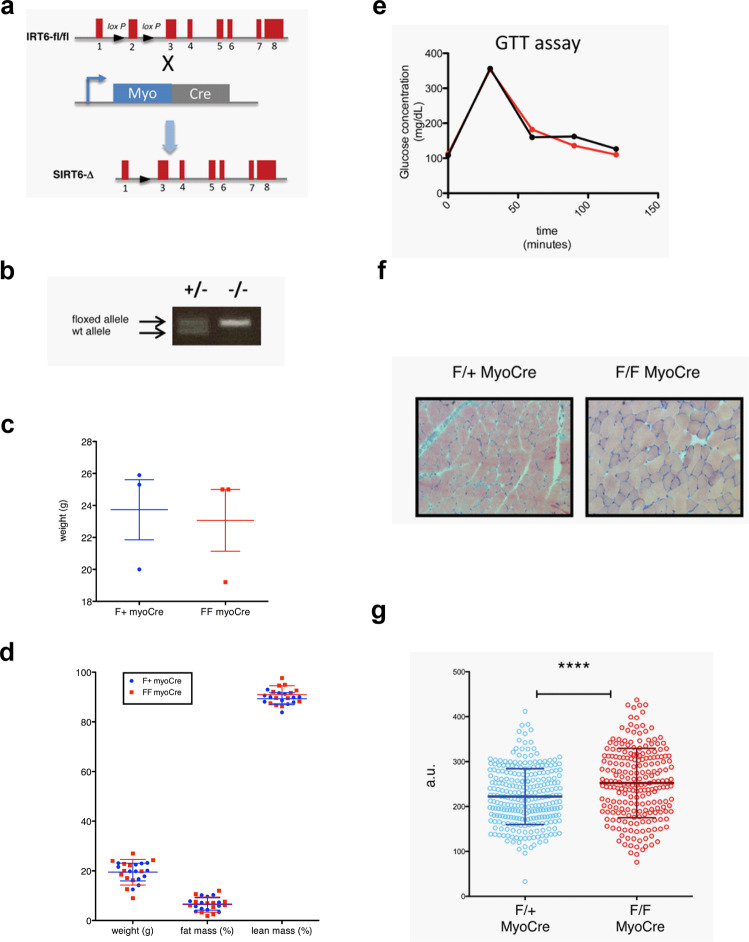
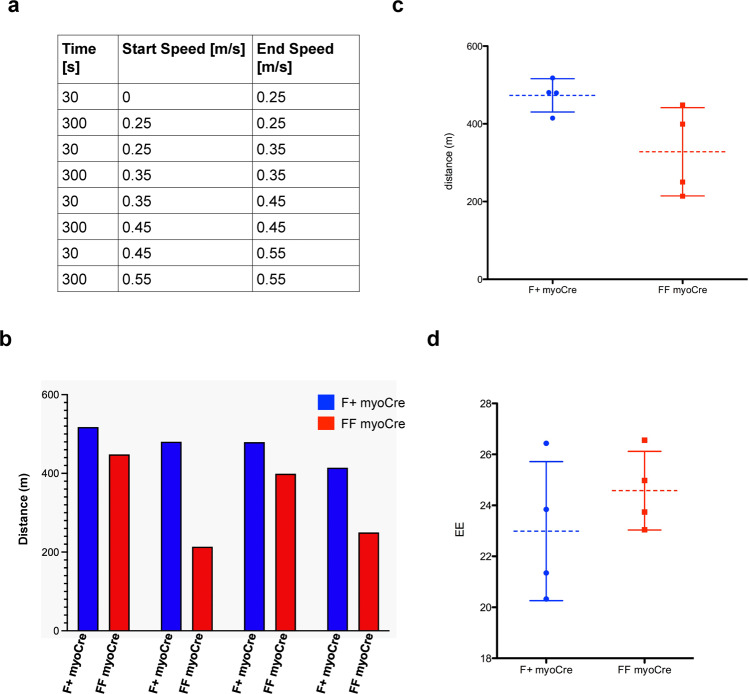
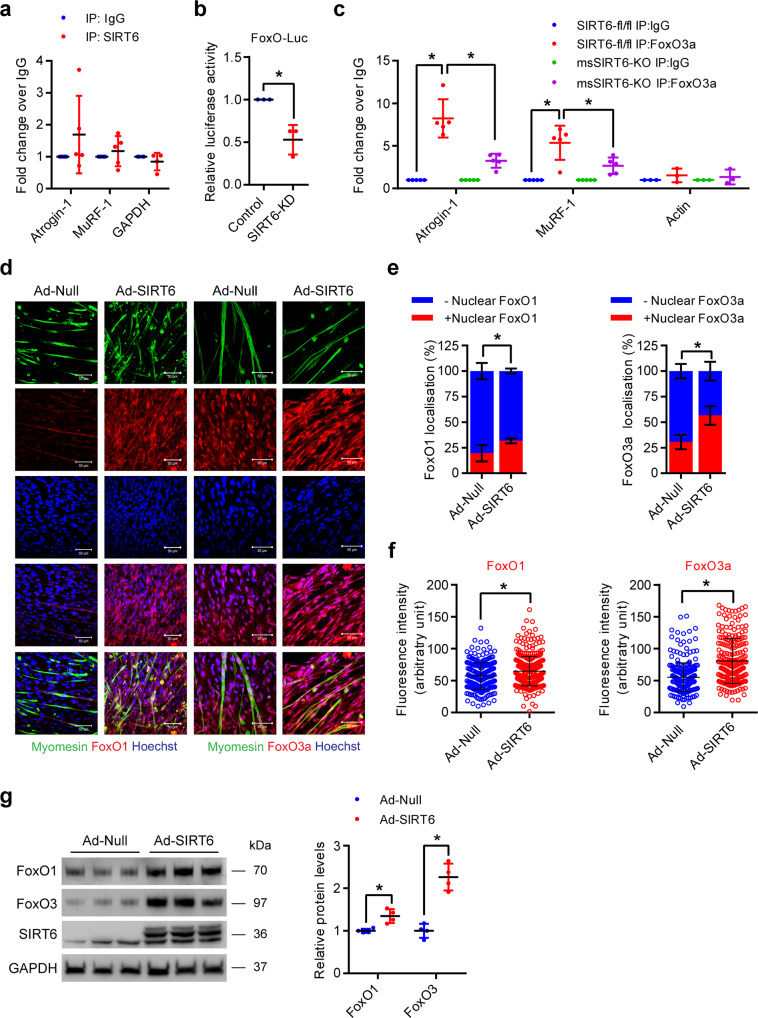
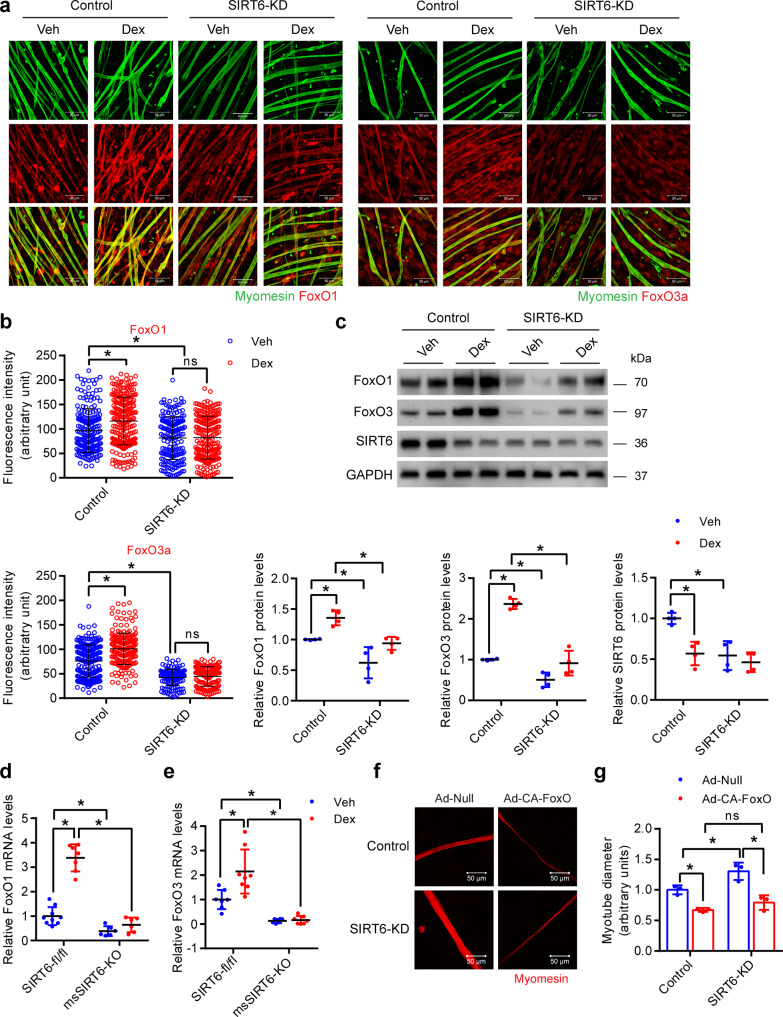
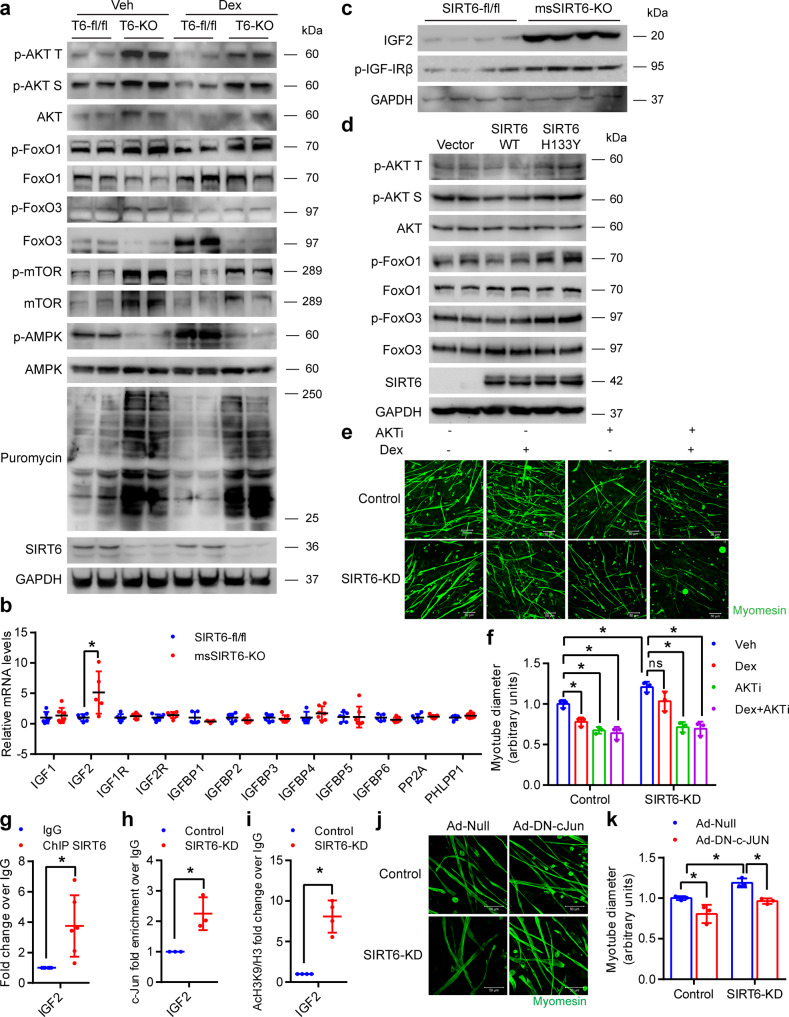
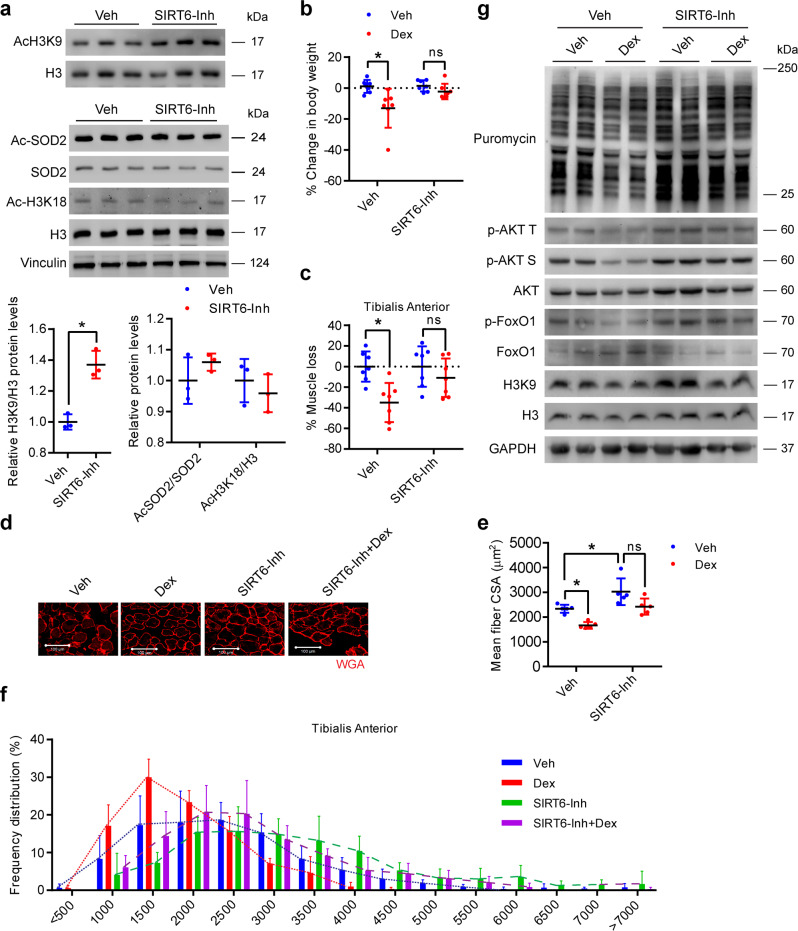
Chronic activation of stress hormones such as glucocorticoids leads to skeletal muscle wasting in mammals. However, the molecular events that mediate glucocorticoid-induced muscle wasting are not well understood. Here, we show that SIRT6, a chromatin-associated deacetylase indirectly regulates glucocorticoid-induced muscle wasting by modulating IGF/PI3K/AKT signaling. Our results show that SIRT6 levels are increased during glucocorticoid-induced reduction of myotube size and during skeletal muscle atrophy in mice. Notably, overexpression of SIRT6 spontaneously decreases the size of primary myotubes in a cell-autonomous manner. On the other hand, SIRT6 depletion increases the diameter of myotubes and protects them against glucocorticoid-induced reduction in myotube size, which is associated with enhanced protein synthesis and repression of atrogenes. In line with this, we find that muscle-specific SIRT6 deficient mice are resistant to glucocorticoid-induced muscle wasting. Mechanistically, we find that SIRT6 deficiency hyperactivates IGF/PI3K/AKT signaling through c-Jun transcription factor-mediated increase in IGF2 expression. The increased activation, in turn, leads to nuclear exclusion and transcriptional repression of the FoxO transcription factor, a key activator of muscle atrophy. Further, we find that pharmacological inhibition of SIRT6 protects against glucocorticoid-induced muscle wasting in mice by regulating IGF/PI3K/AKT signaling implicating the role of SIRT6 in glucocorticoid-induced muscle atrophy.


Conflict of interest statement

R.M. has a financial interest in Galilei Biosciences, a company developing activators of the mammalian SIRT6 protein. R.M.’s interests were reviewed and are managed by MGH and MGB Healthcare in accordance with their conflict-of-interest policies. The other authors declare no competing interests.

Figures

Fig. 1
Fig. 1. Dexamethasone increases SIRT6 levels in muscles and myotubes.
a Change in body weight after Dex administration. n = 8. b Loss in tibialis anterior (TA) muscle after Dex administration. Dex-induced % muscle loss is shown relative to Veh from each time-point. Day 1-Veh n = 5, Day 1-Dex n = 6, Day 7-Veh, Day 15-Veh and Day 15-Dex n = 8, Day 7-Dex n = 7. c Representative images showing wheat germ agglutinin (WGA; red) stained Dex-administered mice TA. Scale bar = 100 µm. d Mean fiber cross-sectional area (CSA) in mice described in c. n = 3. e Frequency distribution of fiber CSA in mice described in c. n = 3. f qPCR analysis for relative expression of atrophy genes in Dex injected mice gastrocnemius. HPRT was used as negative control. Atrogin-1, FoxO1-Veh, FoxO3-Veh, HPRT-Dex n = 6, MuRF-1, FoxO1-Dex, HPRT-Veh n = 5, FoxO3-Dex n = 7. g qPCR analysis for relative expression of SIRT6 in 24 h Dex injected mice gastrocnemius. Veh n = 6, Dex n = 5. h Western blot (left) and quantification (right) of SIRT6 in Dex-administered mice TA. Day 1-Veh n = 5, Day 1-Dex n = 6, Day 7-Veh, Day 15-Veh n = 8, Day 7-Dex, Day 15-Dex n = 7. i Representative confocal image of Dex-treated myotubes stained with myomesin (red). Scale bar = 50 µm. j Quantification of fiber diameter in myotubes described in i. n = 3. k Western blot (left) and quantification (right) of SUnSET analysis in Dex-treated myotubes. Veh n = 6, Dex n = 7. l qPCR analysis for relative expression of SIRT6 in Dex-treated myotubes. n = 6. m Western blot (left) and quantification (right) of SIRT6 in Dex-treated myotubes. Veh n = 5, Dex n = 6. Data presented as mean ± s.d., *p < 0.05. Two-way ANOVA with Bonferroni post hoc test was used for statistical analysis (a, b) and two-tailed unpaired Student’s t-test (d, f, g, h, jm). Dex (10 mg/kg/day) was administered (ah). Myotubes were treated with Dex for 48 h (ik), 24 h (I, m). Source data are provided as a Source Data file.
Fig. 2
Fig. 2. SIRT6 overexpression reduces myotube size.
a Western blot (left) and relative quantification (right) to confirm overexpression of SIRT6 in adenovirus-infected myotubes. n = 5. b Representative confocal images depicting reduction in myotube size upon SIRT6 overexpression in primary myotubes. The myotubes were stained green using an antibody against myomesin. Scale bar = 50 µm. c Quantification of fiber diameter for myotube described in b. n = 6. d Representative confocal images of MuRF-1/2/3 or Atrogin-1 levels upon SIRT6 overexpression in primary myotubes. MuRF-1/2/3 or Atrogin-1 were stained in red and myomesin in green. Scale bar = 50 µm. e Scatterplot showing MuRF-1/2/3 or Atrogin-1 fluorescence intensity in myotubes described in d. MuRF-1/2/3 (Ad-Null n = 332, Ad-SIRT6 n = 242), Atrogin-1 (Ad-Null n = 235, Ad-SIRT6 n = 194). f Western blot (left) and relative quantification (right) of puromycin incorporation in SIRT6 overexpressing primary myotubes. n = 4. Data presented as mean ± s.d., *p < 0.05. Two-tailed unpaired Student’s t-test was used for statistical analysis for a, c, e, f. Source data are provided as a Source Data file.
Fig. 3
Fig. 3. SIRT6 depletion protects against Dex-induced reduction in myotube diameter.
a Western blot (left) and relative quantification (right) to confirm RNAi-mediated depletion of SIRT6 in primary myotube transfected with control siRNA or siRNA targeting SIRT6. n = 6. b Representative confocal images depicting fiber diameter upon SIRT6 depletion in primary myotubes treated with Dex. Myotubes were stained red using an antibody against myomesin, Scale bar = 50 µm. c Quantification of fiber diameter upon SIRT6 depletion in primary myotubes described in b. n = 9. d Representative confocal images of MuRF-1/2/3 or Atrogin-1 levels upon SIRT6 depletion in primary myotubes treated with Dex. MuRF-1/2/3 or Atrogin-1 were stained in red and myomesin in green. Scale bar = 50 µm. e MuRF-1/2/3 or Atrogin-1 fluorescence intensity in myotubes described in d. MuRF-1/2/3 (Control-Veh n = 250, Control-Dex n = 204, SIRT6-KD-Veh n = 187, SIRT6-KD-Dex n = 254), Atrogin-1 (Control-Veh n = 173, Control-Dex n = 131, SIRT6-KD-Veh n = 96, SIRT6-KD-Dex n = 92). f Western blot (left) and relative quantification (right) of protein synthesis in Dex or Veh treated SIRT6 depleted myotubes. Control-Veh n = 7, Control-Dex n = 6, SIRT6-KD-Veh n = 8, SIRT6-KD-Dex n = 7. Data presented as mean ± s.d., *p < 0.05, ns not significant. Two-tailed unpaired Student’s t-test was used for statistical analysis (a), two-way ANOVA with Bonferroni post hoc test (c, e, f). Source data are provided as a Source Data file.
Fig. 4
Fig. 4. Muscle-specific SIRT6 deficient mice are resistant to Dex-induced muscle atrophy.
a Schematic for generation of muscle-specific SIRT6-KO mice (left) and western blotting (right) showing specific deletion of SIRT6 in biceps, gastrocnemius, triceps, quadriceps, tibialis anterior, and soleus muscles of msSIRT6-KO mice. b Change in body weight in SIRT6-fl/fl and msSIRT6-KO mice after Dex or Veh injection. SIRT6-fl/fl-Veh n = 11, SIRT6-fl/fl-Dex n = 12, msSIRT6-KO-Veh n = 9, msSIRT6-KO-Dex n = 9. c Loss in TA muscle mass in SIRT6-fl/fl and msSIRT6-KO mice after Dex administration. % of muscle loss in SIRT6-fl/fl-Dex or msSIRT6-KO-Dex group is shown relative to Veh injected mice muscle from each genotype. SIRT6-fl/fl-Veh n = 11, SIRT6-fl/fl-Dex n = 12, msSIRT6-KO-Veh n = 9, msSIRT6-KO-Dex n = 9. d Representative images showing H&E, Masson’s Trichrome, and WGA (red) staining in SIRT6-fl/fl and msSIRT6-KO mice muscle after Dex injection. H&E and Masson’s Trichrome staining were performed in gastrocnemius muscle. WGA staining was carried out in TA muscle. Scale bar = 100 µm. e Scatterplot showing fibrosis score, scored in a blinded fashion for mice described in d. SIRT6-fl/fl-Veh, msSIRT6-KO-Veh, msSIRT6-KO-Dex n = 5, SIRT6-fl/fl-Dex n = 6. f Scatterplot showing mean fiber CSA in mice described in d. SIRT6-fl/fl-Veh, SIRT6-fl/fl-Dex, msSIRT6-KO-Veh n = 4, msSIRT6-KO-Dex n = 3. g Frequency distribution of fiber CSA in mice described in d. SIRT6-fl/fl-Veh, SIRT6-fl/fl-Dex, msSIRT6-KO-Veh n = 4, msSIRT6-KO-Dex n = 3. h qPCR analysis of Atrogin-1 expression in SIRT6-fl/fl and msSIRT6-KO Dex-treated mice muscle. SIRT6-fl/fl-Veh n = 6, SIRT6-fl/fl-Dex n = 8, msSIRT6-KO-Veh n = 6, msSIRT6-KO-Dex n = 7. i qPCR analysis of MuRF-1 expression in SIRT6-fl/fl and msSIRT6-KO Dex-treated mice muscle. SIRT6-fl/fl-Veh and msSIRT6-KO-Veh n = 8, SIRT6-fl/fl-Dex and msSIRT6-KO-Dex n = 7. Data presented as mean ± s.d., *p < 0.05, ns not significant. Two-way ANOVA with Bonferroni post hoc test was used for statistical analysis (b, c, e, f, h, i). Dex (10 mg/kg/day) was administered to mice. Source data are provided as a Source Data file.
Fig. 5
Fig. 5. Phenotypic characterization of muscle-specific SIRT6 deficient mice line generated using myogenin cre.
a Diagram showing the deletion of Sirt6 in skeletal muscle. C57BL/6 mice containing floxed alleles of Sirt6 were crossed with transgenic mice carrying cre under the control of the muscle-specific myogenin promoter. Myogenin-Cre triggered the recombination of the floxed allele resulting in the deletion of sirt6 specifically in muscle. b PCR of genomic DNA extracted from the tail of myogenin cre mice that were heterozygous (F/+ MyoCre) or homozygous (F/F MyoCre) for the floxed sirt6. c Body weight of F/+ MyoCre and F/F MyoCre mice. n = 3. d Body composition of F/+ MyoCre and F/F MyoCre mice. n = 12. e Glucose Tolerance Test (GTT) were analyzed in 4-months old SIRT6 F/+ MyoCre control and SIRT6 F/F MyoCre mice, as indicated. f Soleus and gastrocnemius muscle from 5 months old F/+ MyoCre and F/F MyoCre mice were collected in OCT and cross-sections were stained with H&E to determine the fiber diameter. 2 mice per genotype. g The maximum diameter of over 200 fibers obtained from 2 mice per genotype was determined in ImageJ and the two data sets were compared by unpaired two tailed t-test. The p value was <0.0001 (****). Data presented as mean ± s.d., Two-tailed unpaired Student’s t-test was used for statistical analysis (c, d, g). Source data are provided as a Source Data file.
Fig. 6
Fig. 6. SIRT6 deletion in muscle does not significantly affect muscle performance in vivo.
The experiment was performed on 4 mice per genotype. a Table summarizing the setting for the muscle performance experiment. In brief, mice ran up to 300 s at each speed. 30 s were allowed to increase the speed between the 300 s intervals. b The histogram represents the distance each pair of mice (F + myoCre and same gender FF myoCre littermate) ran. c Mean distance +/− SD that F + myoCre and FF myoCre mice ran. d Mean energy expenditure during the treadmill run +/− SD. Data presented as mean ± s.d., *p < 0.05, ns not significant. Two-tailed paired Student’s t-test was used for statistical analysis (c, d). Source data are provided as a Source Data file.
Fig. 7
Fig. 7. SIRT6 deficiency reduces FoxO binding to atrogene promoters by regulating its nuclear localization.
a ChIP analysis for SIRT6 binding to Atrogin-1 and MuRF-1 promoters in mice muscle. GAPDH was used as a negative control. Atrogin-1 and MuRF-1 n = 5, GAPDH n = 4. b Relative FoxO luciferase (FHRE-Luc) activity in SIRT6 depleted primary myotubes. n = 3. c ChIP analysis for FoxO3 binding to Atrogin-1 and MuRF-1 promoters in SIRT6-fl/fl and msSIRT6-KO mice muscle. Actin was used as a negative control. Atrogin-1 and MuRF-1 n = 5, Actin n = 3. d Representative confocal images showing subcellular localization and levels of FoxO1 and FoxO3 in SIRT6 overexpressing primary myotubes. FoxO1 or FoxO3 and myomesin were stained red and green respectively. Nuclei are stained blue with Hoechst 33342. Scale bar = 50 µm. e Graph showing FoxO1 and FoxO3 nuclear localization in myotubes described in d. n = 4. f Scatterplot showing FoxO1 and FoxO3 fluorescence intensity in myotubes described in d. FoxO1 (Ad-Null n = 241, Ad-SIRT6 n = 381), FoxO3 (Ad-Null n = 276, Ad-SIRT6 n = 227). g Western blot (left) and relative quantification (right) of FoxO1 and FoxO3 protein levels in SIRT6 overexpressing primary myotubes. n = 4. Data presented as mean ± s.d., *p < 0.05. Two-tailed unpaired Student’s t-test was used for statistical analysis ac, eg. Source data are provided as a Source Data file.
Fig. 8
Fig. 8. Constitutively active FoxO reduces SIRT6 depleted primary myotube diameter.
a Representative confocal image depicting FoxO1 (left) and FoxO3 (right) levels in SIRT6 depleted primary myotubes treated with Dex. FoxO1 or FoxO3 and myomesin were stained red and green respectively. Scale bar = 50 µm. b Quantification of FoxO1 (top) and FoxO3 (bottom) fluorescence intensity in myotubes described in a. FoxO1 (Control-Veh n = 201, Control-Dex n = 242, SIRT6-KD-Veh n = 182, SIRT6-KD-Dex n = 228), FoxO3 (Control-Veh n = 220, Control-Dex n = 219, SIRT6-KD-Veh n = 146, SIRT6-KD Dex n = 152). c Western blot (top) and relative quantification (bottom) of FoxO1, FoxO3 and SIRT6 protein levels in Dex-treated SIRT6 depleted myotubes. FoxO1, FoxO3 and SIRT6 n = 4. d qPCR analysis of FoxO1 levels in SIRT6-fl/fl and msSIRT6-KO mice muscle after Dex treatment. SIRT6-fl/fl-Veh n = 9, SIRT6-fl/fl-Dex n = 7, msSIRT6-KO-Veh and msSIRT6-KO-Dex n = 6. e qPCR analysis of FoxO3 levels in SIRT6-fl/fl and msSIRT6-KO mice muscle after Dex adminstration. SIRT6-fl/fl-Veh n = 7, SIRT6-fl/fl-Dex n = 8, msSIRT6-KO-Veh n = 6, msSIRT6-KO-Dex n = 7. f Representative confocal images depicting diameter of SIRT6 depleted primary myotubes infected with either constitutively active FoxO (Ad-CA-FoxO) or null adenovirus. The myotubes were stained red using antibody against myomesin. Scale bar = 50 µm. g Quantification for fiber diameter in myotube described in f. n = 3. Data presented as mean ± s.d., *p < 0.05, ns not significant. Two-way ANOVA with Bonferroni post hoc test was used for statistical analysis (be, g). Dex (10 mg/kg/day) was administered (d, e). Source data are provided as a Source Data file.
Fig. 9
Fig. 9. Muscle-specific SIRT6 deficient mice show hyperactive IGF/AKT signaling.
a Representative western blotting of AKT signaling proteins, phosphorylated protein levels of AMPK, total AMPK, and SUnSET analysis of protein synthesis in SIRT6-fl/fl and msSIRT6-KO mice gastrocnemius muscle after Dex or Veh injection for 15 days and quantifications are shown in Supplementary Fig. 16A–O. b qPCR analysis for expression of positive and negative regulators of IGF signaling in SIRT6-fl/fl and msSIRT6-KO mice muscle. n = 5-7. c Representative western blotting of IGF2 and phosphorylated protein levels of IGF-I-Receptor β in SIRT6-fl/fl and msSIRT6-KO mice muscle and quantifications are shown in Supplementary Fig. 18A. d Western blotting images of phosphorylated and total protein levels of AKT, FoxO1, and FoxO3 in SIRT6 stable knockdown 293T cells transfected with pcDNA, SIRT6-WT, or SIRT6-H133Y plasmids and quantifications are shown in Supplementary Fig. 18B–E. e Representative confocal images showing myotube diameter in AKTi-1/2 and/or Dex-treated SIRT6 depleted myotubes. The myotubes were stained green with antibody against myomesin. Scale bar = 50 µm. f Quantification of myotube described in e. n = 3. g ChIP analysis of SIRT6 binding to IGF2 promoter in C2C12 myotubes. n = 6. h ChIP analysis of c-Jun binding to IGF2 promoter in control or SIRT6 depleted C2C12 myotubes. n = 3. i ChIP analysis for acetylation of histone 3, lysine 9 residue at IGF2 promoter in control or SIRT6 depleted C2C12 myotubes. n = 4. j Representative confocal images showing myotube diameter in SIRT6 depleted myotubes infected with either c-Jun dominant-negative (Ad-DN-c-Jun) or null adenovirus. The myotubes were stained green using an antibody against myomesin. Scale bar = 50 µm. k Quantification of myotube diameter described in j. n = 3. Data presented as mean ± s.d., *p < 0.05. Two-tailed unpaired Student’s t-test was used was statistical analysis (b, fi). Two-way ANOVA with Bonferroni post hoc test was used for statistical analysis (k). Dex (10 mg/kg/day) was administered (a). Source data are provided as a Source Data file.
Fig. 10
Fig. 10. SIRT6 inhibition protects mice against dexamethasone-induced muscle atrophy.
a Western blotting (top) and relative quantification (bottom) indicating the increase in global acetylation of histone 3 at lysine 9 in the gastrocnemius muscle of SIRT6 inhibitor (SIRT6-Inh) administered mice. Western blot (middle) and relative quantification (bottom) of protein levels of acetylated SOD2 and global acetylation of histone 3 at lysine 18 normalized to SOD2 and histone 3 respectively in SIRT6-Inh treated mice soleus muscle. n = 3. b Change in body weight in SIRT6-Inh treated mice after Dex injection. n = 7. c Loss in TA muscle mass from SIRT6-Inh treated mice after Dex injection. n = 7. % of muscle loss in the Dex or SIRT6-Inh-Dex group is shown relative to Veh injected mice for the respective group. d Representative images showing WGA (red) stained SIRT6-Inh treated mice after Dex injection to determine the CSA. Scale bar = 100 µm. e Scatterplot showing mean fiber CSA in mice described in d. n = 5. f Frequency distribution of fiber cross-sectional area in mice described in d. n = 5. g Representative western blotting of AKT signaling, SUnSET analysis of protein synthesis, and global acetylation of histone 3 at lysine 9 in SIRT6-Inh administered mice with/without Dex treatment. Western blot quantifications are shown in Supplementary Fig. 21A–I. Data presented as mean ± s.d., ns not significant. Two-tailed unpaired Student’s t-test was used for statistical analysis a. Two-way ANOVA with Bonferroni post hoc test was used for statistical analysis (b, c, e). Dex (20 mg/kg/day) and SIRT6-Inh (15 mg/kg/day) was administered. Source data are provided as a Source Data file.

References

    1. Dutt V, Gupta S, Dabur R, Injeti E, Mittal A. Skeletal muscle atrophy: Potential therapeutic agents and their mechanisms of action. Pharm. Res. 2015;99:86–100. doi: 10.1016/j.phrs.2015.05.010. - DOI - PubMed
    1. Schiaffino S, Dyar KA, Ciciliot S, Blaauw B, Sandri M. Mechanisms regulating skeletal muscle growth and atrophy. FEBS J. 2013;280:4294–4314. doi: 10.1111/febs.12253. - DOI - PubMed
    1. Ventadour S, Attaix D. Mechanisms of skeletal muscle atrophy. Curr. Opin. Rheumatol. 2006;18:631–635. doi: 10.1097/01.bor.0000245731.25383.de. - DOI - PubMed
    1. Braun TP, Marks DL. The regulation of muscle mass by endogenous glucocorticoids. Front. Physiol. 2015;6:12. doi: 10.3389/fphys.2015.00012. - DOI - PMC - PubMed
    1. Savary I, et al. Effect of glucocorticoid excess on skeletal muscle and heart protein synthesis in adult and old rats. Brit J. Nutr. 1998;79:297–304. doi: 10.1079/BJN19980047. - DOI - PubMed

Publication types

LinkOut - more resources