. 2022 Sep 15;13(1):5424.
doi: 10.1038/s41467-022-33156-5.

Reconstitution of microtubule into GTP-responsive nanocapsules

Affiliations

Reconstitution of microtubule into GTP-responsive nanocapsules

Noriyuki Uchida et al. Nat Commun. .

Abstract

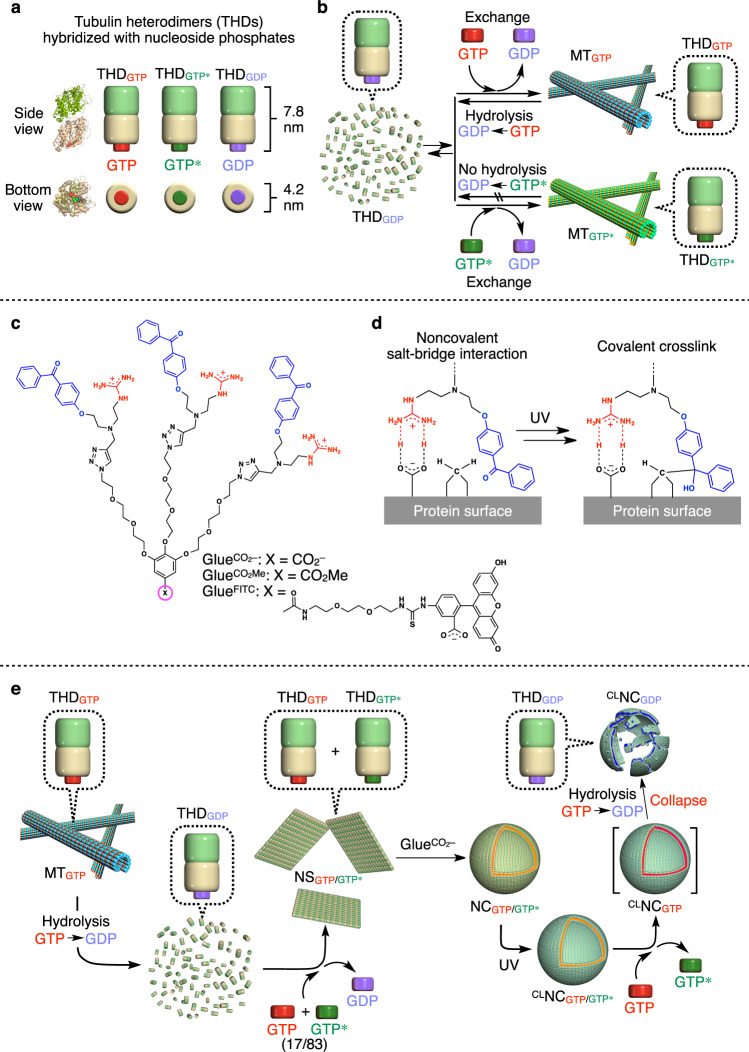
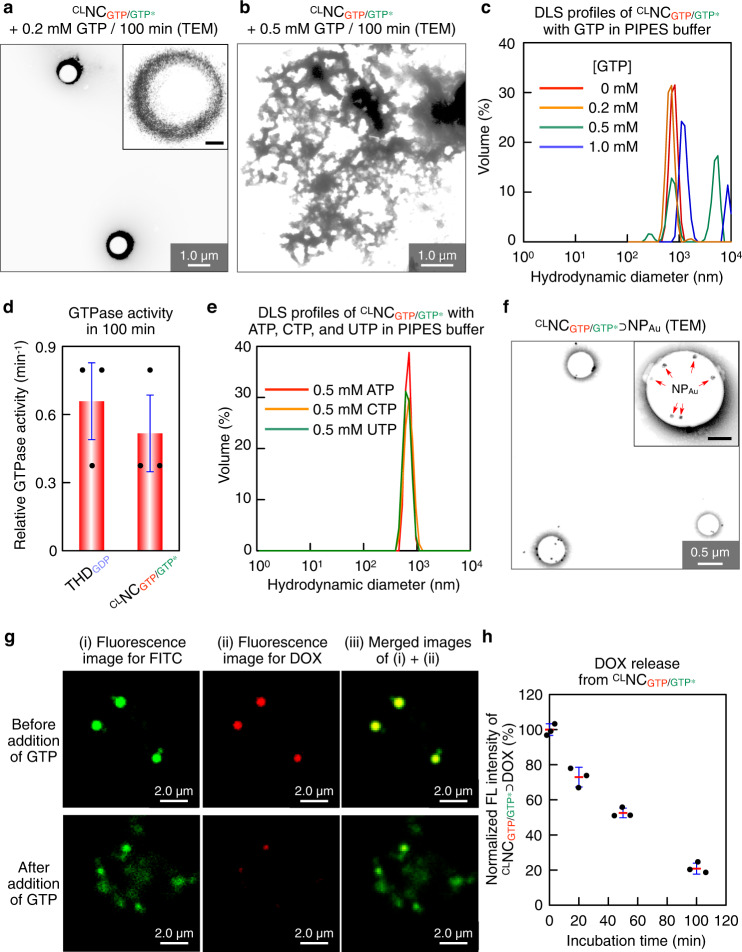
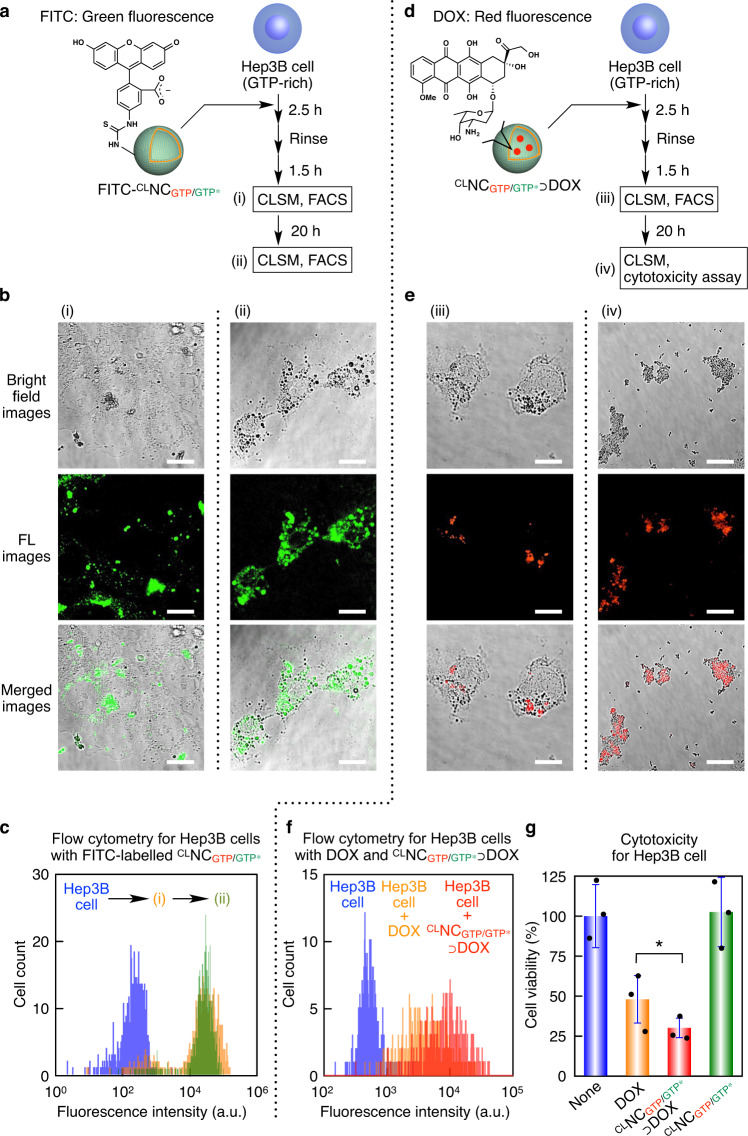
Nanocapsules that collapse in response to guanosine triphosphate (GTP) have the potential as drug carriers for efficiently curing diseases caused by cancer and RNA viruses because GTP is present at high levels in such diseased cells and tissues. However, known GTP-responsive carriers also respond to adenosine triphosphate (ATP), which is abundant in normal cells as well. Here, we report the elaborate reconstitution of microtubule into a nanocapsule that selectively responds to GTP. When the tubulin monomer from microtubule is incubated at 37 °C with a mixture of GTP (17 mol%) and nonhydrolysable GTP* (83 mol%), a tubulin nanosheet forms. Upon addition of photoreactive molecular glue to the resulting dispersion, the nanosheet is transformed into a nanocapsule. Cell death results when a doxorubicin-containing nanocapsule, after photochemically crosslinked for properly stabilizing its shell, is taken up into cancer cells that overexpress GTP.


Conflict of interest statement

The authors declare no competing interests.

Figures

Fig. 1
Fig. 1. Strategy used to prepare THD-based GTP-responsive CLNCGTP/GTP*.
a Schematic illustrations of tubulin heterodimers (THDs) hybridized with GTP (THDGTP), its nonhydrolysable analogue GTP* (THDGTP*), and GDP (THDGDP) at its β-tubulin unit. b Schematic illustration of two self-assembling modes of THD into microtubules (MTs). MTGTP depolymerizes into THDGDP upon GTP hydrolysis. THDGDP rehybridizes with GTP after a GTP treatment, facilitating the formation of MTGTP. In contrast, MTGTP* does not undergo depolymerization. c Molecular structures of photoreactive molecular glues (GlueCO2, GlueCO2Me, and GlueFITC) bearing three guanidinium ions (Gu+) and benzophenone (BP) groups at their periphery and CO2, CO2 Me, and FITC groups at the focal core. d The molecular glue covalently binds to the protein surface at its photoexcited BP groups after the noncovalent adhesion via a Gu+/oxyanion multivalent salt-bridge interaction. e Schematic illustration of the multistep procedure for the synthesis of crosslinked nanocapsules (CLNCGTP/GTP*) from MTGTP. MTGTP is depolymerized into THDGDP, which is incubated with a mixture of GTP* (83 mol%) and GTP (17 mol%) to form nanosheet NSGTP/GTP*. Upon treatment with GlueCO2, NSGTP/GTP* is transformed into spherical nanocapsules (NCGTP/GTP*), which are further exposed to UV light, affording CLNCGTP/GTP*. Upon addition of GTP, CLNCGTP/GTP* collapses through the conformational change of the THD units induced by GTP hydrolysis.
Fig. 2
Fig. 2. Reconstitution of MT into CLNCGTP/GTP*.
a A typical synthetic procedure for the preparation of CLNCGTP/GTP*. b DLS profiles of MTGTP (gray), THDGDP (blue), NSGTP/GTP* (green), NCGTP/GTP* (orange), and CLNCGTP/GTP* (red) in PIPES buffer. ce TEM images of MTGTP (5.8 mg ml–1; c), THDGDP (0.3 mg ml–1; d), and NSGTP/GTP* (0.3 mg ml–1; e). f AFM image of NSGTP/GTP* (0.3 mg ml–1) and its height profile. g, h TEM images of NCGTP/GTP* (13 µg ml–1; g) and CLNCGTP/GTP* (13 µg ml–1; h). All TEM samples were negatively stained with uranyl acetate. Inset scale bars, 250 nm.
Fig. 3
Fig. 3. MD simulation of the adhesion events of GlueCO2– onto the surface of THDGTP*.
a Three laterally assembled THDGTP* units ([THDGTP*]3) in MTGTP* as a partial model of NS. b An equilibrated MD snapshot of GlueCO2. c, d The outer (c) and inner (d) views of [THDGTP*]3 hybridized with 30 equivalents of GlueCO2. e, f The outer (e) and inner (f) views of [THDGTP*]3 with its electrostatic surface potential in the absence (upper) and presence (lower) of 30 equivalents of hybridized GlueCO2. Negative and positive potential areas are colored in red and blue, respectively. g The percentage of hydrophobic solvent-accessible surface area in the absence (47.5 ± 0.5; red) and presence (56.7 ± 2.0; blue) of 30 equivalents of hybridized GlueCO2. Bars represent mean values ± SD from 2000 data points. h, i [THDGTP*]3 observed from the top view (h) and its angle distributions (i) in the absence (red) and presence (blue) of 30 equivalents of hybridized GlueCO2. j Radial distribution functions g(r) of the Gu+ groups in GlueCO2 with carboxylates (blue) and non-ionic hydroxyl groups (gray) on the [THDGTP*]3 surface, and the carboxylate at the focal core of GlueCO2 (red). k Schematic illustration of a possible adhesion event of GlueCO2 onto NSGTP/GTP* and its effects on the features of NSGTP/GTP*. The Gu+ groups in GlueCO2 form a salt bridge with carboxylates on the NSGTP/GTP* surface and at the focal core of GlueCO2, and the GlueCO2-based polymeric network thus formed through this process increases the hydrophobicity of the NSGTP/GTP* surface, making NSGTP/GTP* more flatten.
Fig. 4
Fig. 4. GTP-triggered collapse of CLNCGTP/GTP*.
a, b TEM images of CLNCGTP/GTP* after a 100-min incubation with GTP at its concentrations of 0.2 mM (a) and 0.5 mM (b). c DLS profiles of CLNCGTP/GTP* (8.7 µg ml–1) in PIPES buffer after a 100-min incubation with GTP at its concentrations of 0 mM (red), 0.2 mM (orange), 0.5 mM (green), and 1 mM (blue). d GTPase activities of THDGDP (left) and CLNCGTP/GTP* (right) in PIPES buffer. The data was obtained from three biologically independent samples (n = 3). e DLS profiles of CLNCGTP/GTP* (8.7 µg ml–1) in PIPES buffer after a 100-min incubation with 1 mM of ATP (red), CTP (orange), and UTP (green). f TEM image of CLNCGTP/GTP*⊃NPAu ([CLNCGTP/GTP*] = 13 µg ml–1, [NPAu] = 13 pM). g CLSM images of FITC-labeled CLNCGTP/GTP*⊃DOX ([CLNCGTP/GTP*] = 13 µg ml–1, [DOX] = 10 µM) incubated without (upper panel) and with (lower panel) 1 mM GTP at 37 °C for 100 min. Micrographs display locations of FITC (i, green) and DOX (ii, red), and their merged images (iii). Scale bars, 2.0 µm. h Fluorescence intensities at 590 nm (λext = 470 nm) of residual DOX obtained after 20, 50, and 100-min incubations of a PIPES solution of CLNCGTP/GTP*⊃DOX with 1 mM GTP, followed by ultrafiltration. Red bars represent mean values ± SD from three different samples.
Fig. 5
Fig. 5. Intracellular drug delivery using CLNCGTP/GTP*.
a Schematic illustration of the uptake of FITC-labeled CLNCGTP/GTP* into Hep3B cells. b Bright field (upper row) and CLSM images displaying FITC (middle row, green) in Hep3B cells and their merged images (lower row). The cells were incubated in EMEM containing CLNCGTP/GTP* (0.5 µg ml–1) for 2.5 h, rinsed with D-PBS, and further incubated in EMEM (10% FBS) for 1.5 h (i) and 21.5 h (ii). Scale bars, 20 µm. c Flow cytometry profiles showing FITC fluorescence of Hep3B cells (n > 660) incubated without (blue) and with FITC-labeled CLNCGTP/GTP* for 2.5 h, rinsed with D-PBS, and further incubated in EMEM (10% FBS) for 1.5 h (i, orange) and 21.5 h (ii, green). d Schematic illustration of the cellular uptake of CLNCGTP/GTP*⊃DOX. e Bright field (upper row) and CLSM images displaying DOX (middle row, red) in Hep3B cells and their merged images (lower row). The cells were incubated in EMEM containing CLNCGTP/GTP*⊃DOX ([CLNCGTP/GTP*] = 2.6 µg ml–1, [DOX] = 2 µM) for 2.5 h, rinsed with D-PBS, and further incubated in EMEM (10% FBS) for 1.5 h (iii) and 21.5 h (iv). Scale bars, 20 µm. f, g Flow cytometry profiles (f) showing DOX fluorescence of Hep3B cells (n > 390) and their normalized viabilities (g) determined using Cell Counting Kit-8 (n = 3). The cells were incubated without (blue) and with DOX (2 µM; orange), and CLNCGTP/GTP*⊃DOX ([CLNCGTP/GTP*] = 2.6 µg ml–1, [DOX] = 2 µM; red) for 2.5 h in EMEM, and then rinsed with D-PBS, followed by incubation in EMEM (10% FBS) for 21.5 h. Statistical significance was examined by two-sided Student’s t test (*p = 0.0094 < 0.01). Bars represent mean values ± SD from three different samples.

References

    1. Sawyers C. Targeted cancer therapy. Nature. 2004;432:294–297. doi: 10.1038/nature03095. - DOI - PubMed
    1. Srinivasarao M, Low PS. Ligand-targeted drug delivery. Chem. Rev. 2017;117:12133–12164. doi: 10.1021/acs.chemrev.7b00013. - DOI - PubMed
    1. Biswas S, et al. Biomolecular robotics for chemomechanically driven guest delivery fuelled by intracellular ATP. Nat. Chem. 2013;5:613–620. doi: 10.1038/nchem.1681. - DOI - PubMed
    1. Naito M, et al. A phenylboronate-functionalized polyion complex micelle for ATP-triggered release of siRNA. Angew. Chem. Int. Ed. 2012;51:10751–10755. doi: 10.1002/anie.201203360. - DOI - PubMed
    1. Jie D, Andreas W. ATP-responsive and ATP-fueled self-assembling systems and materials. Adv. Mater. 2020;32:2002629. doi: 10.1002/adma.202002629. - DOI - PubMed

Publication types

MeSH terms