. 2022 Sep 15;13(1):5403.
doi: 10.1038/s41467-022-33092-4.

Murine fetal bone marrow does not support functional hematopoietic stem and progenitor cells until birth

Affiliations

Murine fetal bone marrow does not support functional hematopoietic stem and progenitor cells until birth

Trent D Hall et al. Nat Commun. .

Abstract

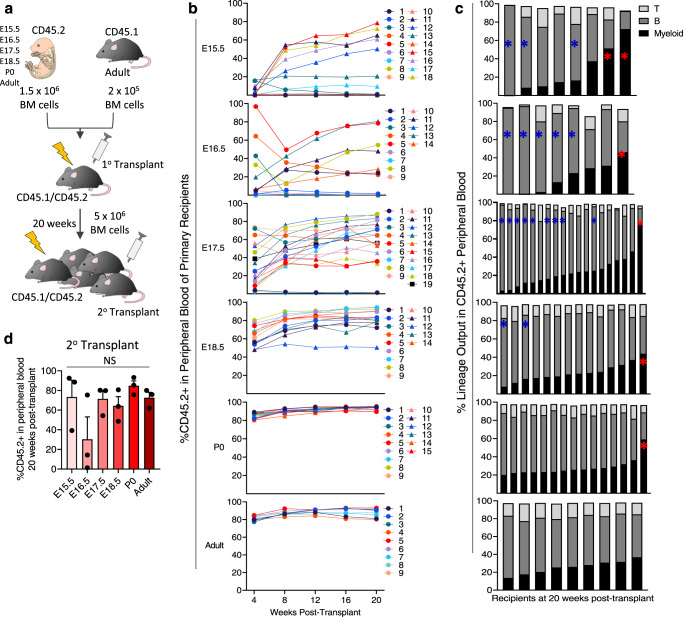
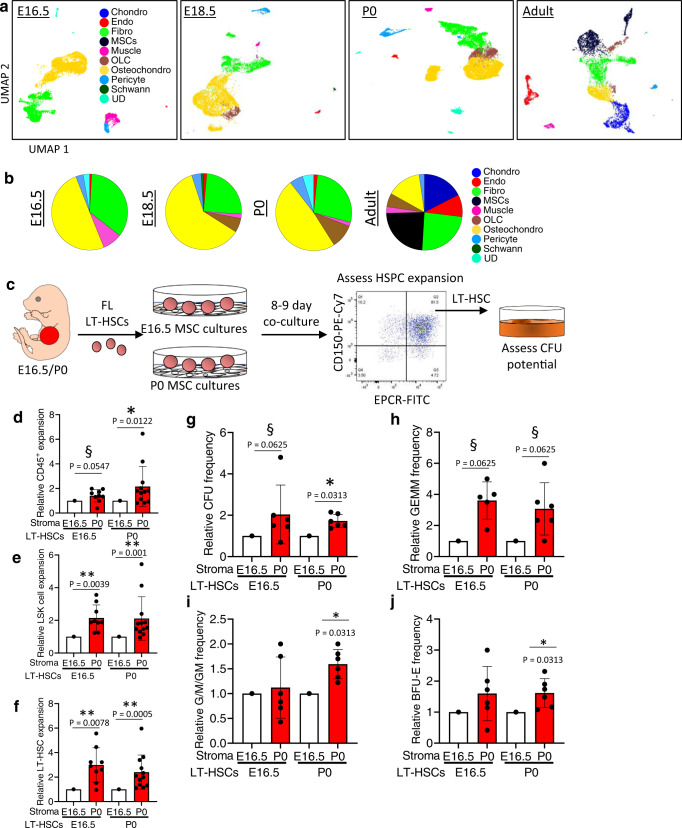
While adult bone marrow (BM) hematopoietic stem and progenitor cells (HSPCs) and their extrinsic regulation is well studied, little is known about the composition, function, and extrinsic regulation of the first HSPCs to enter the BM during development. Here, we functionally interrogate murine BM HSPCs from E15.5 through P0. Our work reveals that fetal BM HSPCs are present by E15.5, but distinct from the HSPC pool seen in fetal liver, both phenotypically and functionally, until near birth. We also generate a transcriptional atlas of perinatal BM HSPCs and the BM niche in mice across ontogeny, revealing that fetal BM lacks HSPCs with robust intrinsic stem cell programs, as well as niche cells supportive of HSPCs. In contrast, stem cell programs are preserved in neonatal BM HSPCs, which reside in a niche expressing HSC supportive factors distinct from those seen in adults. Collectively, our results provide important insights into the factors shaping hematopoiesis during this understudied window of hematopoietic development.


Conflict of interest statement

The authors declare no competing interests.

Figures

Fig. 1
Fig. 1. Long-term repopulating cells are detected in FBM at E15.5.
a FBM primary and secondary transplant. b PB reconstitution in FBM primary recipients (n = 9–18). c Lineage output in individual primary recipients 20 weeks post-transplant (n = 8–19); myeloid bias (%myeloid > %B cell), red asterisk; b-lymphoid bias (%B cell >70%), blue asterisk. d %CD45.2+ PB in secondary recipients of FBM. Data are means ± SE of three independent transplants (n = 5/transplant, Mann–Whitney test, two-tailed). 1o, primary; 2o, secondary; BM bone marrow, FBM fetal BM; NS not significant. Source data are provided in the Source Data File. See also Supplementary Fig. 1.
Fig. 2
Fig. 2. FBM HSPC frequency is distinct from FL and adult BM.
Frequency in LSK cells (a, b) and absolute number (c, d) of HSPCs in murine liver (a, c) and BM (b, d). Data are means ± SE of 10–17 embryos from 2–3 litters. **** in b: P < 0.0001 comparing MPP2 frequencies; **** in c: P < 0.0001 comparing total HSPC numbers. e Representative flow cytometry of cell-surface CXCR4 on E15.5-P0 FL HSPCs (n = 2–3). f CXCL12 trans-well migration assay. g Migration of fetal and newborn liver HPSCs towards CXCL12. Data are mean ± SE of three distinct experiments. P values determined by Mann–Whitney test, two-tailed. CFU colony-forming unit, HSC hematopoietic stem cell, HSPC hematopoietic stem and progenitors, LSK Lineage-Sca1+c-Kit+, LT-HSC long-term HSC, MPP multipotent progenitor, ST-HSC short-term HSC. Source data are provided in the Source Data File. See also Supplementary Fig. 2.
Fig. 3
Fig. 3. FBM MPP2s are functionally distinct from FL and adult BM MPP2s.
a CFU assay of single MPP2 and LT-HSC cells. b BM and liver MPP2 CFUs frequency. Data are means ± SE of 87–171 single cells from three distinct experiments. c Frequency of CFUs among LT-HSCs from BM and liver. Data are means ± SE of 111–175 single cells from three separate experiments. d MPP2 and LT-HSC transplant. e %CD45.2/GFP PB lineages in BM MPP2 transplant recipients (n = 9–10 recipients/timepoint). f %CD45.2/GFP PB lineages in liver MPP2 recipients (n = 5–9 recipients/timepoint). g %CD45.2/GFP PB lineages in LT-HSC recipients at 16 weeks post-transplant (n = 9–14 recipients/timepoint). Platelets: *P = 0.0102; Erythrocytes: * top, P = 0.0162; * bottom, P = 0.0440. h %Recipients with long-term PB donor reconstitution in (g) (n = 9-14 recipients). §P = 0.1; *p < 0.05. P values determined by Mann–Whitney test, two-tailed. BM bone marrow, CFU colony-forming unit, FBM fetal BM, FL fetal liver, G granulocyte, GEMM granulocyte/erythroid/ monocyte/megakaryocyte, HSC hematopoietic stem cell, LT-HSC long-term HSC, M monocyte, MegE megakaryocyte/erythroid, MPP multipotent progenitor. Source data are provided in the Source Data File. See also Supplementary Fig. 3.
Fig. 4
Fig. 4. Remodeling of perinatal BM HP and HSPCs during late gestation.
a ScRNA-seq of HPs of perinatal and adult BM. b UMAP projections of cell clusters of HPs from adult, P0, E18.5, and E16.5 BM. c CITE-Seq dot plots for identification of phHSPCs. d UMAP projection of P0 BM depicting Sca-1 mRNA and CITE-Seq. e Distribution of phMPP2s or phLT-HSCs in each cell cluster of adult, P0, E18.5, or E16.5 HPs. f hscScore among phMPP2s (left, n = 55–147 single cells; ***P = 0.0008; ****P < 0.0001) or phLT-HSCs (right, n = 26–46 single cells; *P = 0.0254; ***P = 0.0001; ****P < 0.0001) across development. Data are presented as means ± SD. g Expression level of hscScore-related genes within phMPP2s and phLT-HSCs across development. P values determined by Mann–Whitney test, two-tailed. BM bone marrow, CITE-Seq cellular indexing of transcriptomes and epitopes by sequencing, Ery/Meg erythroid/megakaryocyte, HP hematopoietic progenitors, HSPCs hematopoietic stem and progenitors, LT-HSC long-term hematopoietic stem cell, Mono/DC monocyte/dendritic cells, MPP multipotent progenitor, ph immunophenotypic, Prog progenitors, scRNA-seq single-cell RNA-sequencing, UD undefined. Source data are provided in the Source Data File. See also Supplementary Fig. 4.
Fig. 5
Fig. 5. Early FBM HSPCs lack functional HSPC transcriptional programs.
Integration of phLT-HSCs (a) and phMPP2s (b) from all developmental timepoints. c Primary GO Terms for phLT-HSCs and phMPP2s. d Trajectory analysis and GO terms (e, f) of perinatal phLT-HSCs. g Trajectory anlaysis and GO terms (h, i) of perinatal phMPP2s. “Early” and “Late” cells were determined by dissecting PC1 according to clear separation of cells by developmental time. P-values determined by Bonferroni correction. BM bone marrow, FBM fetal BM, GO gene ontology, HSPC hematopoietic stem and progenitors, LT-HSC long-term hematopoietic stem cells, MPP multipotent progenitor, ph immunophenotypic. See also Supplementary Fig. 5.
Fig. 6
Fig. 6. FL and FBM HP and HSPCs are transcriptionally distinct.
a, b Merge of FBM phLT-HSCs across development with E16.5 and P0 FL LT-HSCs. c GO terms for FBM phLT-HSCs and FL LT-HSCs at E16.5 and P0. d Merge of E16.5 Lin-Kit+ cells from FBM and FL. e Merge of P0 Lin-Kit+ cells from BM and liver. f GO terms for E16.5 FBM T cells (left), E16.5 FBM Mast cells (middle), and E16.5 FL Ery/Meg cells (right). g Differentiated cell output of E16.5 FL LT-HSCs cultured with or without E16.5 BM MSCs. ***P = 0.0008; ****P < 0.0001. c, f P values determined by Bonferroni correction. g P values determined by Mann–Whitney test, two-tailed. BM bone marrow, Eos/Bas eosinophil/basophil, Ery/Meg erythroid/megakaryocyte, FBM fetal BM, FL fetal liver, GO gene ontology, HP hematopoietic progenitors, HSPC hematopoietic stem and progenitors, LT-HSC long-term hematopoietic stem cell, MPP multipotent progenitor, MSCs mesenchymal stroma cells, ph immunophenotypic. Source data are provided in the Source Data File. See also Supplementary Fig 5e.
Fig. 7
Fig. 7. Postnatal bone marrow displays enhanced capacity as an LT-HSC supportive niche compared to fetal bone marrow.
a UMAP projections of E16.5, E18.5, P0, and adult BM stroma. b Distribution of stroma amongst E16.5, E18.5, P0, or adult libraries. c Co-culture of fetal liver LT-HSCs on E16.5 and P0 BM MSC cultures to determine the effects on HSPC expansion and CFU potential. Relative expansion of d CD45+, e LSK, and f LT-HSC cells on P0 BM stroma compared to E16.5 BM stroma. Data represent mean and standard deviation (n = 9–12). Relative frequency of (g) total CFU, (h) GEMM, (i) G/M/GM, and j BFU-E colonies from FL LT-HSCs after co-culture with P0 BM stroma compared to E16.5 BM stroma. Data represent mean and standard deviation (n = 6). §P < 0.1; *P < 0.05; **P < 0.01. P values were determined via Wilcoxon Signed Rank Test, two-tailed. BFU-E burst-forming unit-erythroid, BM bone marrow, CFU colony-forming unit, Chondro chondrocytes, Endo, endothelial cells, Fibro fibroblasts, FL fetal liver, G granulocyte, GEMM granulocyte/erythroid/monocyte/megakaryocyte, HSPC hematopoietic stem and progenitors; LSK Lineage-Sca1+c-Kit+, LT-HSC long-term hematopoietic stem cells, M monocyte, MSCs mesenchymal stem cells, OLC osteolineage cells, Osteochondro osteochondro progenitors, UD undefined cluster. Source data are provided in the Source Data File. See also Supplementary Fig. 6 and Supplementary Fig. 7.
Fig. 8
Fig. 8. Physical niches and niche factors for perinatal BM HSPCs.
a RNA-Magnet workflow. b Normalized interaction scores of ligand-receptor pairs with significant interaction (secreted ligand from stroma, receptor from phLT-HSCs) c Normalized interaction scores of ligand-receptor pairs with significant interaction (secreted ligand from stroma, receptor from phMPP2s). Interaction scores for each significant ligand-receptor pair (rows) across development within clusters of the phLT-HSC (d) or phMPP2 (e) physical niche (columns, with dominant stromal cell type indicated for each physical niche cluster). f Schematic of P0 FL HSCs co-cultures with IGF1 or IGF2 siRNA-treated P0 MSCs. g # phLT-HSCs after 8 days of FL LT-HSCs co-culture on control, IGF1, IGF2 or IGF1/2 siRNA-treated P0 MSCs (n = 6; *P = 0.0260; **P = 0.0087; ***P = 0.0022). h Total # CFUs via phLT-HSCs isolated from co-cultures in (g) (n = 3, §P = 0.1). Data are presented as means ± SD. P values determined by Mann–Whitney Test, two-tailed. BM, bone marrow, CFU colony-forming unit, EC endothelial cells, Fibro fibroblast, FL fetal liver, HSPC hematopoietic stem and progenitors, KD knockdown, LT-HSC long-term hematopoietic stem cells, MPP multipotent progenitors, MSC mesenchymal stroma cells, N.S, not significant, NT non-targeting control, OLC osteolineage cell, Osteochondro osteochondroprogenitor, ph immunophenotypic, Sig. significant, UD undefined cluster. Source data are provided in the Source Data File. See also Supplementary Fig. 8.

References

    1. Weissman IL, Shizuru JA. The origins of the identification and isolation of hematopoietic stem cells, and their capability to induce donor-specific transplantation tolerance and treat autoimmune diseases. Blood. 2008;112:3543–3553. doi: 10.1182/blood-2008-08-078220. - DOI - PMC - PubMed
    1. Eaves CJ. Hematopoietic stem cells: concepts, definitions, and the new reality. Blood. 2015;125:2605–2613. doi: 10.1182/blood-2014-12-570200. - DOI - PMC - PubMed
    1. Medvinsky A, Rybtsov S, Taoudi S. Embryonic origin of the adult hematopoietic system: advances and questions. Development. 2011;138:1017–1031. doi: 10.1242/dev.040998. - DOI - PubMed
    1. De La Garza A, Sinha A, Bowman TV. Concise review: hematopoietic stem cell origins: lessons from embryogenesis for improving regenerative medicine. Stem Cells Transl. Med. 2017;6:60–67. doi: 10.5966/sctm.2016-0110. - DOI - PMC - PubMed
    1. Langen UH, et al. Cell-matrix signals specify bone endothelial cells during developmental osteogenesis. Nat. Cell Biol. 2017;19:189–201. doi: 10.1038/ncb3476. - DOI - PMC - PubMed

Publication types