Meta-Analysis
. 2022 Sep;28(9):1913-1923.
doi: 10.1038/s41591-022-01964-3. Epub 2022 Sep 15.

Variability of strain engraftment and predictability of microbiome composition after fecal microbiota transplantation across different diseases

Affiliations
Meta-Analysis

Variability of strain engraftment and predictability of microbiome composition after fecal microbiota transplantation across different diseases

Gianluca Ianiro et al. Nat Med. 2022 Sep.

Abstract

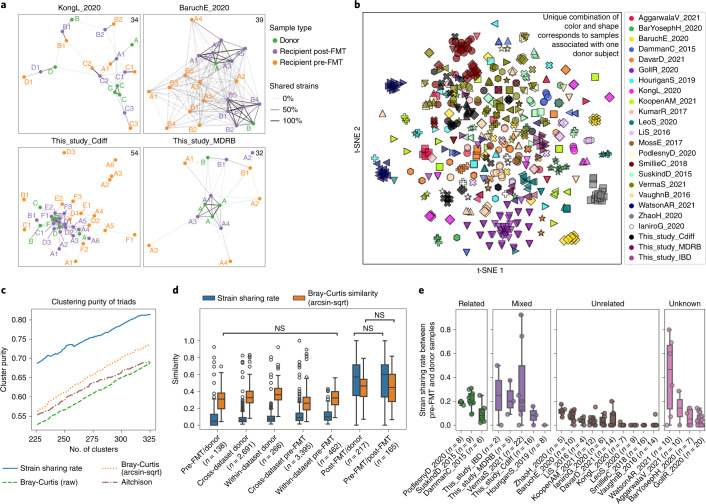
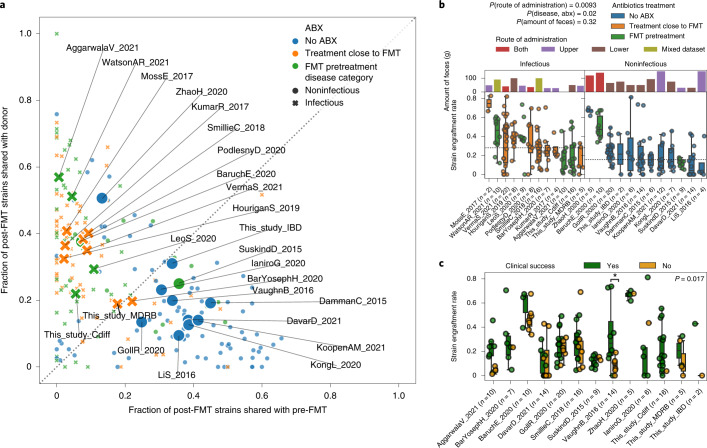
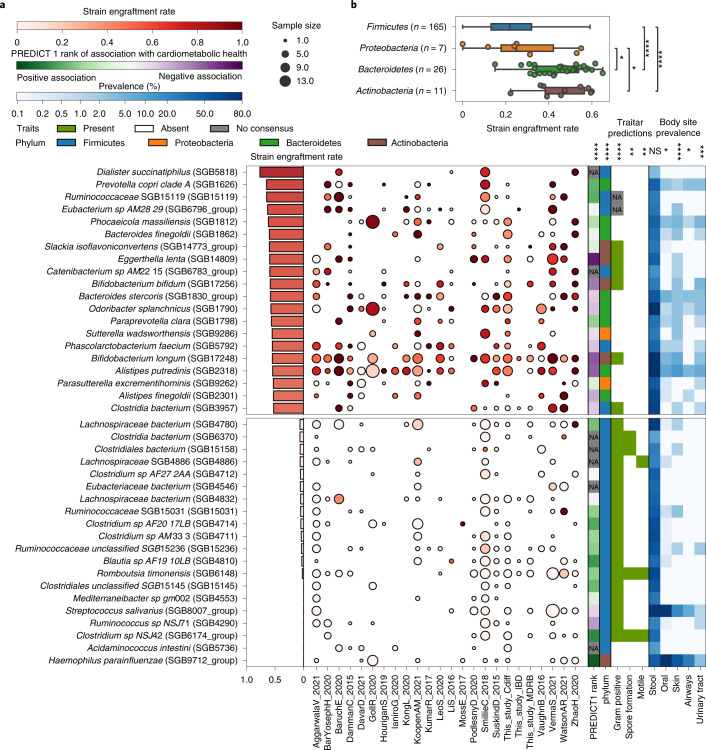
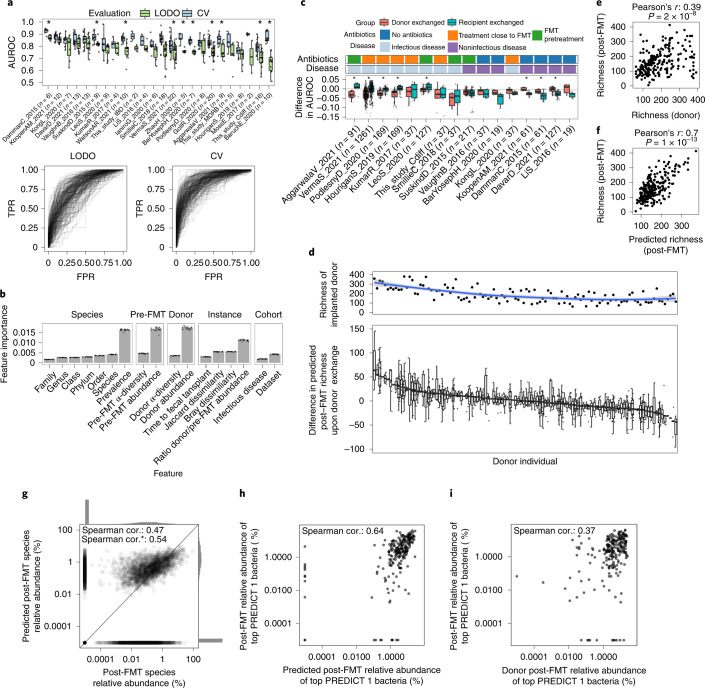
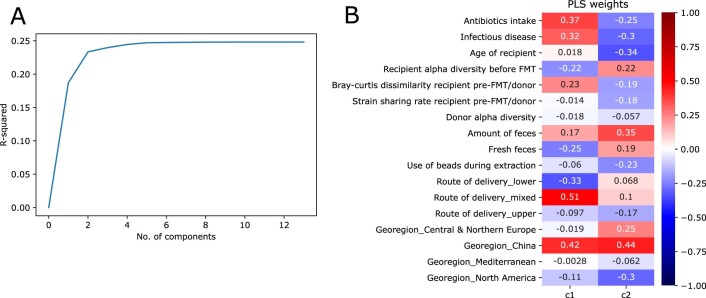
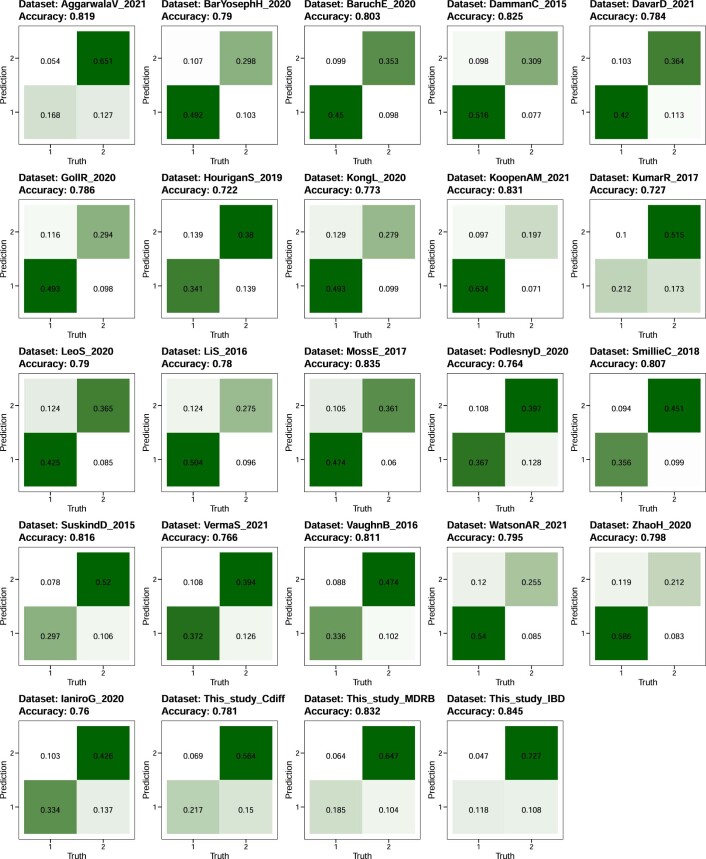
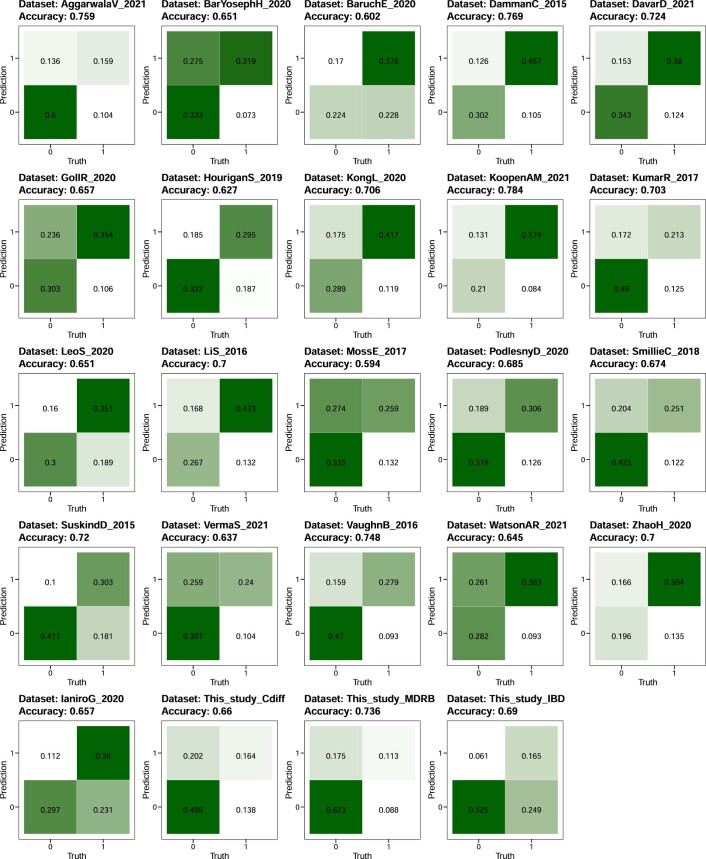
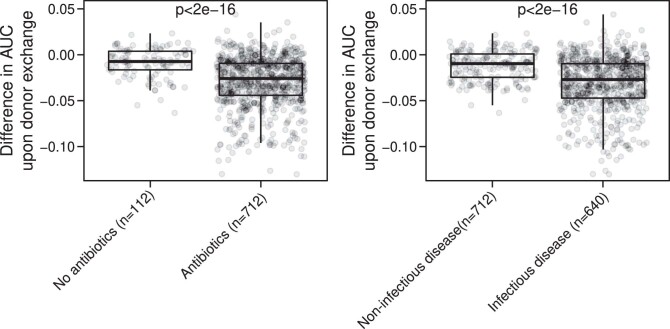
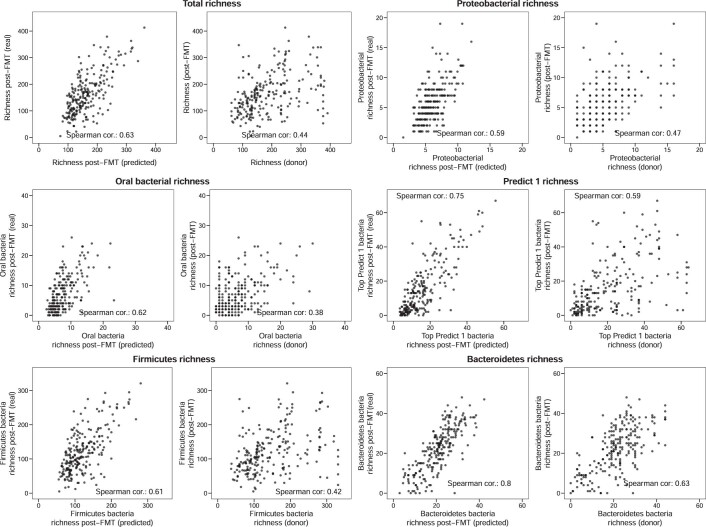
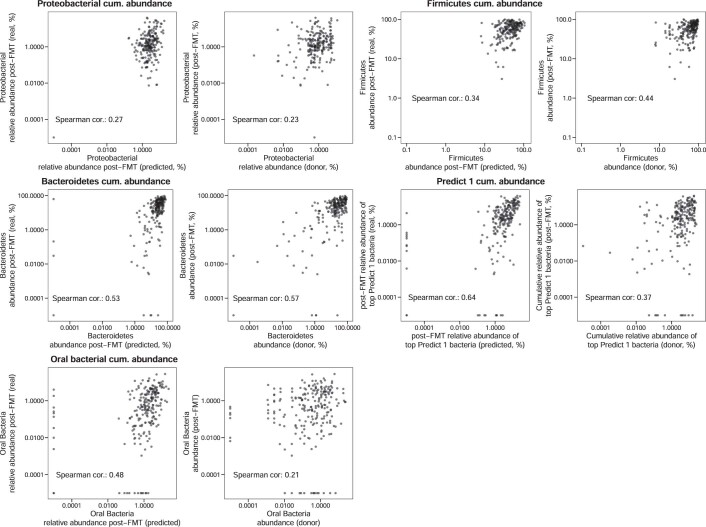
Fecal microbiota transplantation (FMT) is highly effective against recurrent Clostridioides difficile infection and is considered a promising treatment for other microbiome-related disorders, but a comprehensive understanding of microbial engraftment dynamics is lacking, which prevents informed applications of this therapeutic approach. Here, we performed an integrated shotgun metagenomic systematic meta-analysis of new and publicly available stool microbiomes collected from 226 triads of donors, pre-FMT recipients and post-FMT recipients across eight different disease types. By leveraging improved metagenomic strain-profiling to infer strain sharing, we found that recipients with higher donor strain engraftment were more likely to experience clinical success after FMT (P = 0.017) when evaluated across studies. Considering all cohorts, increased engraftment was noted in individuals receiving FMT from multiple routes (for example, both via capsules and colonoscopy during the same treatment) as well as in antibiotic-treated recipients with infectious diseases compared with antibiotic-naïve patients with noncommunicable diseases. Bacteroidetes and Actinobacteria species (including Bifidobacteria) displayed higher engraftment than Firmicutes except for six under-characterized Firmicutes species. Cross-dataset machine learning predicted the presence or absence of species in the post-FMT recipient at 0.77 average AUROC in leave-one-dataset-out evaluation, and highlighted the relevance of microbial abundance, prevalence and taxonomy to infer post-FMT species presence. By exploring the dynamics of microbiome engraftment after FMT and their association with clinical variables, our study uncovered species-specific engraftment patterns and presented machine learning models able to predict donors that might optimize post-FMT specific microbiome characteristics for disease-targeted FMT protocols.


Conflict of interest statement

A.G. reports personal fees for consultancy for Eisai S.r.l., 3PSolutions, Real Time Meeting, Fondazione Istituto Danone, Sinergie S.r.l. Board MRGE and SanofiS.p.A; personal fees for acting as a speaker for Takeda S.p.A, AbbVie and Sandoz S.p.A; and personal fees for acting on advisory boards for VSL3 and Eisai. G.C. has received personal fees for acting as advisor for Ferring Therapeutics. G.I. has received personal fees for acting as speaker for Biocodex, Danone, Sofar, Malesci, Metagenics and Tillotts Pharma, and for acting as consultant/advisor for Ferring Therapeutics, Giuliani, Metagenics and Tillotts Pharma. N.S. reports consultancy and/or SAB contracts with Zoe, Roche, Ysopia, and Freya, Alia Therapeutics, speaker fees by Illumina, and is cofounder of PreBiomics. The other authors have no potential competing interest to disclose.

Figures

Fig. 1
Fig. 1. Overview of microbial strain sharing in FMT studies.
a, Strain-sharing networks of the two new FMT cohorts with C. difficile and MDRB colonization and of two published FMT cohorts,. Nodes represent samples and are colored by role in FMT triads. The letters correspond to the donor subject and letter/number combinations indicate both associated donors (the letter) and FMT instance membership (the number) of pre-/post-FMT samples. Edges report strain sharing (minimum 2) and their opacity is scaled to the maximum number of shared strains in each dataset (indicated in the top right corner). Extended Data Fig. 1 reports the networks of all 24 datasets. b, Ordination of samples from all cohorts based on strain sharing rates (t-SNE with perplexity = 20). See Extended Data Fig. 3 for a PCoA ordination. c, Strain-sharing enabled more precise reconstructions of the true FMT triads compared with species-level β-diversities (Extended Data Fig. 2 and Supplementary Table 5). We compare the K-medoids clustering purity of FMT triads between strain-sharing distances and on Bray–Curtis dissimilarities/Aitchison distances as a function of the number of clusters K. d, Strain-sharing rate and Bray–Curtis similarity between pairs of samples show that strain-sharing rates increase much more after FMT compared with Bray–Curtis similarity. Significance was assessed by Mann–Whitney U-tests and the two-tailed P values were FDR-adjusted using the BH method. All pairwise tests are significant except for those labeled NS. All P and Q values are reported in Supplementary Table 6. e, Distribution of strain-sharing rates between donor and corresponding recipient pre-FMT samples showing that donors share more strains with recipients pre-FMT when the individuals are ‘related’ (same family/household or friends; Methods). Boxplots report the median and upper/lower quartiles, whiskers are at 1.5 times higher/lower of the upper/lower quartiles.
Fig. 2
Fig. 2. Variability of strain engraftment and retention across disease, antibiotics use and clinical success.
a, Distribution of the fraction of donor strains and the fraction of retained strains present in the post-FMT samples for all FMT triads, showing a separation between higher fraction of donor strains and higher fraction of retained strains that associates with antibiotics administration and disease category. Small points represent individual FMT triads and large labeled marks represent per dataset averages. b, Variability of strain engraftment rate by disease category, antibiotics usage and route and amount of administered feces, highlighting the complex association between these variables and strain engraftment rates. The horizontal line is the median of per dataset medians. The statistical tests are performed by permuting the variables associated with datasets (two-tailed permutation test route of administration mixed versus lower or upper P = 0.0093, antibiotics and infectious disease versus no antibiotics and noninfectious disease in datasets employing single route of administration P = 0.02, amount of feces P = 0.32). c, Association between clinical success of FMT and strain engraftment rates for the 13 studies in which the information on clinical success was available and for which at least one recipient was in each group. The definition of clinical success for each study is reported in Supplementary Table 1. Permutation tests with success labels permuted within each dataset pointed at an overall significant association of strain engraftment with clinical success (two-tailed P = 0.017), that was significant in only 1 of the 13 datasets when considered individually (VaughnB_2016 Mann–Whitney U-test with two-tailed P = 0.039). Boxplots plots report the median and upper/lower quartiles, whiskers are at 1.5 times higher/lower of the upper/lower quartiles.
Fig. 3
Fig. 3. Bacterial strain engraftment rates across datasets and their associations with phenotypic properties, cardiometabolic health and prevalence.
a, Overall and within-dataset strain engraftment rates and associations of species with predicted phenotypic properties, cardiometabolic health and prevalence (%) in different human body sites. Overall strain engraftment rate is computed over all triads. Out of 211 species assessed (Supplementary Table 8), the 20 species displaying highest and lowest engraftment rates are reported. Associations with continuous variables were tested with Spearman’s rank correlation tests, while those with binary categorical variables were tested with the Mann–Whitney U-test. The association with phylum was tested with the Kruskal–Wallis test. Tests were performed for all species including those not shown, and P values were FDR corrected using the BH method (Supplementary Table 10). Significance levels (NS, nonsignificant, *Q < 0.05, **Q < 0.01, ***Q < 0.001, ****Q < 1 × 10–4) are reported above each metadata column. Sample size is defined as the number of FMT triads in which the species could engraft as defined by the strain engraftment rate measure (Methods). b, Strain engraftment rates are significantly associated with bacterial phyla (Kruskal–Wallis test, P = 3 × 10–11; post hoc Dunn tests FDR corrected using the BH method, Firmicutes versus Bacteroides Q = 8.0 × 10–9, Firmicutes versus Actinobacteria Q = 3 × 10–5, Proteobacteria versus Bacteroidetes Q = 0.037, Proteobacteria versus Actinobacteria Q = 0.037, the remaining pairs are NS, that is Q > 0.1). The Euryarchaeota and Verrucomicrobia phyla were omitted from the analysis as only one species in each of those phyla was assessed in our analysis. Boxplots report the median and upper/lower quartiles, whiskers are at 1.5 times higher/lower of the upper/lower quartiles. NA, not applicable.
Fig. 4
Fig. 4. RF models predict post-FMT microbiome composition and the effect of different donors on the post-FMT microbiome.
a, RF predictions of the presence or absence of species post-FMT. LODO and CV AUROC are reported and represented as true positive rates (TPR) versus false positive rates (FPR). b, The relative importance of microbial features in the LODO model (n = 24 for each bar). Data are presented as mean, error bars correspond to s.d. c, Distribution of the changes in AUROC values for the LODO models of a upon donor exchange (Methods). d, Top panel, species richness of FMT donors. The blue line is a locally estimated scatterplot smoothing fit, the shaded area corresponds to the 95% confidence interval. Bottom panel, difference in post-FMT species richness upon donor exchange with respect to the predicted post-FMT species richness of the real triad n(total) = 1,317. e, Donor species richness is positively correlated with recipient’s post-FMT species richness (Pearson’s correlation test, r = 0.39, P = 2 × 10–8). f, Predicted post-FMT species richness is strongly correlated with the actual post-FMT richness (Pearson’s correlation test, r = 0.7, P = 1 × 10–13). g, An RF regression model is able to predict bacterial abundances in the post-FMT microbiome. The asterisk designates the Spearman correlation (cor.) when omitting truly absent species predicted to be absent. Individual datasets are reported in Supplementary Fig. 10. h, The cumulative abundance of the top 20% PREDICT 1 bacteria post-FMT can be predicted fairly accurately using the RF regression model. i, Donor abundance is a worse predictor of the cumulative abundance of the top 20% PREDICT 1 bacteria than the RF regression model. Boxplots report the median and upper/lower quartiles, whiskers are at 1.5 times higher/lower of the upper/lower quartiles.
Extended Data Fig. 1
Extended Data Fig. 1. Strain sharing networks for the datasets included in this study not shown in Fig. 1A.
Each node corresponds to a sample and is colored by its role in FMT triads (recipient pre-FMT sample, recipient post-FMT sample, and donor's sample). Edge opacity is proportional to the number of shared strains between two samples (Methods) and only edges corresponding to at least 2 shared strains are shown. The structure of the networks illustrates how FMT triads tend to cluster together but with different clustering characteristics across cohorts.
Extended Data Fig. 2
Extended Data Fig. 2. The purity of K-medoids clustering with varying K shows that strain sharing rate outperforms β-diversity measures in clustering by donor associations and by FMT triads.
In clustering by cohorts for the low number of clusters it gets outperformed by Aitchison distance, but catches up as the K increases.
Extended Data Fig. 3
Extended Data Fig. 3. PCoA ordination on strain sharing rate distances and variance explained by number of components, suggesting that two dimensions are not sufficient to linearly separate the clusters induced by dataset or donor batch effects.
Unique combinations of color and shape correspond to samples associated with one donor subject.
Extended Data Fig. 4
Extended Data Fig. 4. Strain sharing rates between donor and post-FMT samples is non-significantly higher in datasets using related or a mixture of related and unrelated donors compared to those using only unrelated donors (related or mixed vs unrelated, permutation test, p=0.383).
Box plots are defined as follows: the center line and upper and lower limit of the box correspond to the median, upper quartile and lower quartile respectively. The whiskers are defined by that data point that is at most 1.5 times higher than the upper quartile (upper whisker) or 1.5 times lower than the lower quartile (lower whisker).
Extended Data Fig. 5
Extended Data Fig. 5. Partial least squares regression of various variables of interest against strain engraftment rate.
A) Most of the explained variance in strain engraftment rate is covered by the first two components. B) The weights of the variables in the first two components.
Extended Data Fig. 6
Random forest classifier prediction accuracies of post-FMT species presence/absence (CV).
Extended Data Fig. 7
Random forest classifier prediction accuracies of post-FMT species presence/absence (LODO).
Extended Data Fig. 8
Extended Data Fig. 8. Boxplots of the difference in AUC upon simulated donor exchange.
Mann-Whitney U-test two-tailed p<2e-16 for both infectious vs. non-infectious disease and antibiotics vs. no antibiotics comparisons. Box plots are defined as follows: the center line and upper and lower limit of the box correspond to the median, upper quartile and lower quartile respectively. The whiskers are defined by that data point that is at most 1.5 times higher than the upper quartile (upper whisker) or 1.5 times lower than the lower quartile (lower whisker).
Extended Data Fig. 9
Extended Data Fig. 9. Comparisons of the predicted total species richness of bacterial groups in post-FMT samples.
Predictions on the y-axis come from the RF classifier, predictions on the x-axis correspond to the cumulative richness in donor samples.
Extended Data Fig. 10
Extended Data Fig. 10. Comparisons of the predicted cumulative abundance of bacterial groups in post-FMT samples.
Predictions on the y-axis come from the RF regressor, predictions on the x-axis correspond to the cumulative abundance in donor samples.

Comment in

References

    1. Ianiro G, et al. Incidence of bloodstream infections, length of hospital stay, and survival in patients with recurrent Clostridioides difficile infection treated with fecal microbiota transplantation or antibiotics: a prospective cohort study. Ann. Intern. Med. 2019;171:695–702. - PubMed
    1. Baunwall SMD, et al. Faecal microbiota transplantation for recurrent Clostridioides difficile infection: an updated systematic review and meta-analysis. EClinicalMedicine. 2020;29–30:100642. - PMC - PubMed
    1. Cammarota G, et al. International consensus conference on stool banking for faecal microbiota transplantation in clinical practice. Gut. 2019;68:2111–2121. - PMC - PubMed
    1. De Groot PF, Frissen MN, De Clercq NC, Nieuwdorp M. Fecal microbiota transplantation in metabolic syndrome: history, present and future. Gut Microbes. 2017;8:253–267. - PMC - PubMed
    1. Rossen NG, et al. Findings from a randomized controlled trial of fecal transplantation for patients with ulcerative colitis. Gastroenterology. 2015;149:110–118.e4. - PubMed

Publication types

Substances